This is my blog section. In my blog posts at this website I will dive into my journey in aviation and related topics. Here all new blog posts will be showed categorized in years with my newest post up top.
From the left, you can find all my post categories ordered in folders which can be expanded. On the right you can find the various tags and categories and on any blog page you can find the Table of Contents.
Flight Lessons
This category contains the details of my flight lessons, where I dive into the theory of the exercises for review and the learning processes. The lessons are categorized into phases:
Phase 1: Learning to fly
Phase 2: Learning to fly good
Phase 3: Learning to Navigate
Phase 4: Advanced lessons
Phase 1
This category contains the details of my flight lessons in Phase 1, where you learn to fly.
1.1 Basics
In my first flight lesson for my Private Pilot Lesson, I have been introduced to multiple aspects of flying. In the past, around 3 years before this first PPL lesson, I did a trial lesson where I only controlled the plane at around 2500 feet, but only controlled the yoke, rudder pedals and trims.
This page can contain a collection of personal notes, steps to remember, finished and unfinished content. Please excuse brevity.
Do not use specific information given like fuel flow, landing/take-off distances for your flights. Always refer to the POH of your exact plane for flight preparation. My information is just for references that I used.
Introduction
Lesson number
Lesson name
Lesson date(s)
1.1
Basics
25-07-2025
In my first flight lesson for my Private Pilot License journey. I have been introduced to multiple aspects of flying. In the past, around 3 years before this first PPL lesson, I did a trial lesson where I only controlled the plane at around 2.500 feet, but only controlled the yoke, rudder pedals and trims.
This lesson it was the first time after around 300 hours of Microsoft Flight Simulator (Haha) where I controlled the plane for the full flight except the landing phase. In the PPL learning curve, you will perform this after around 8–9 lessons when doing take-off and landing/circuit exercises from lesson 1.8.
The theory of this lesson mostly consisted of:
Flight preparation and planning
Aircraft Technical Log (ATL) and Hold Item List (HIL)
Standard Operating Procedures (SOPs)
The multiple instances
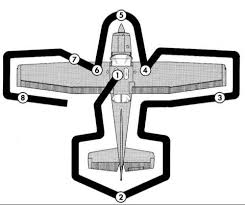
Performing a proper walkaround
Flight Preparation (ANWB)
Before we step into a plane, we are required to plan and prepare our flight. We don’t want to be unprepared when flying, and also both the pilot flying and pilot monitoring must be on the same pace.
My flight school uses the ANWB abbreviation for this:
Aircraft
NOTAMs
Weather
Briefings
In each stage we check all related things and we search for reasons or risks not to fly. ANWB is also the national traffic/roadside assistance organization so everybody from the Netherlands already knows this abbreviation.
Aircraft
In the aircraft stage we check and calculate the following things:
ABC: Departure airfield, destination and our alternate. We always must have a backup airfield.
Aircraft Technical Log (ATL):
All issues before maintenance are resolved
First flight after maintenance: flight controls and trim check are critical
Hold Item List (HIL): Flyable but inoperative items (e.g. autopilot or landing lights)
Fuel calculation: Ensure enough fuel, including reserve and alternate
Mass and Balance:
Passenger and baggage weight affect fuel capacity
Utility limits must be respected during aerobatics
NOTAMs
NOTAMs (Notice to Air Missions) contain information about possible risks, such as:
Runway closures
Military or government restrictions
High cranes or temporary obstacles
Defect obstacle lighting
ILS or VOR outages
We check NOTAMs for:
Departure airport
Destination airport
Alternate airport
En-route
Weather
Weather is one of the most unpredictable factors. We check:
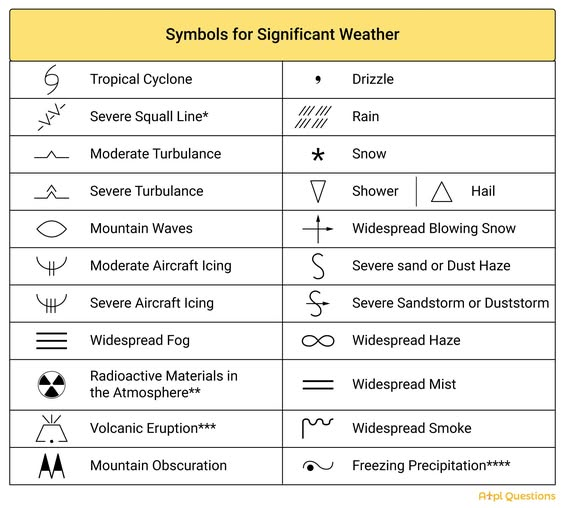
SWC (Significant Weather Chart) – above 15,000 ft
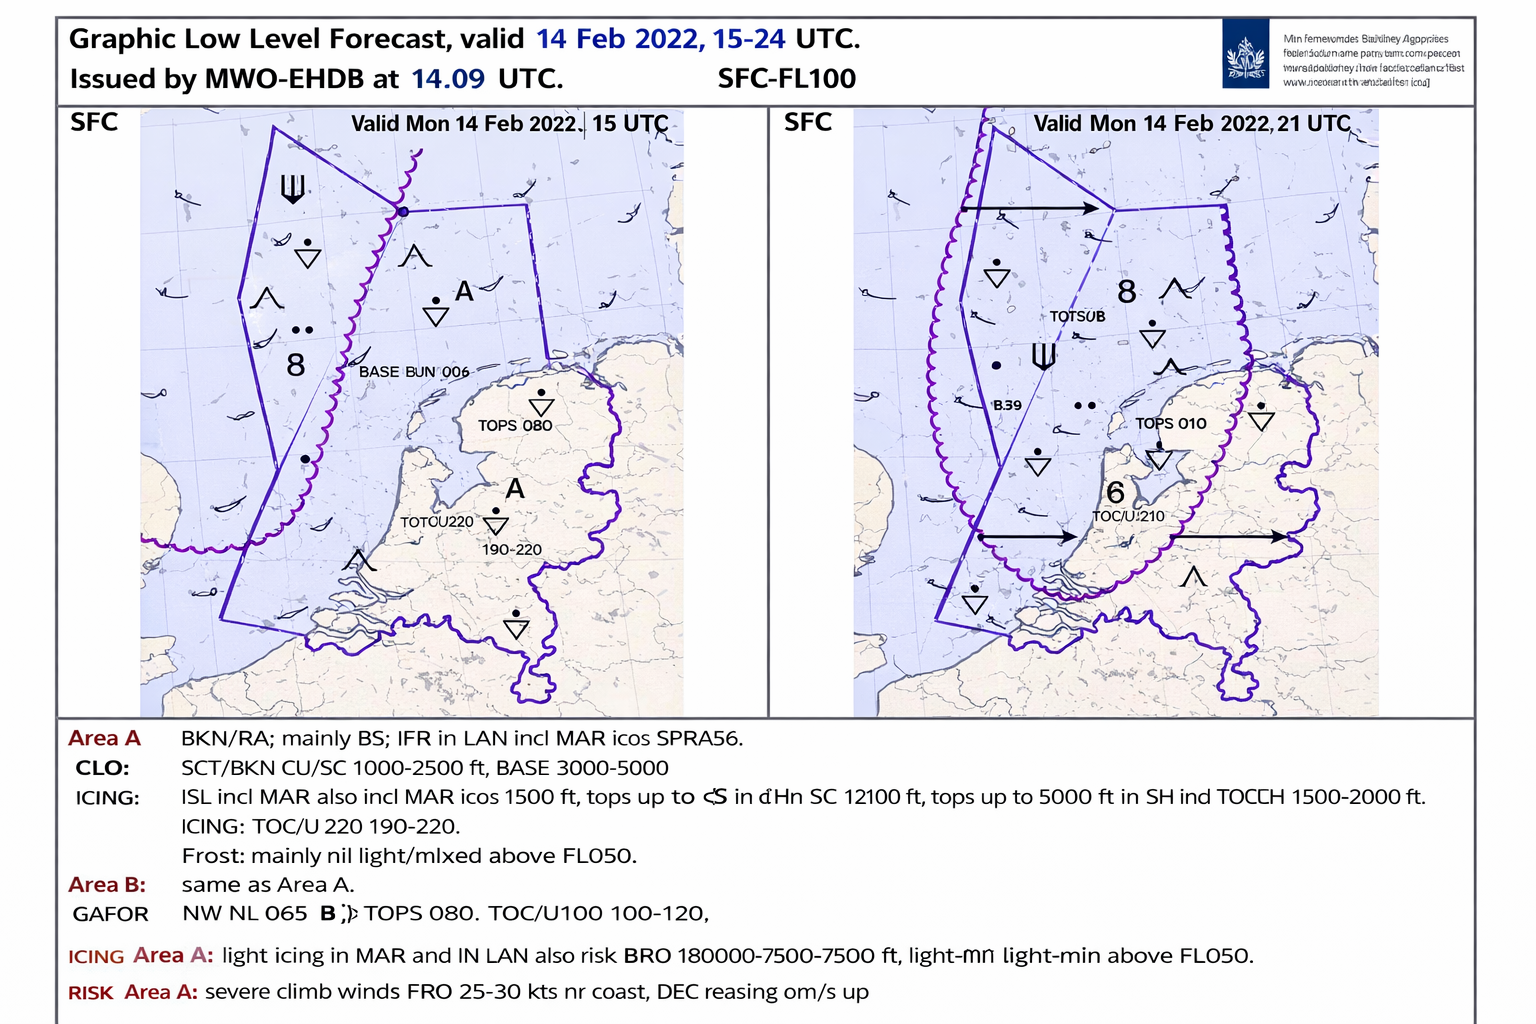
LLFC (Low Level Forecast Chart) – below 15,000 ft
SIGWX
GAFOR / GLLFC
Briefings
In the briefing phase we inform crew and passengers about:
The route
Destination aerodrome
Threat and Error Management (TEM)
Questions from passengers
These were all points from the flight preparation.
Aviation Instances
In aviation, multiple organizations oversee safety and regulations:
ICAO: International procedures and recommendations
EASA: European legally binding aviation rules
LVNL: Dutch airspace authority
Performing the Pre-flight Inspection (Walk-around)
Before every flight we must perform a pre-flight inspection to avoid surprises in the air.
During the walk-around we check:
Oil leaks
Tires (grip and canvas)
Brakes
Ailerons
Rudder
Flaps
Elevator
Engine oil (min. 5 qt for C172)
Fuel quantity and water
Pitot cover removed
ATL onboard
Flight controls free and correct
⚠️ Note Pre-flight inspection steps differ per aircraft. Always refer to the official aircraft operating manual.
Starting the Aircraft
After confirming airworthiness, we proceed with engine start.
Most training aircraft have a hot prop, meaning the propeller can start the engine if the magnetos are active. This is when the key is turned to R, L, Both or Start. Therefore:
Key must be removed when outside the aircraft
Propeller rotation can power magnetos
We then:
Set seats and seatbelts
Close doors and windows
Complete Before Start checklist
Mixture full rich
Call: “On the brakes”
Start the engine
Taxiing
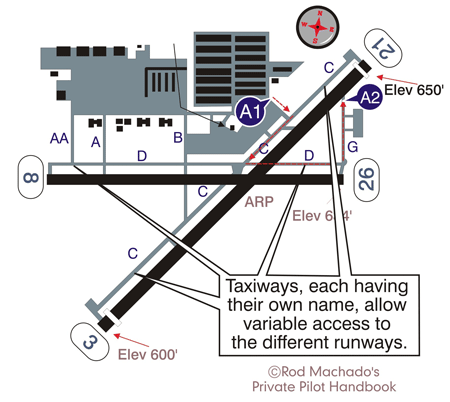
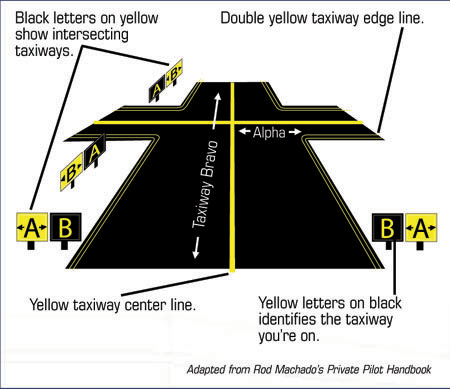
Taxiing is ground movement using taxiways marked with yellow center lines.
Ideal taxi speed: ~1000 RPM
Speed comparable to a light sprint
Airspeed indicator becomes active around 35–40 knots (too fast for taxi)
Run-Up (Before Take-off Checklist)
The run-up ensures engine reliability before take-off.
Engine at ~1700–1800 RPM
Test both magnetos
Burn excess fuel if needed
Bring engine to operating temperature
Before entering runway:
Transponder: ALT
Flaps: 10 degrees
Trim: Take-off position
Airport Circuit
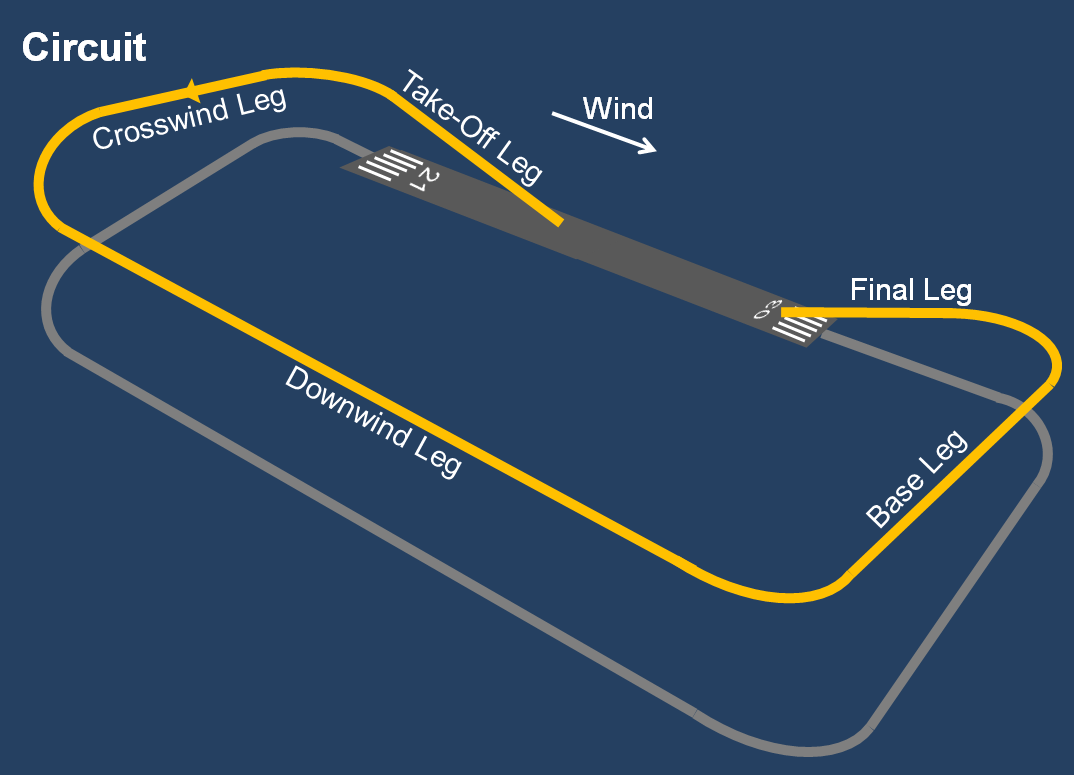
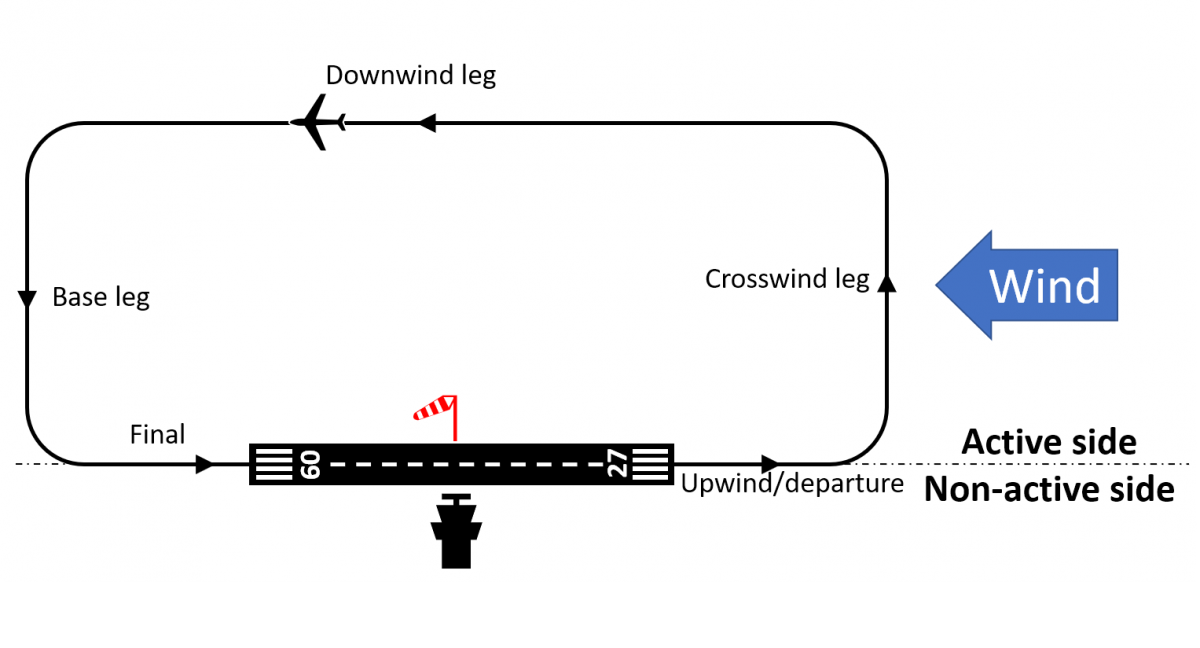
Before flying circuits (Upwind, Crosswind, Base leg), it helps to understand the pattern:
End of the page 🎉
You have reached the end of the page. You can navigate through other blog posts as well, share this post on X, LinkedIn and Reddit or return to the blog posts collection page. Thank you for visiting this post.
This page can contain a collection of personal notes, steps to remember, finished and unfinished content. Please excuse brevity.
Do not use specific information given like fuel flow, landing/take-off distances for your flights. Always refer to the POH of your exact plane for flight preparation. My information is just for references that I used.
Introduction
Lesson number
Lesson name
Lesson date(s)
1.2
Effect of controls
08-08-2025
In this lesson, we went more into the technical limitations of the Cessna 172 aircraft. Also we did some slow-flight exercises to be somewhat ahead of schedule as we had some spare time.
Limitations
The most important limitations of the Cessna 172 aircraft are:
Maximum take-off weight (2300 LBs / 1.043 KG)
Maximum Indicated Airspeed (IAS) of 140 kts (260 km/u) while flapless
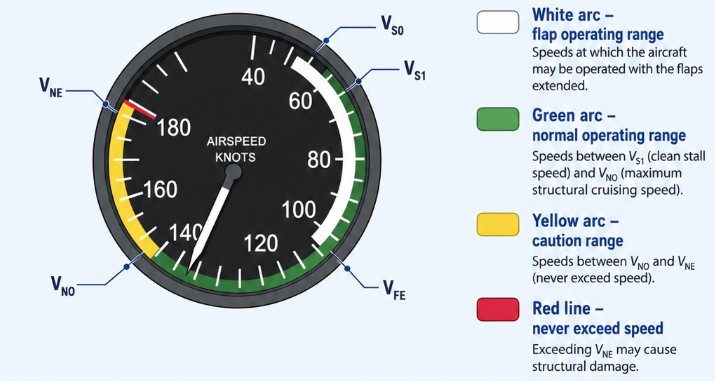
Maximum Indicated Airspeed (IAS) of 85 kts (157 km/u) while full flaps (check the white arc for allowed flap speed on the airspeed indicator)
Minimum landing distance
Minimum take-off distance
To make sure we don’t exceed these limitations, we need to take several precautions. For weight, we perform a mass and balance calculation. For airspeed, we ensure during flight that we remain well below 140 knots.
For landing and take-off distance, this is ensured during flight preparation, where penalties are added for unfavorable runway or weather conditions.
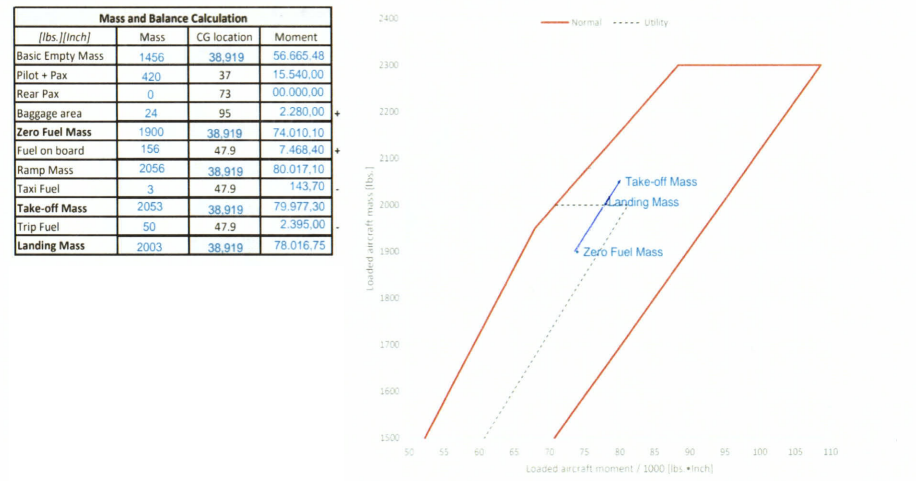
Mass and Balance sheet
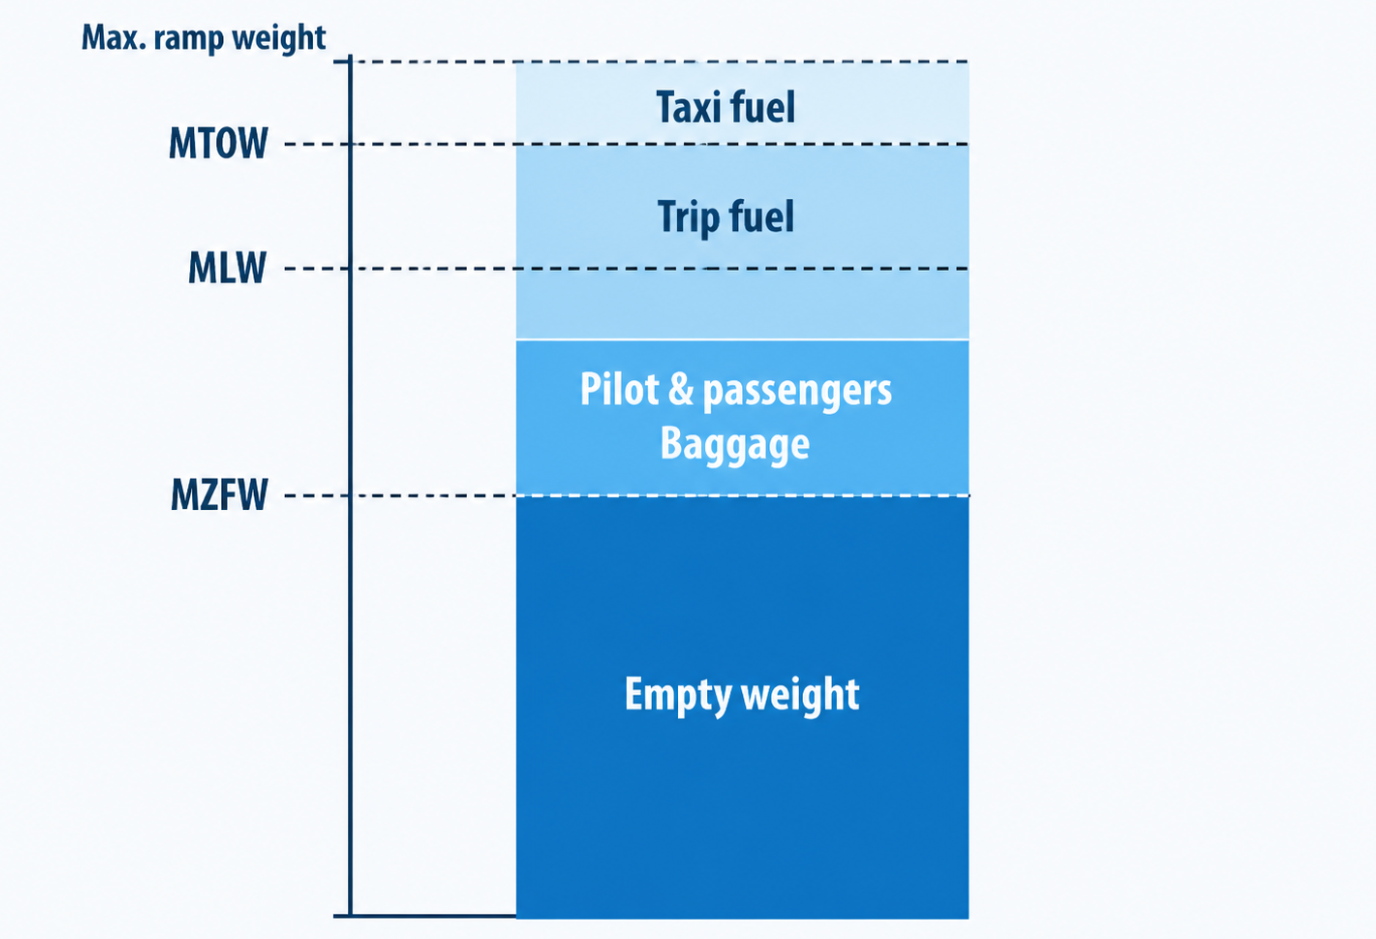
Before we begin our flight, we must calculate both weight and balance. They play a critical role in aircraft performance. The total mass must always remain below the maximum take-off weight, which is specific to each aircraft type.
The root of why we calculate this before the flight is to ensure we stay within the aircrafts performance envelope and not to create imbalance. Doing this incorrectly can lead to decreased flight perforrmance and even worse results.
Here I created a mass and balance sheet for a Cessna 172, fully within the technical limits of the aircraft.
Normal category flights must stay within the red lines
Utility/aerobatic flights must stay within the grey dotted lines
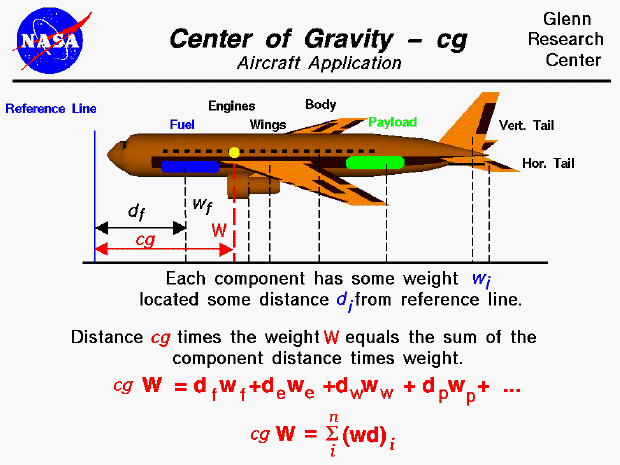
The CG (Center of Gravity) is the balance point of the aircraft. You can compare it to balancing a pencil on your finger: the point where it stays perfectly balanced is the center of gravity.
In an aircraft, CG is calculated along the fuselage. For the Cessna 172 this is measured in inches. For example: a baggage CG of 95 means the weight is centered 95 inches from the front of the fuselage.
Emergency equipment
In a Cessna 172, the following 7 emergency items must always be on board:
First aid kit
Fire extinguisher
Emergency Locator Transmitter (ELT)
Radios / avionics
Transponder
Emergency checklist (QRH)
Mobile phone and emergency contacts:
FIO
ACC Supervisor
During the before‑take‑off checklist, I learned these items by heart and was told to always be aware of them.
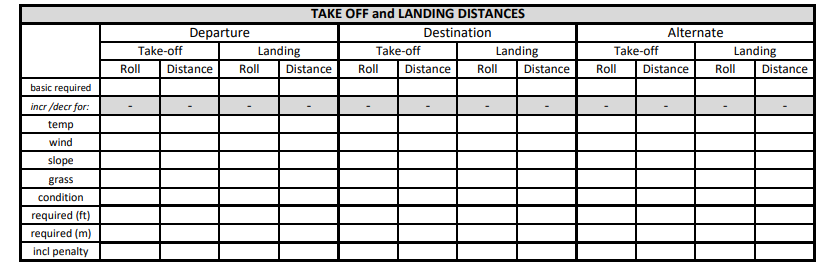
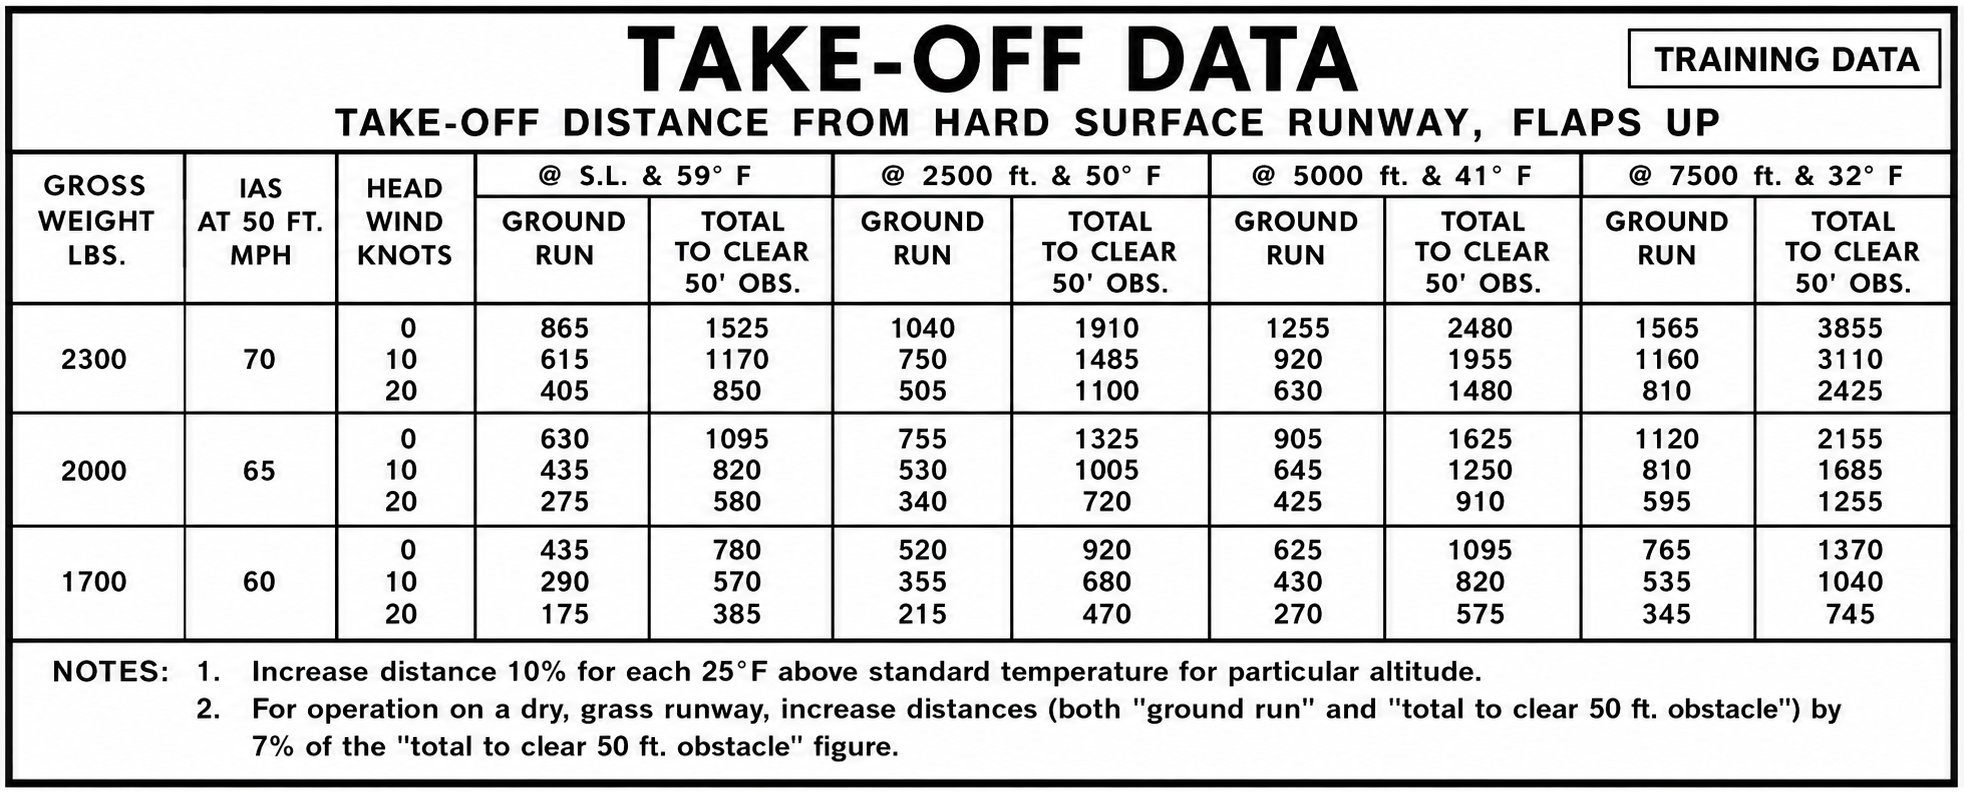
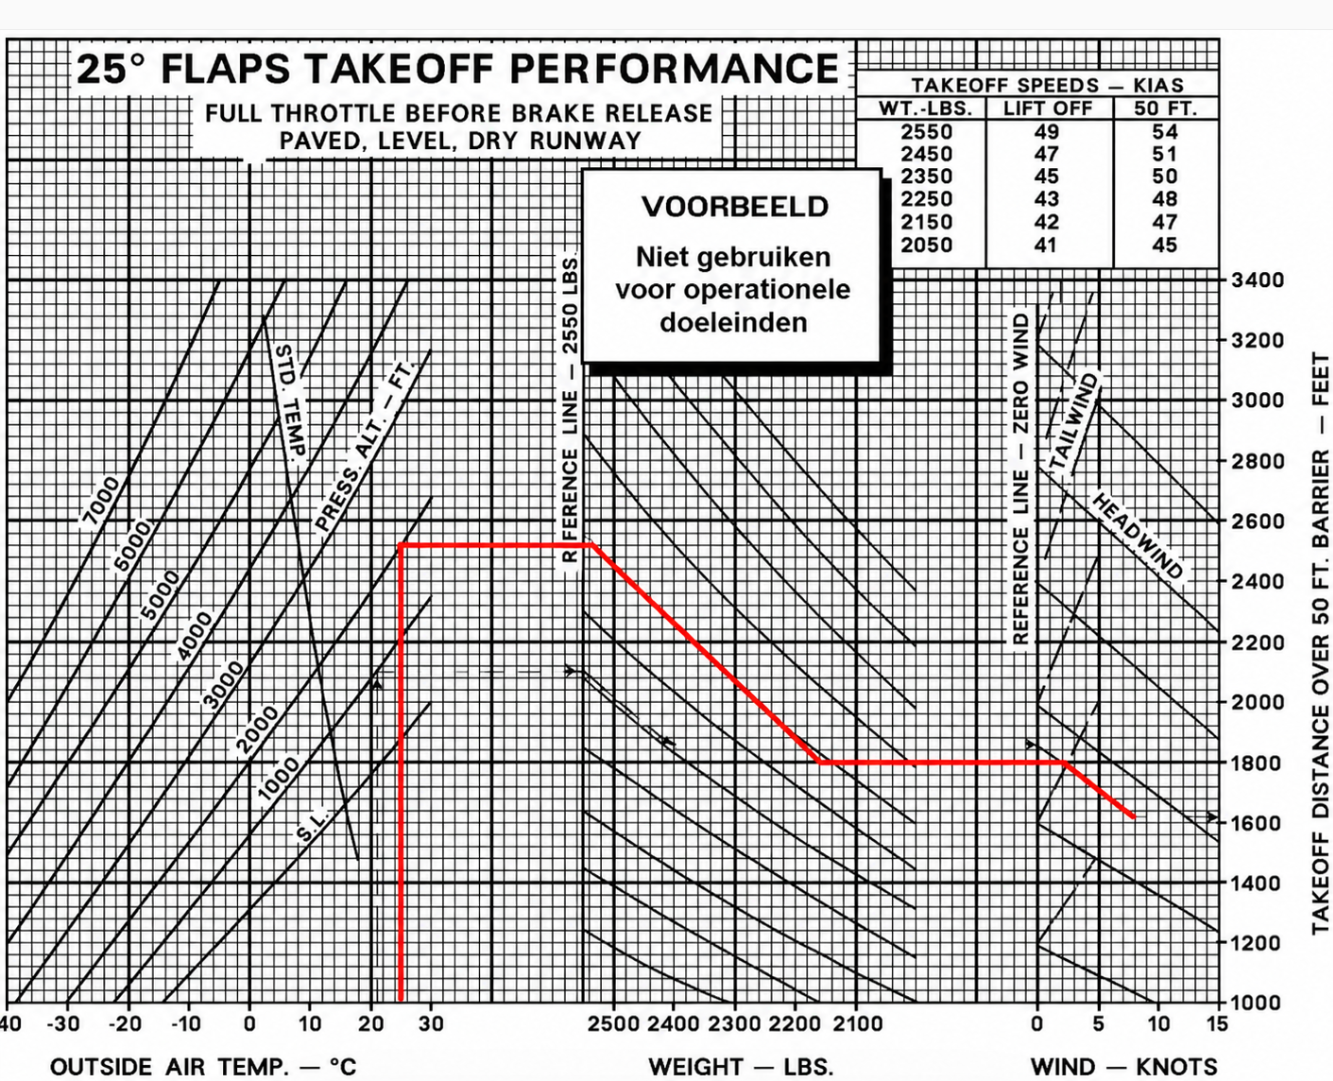
Calculating Take-off and Landing Distances
Before confirming that we can safely take off or land on a specific runway, we calculate the required distances. Runway lengths for all Dutch aerodromes can be found via the AIP:
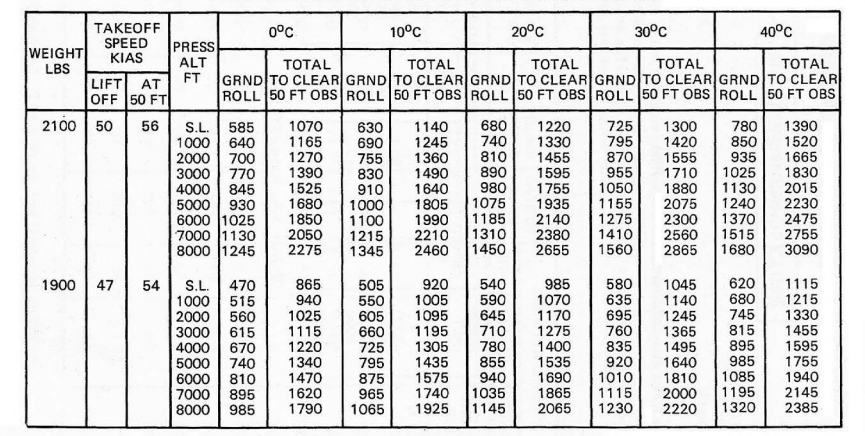
Cessna publishes the basic required take-off and landing distances in the POH (Pilot Operating Handbook):
These values assume perfect conditions: zero wind, ideal temperature, dry asphalt runway. Because this rarely happens, we apply penalties and always calculate using worst‑case scenarios.
Take-off distance penalties
Penalty description
Increase basic required take‑off distance
Every 100 ft aerodrome elevation above AMSL
+1%
Every °C above OAT
+1%
Headwind (per knot)
−1%
Tailwind (per knot)
+20%
Runway slope (uphill, per 1%)
≥ 5%
Grass runway – dry
+25%
Grass runway – wet
+30%
Soft ground
≥ 25%
Snow
≥ 25%
Gravel
+7%
Flapless take-off
+60%
This prevents discovering at 45 knots that the runway is too short. Worst‑case thinking is essential.
Landing distance penalties
Penalty description
Increase basic required landing distance
Every 100 ft aerodrome elevation above AMSL
+0.5%
Every °C above OAT
+0.5%
Headwind (per knot)
−1%
Tailwind (per knot)
+20%
Runway slope (downhill, per 1%)
≥ 5%
Grass runway – dry
+30%
Grass runway – wet
+38%
Soft ground
≥ 25%
Snow
≥ 25%
Gravel
+7%
Flapless landing
+60%
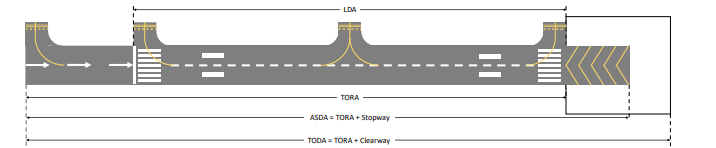
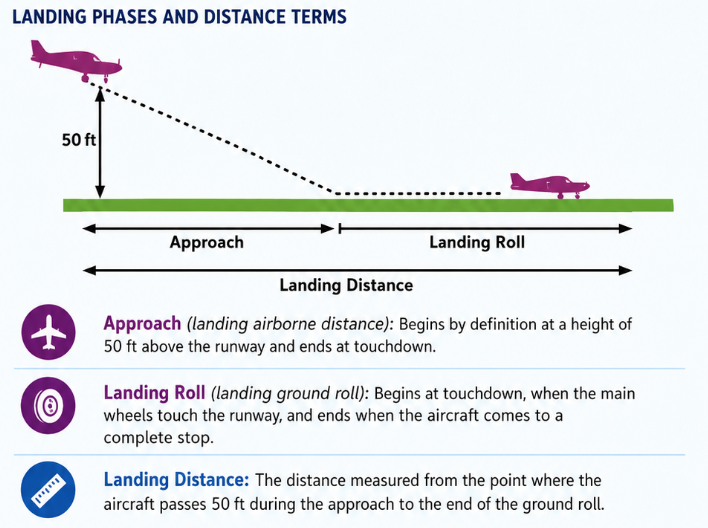
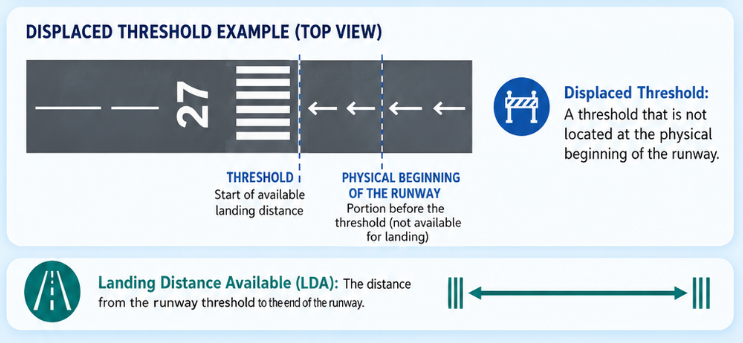
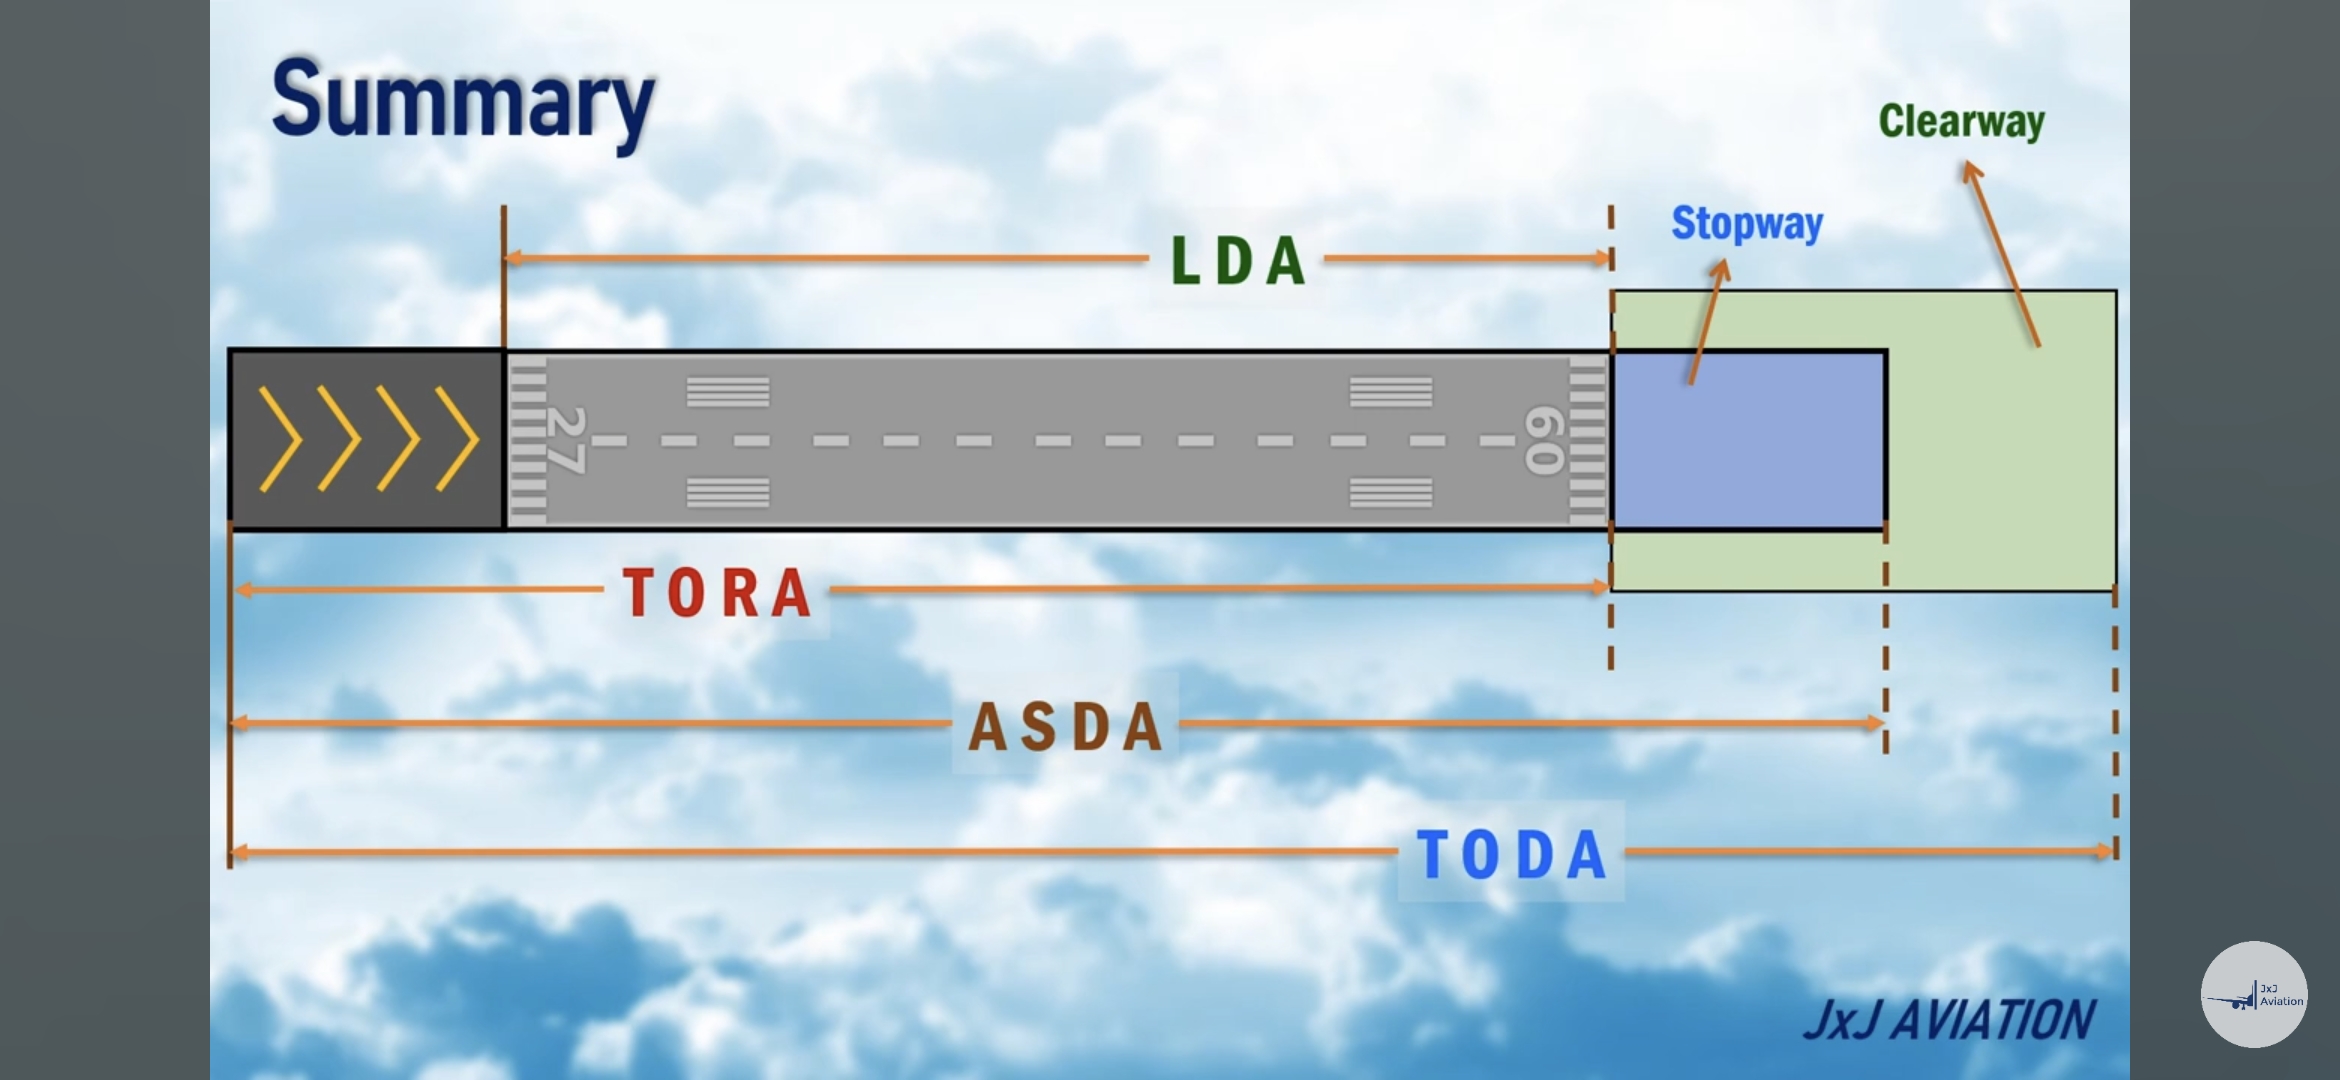
Always verify the Landing Distance Available (LDA) — the space between the white runway stripes. Do not confuse this with TORA or TODA, which apply to take‑off.
Runway surface conditions
There are four runway surface conditions:
Dry – Best braking and performance
Damp – Slightly moist, not shiny
Wet – Shiny runway, water < 3 mm
Contaminated – Water > 3 mm or snow
Always assess the worst section of the runway. If 1100 m is dry but 400 m is wet, the runway is considered wet.
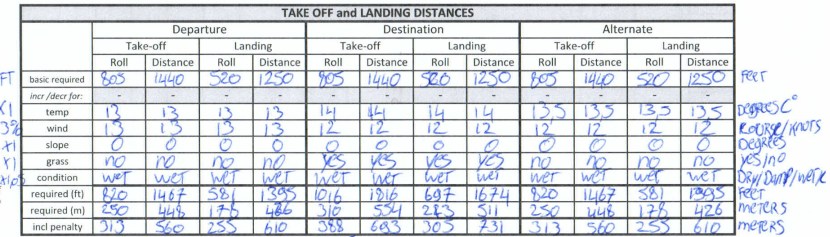
Example of my flight preparation
After lesson 2, I prepared a full fictional flight to practice all calculations:
I used worst‑case values and rounded everything up when converting from feet to meters. (Please ignore the handwriting 😄)
Slow Flight
We finished the lesson with slow‑flight exercises. Slow flight is the art of controlling the aircraft at low airspeeds. Less airflow means less control authority.
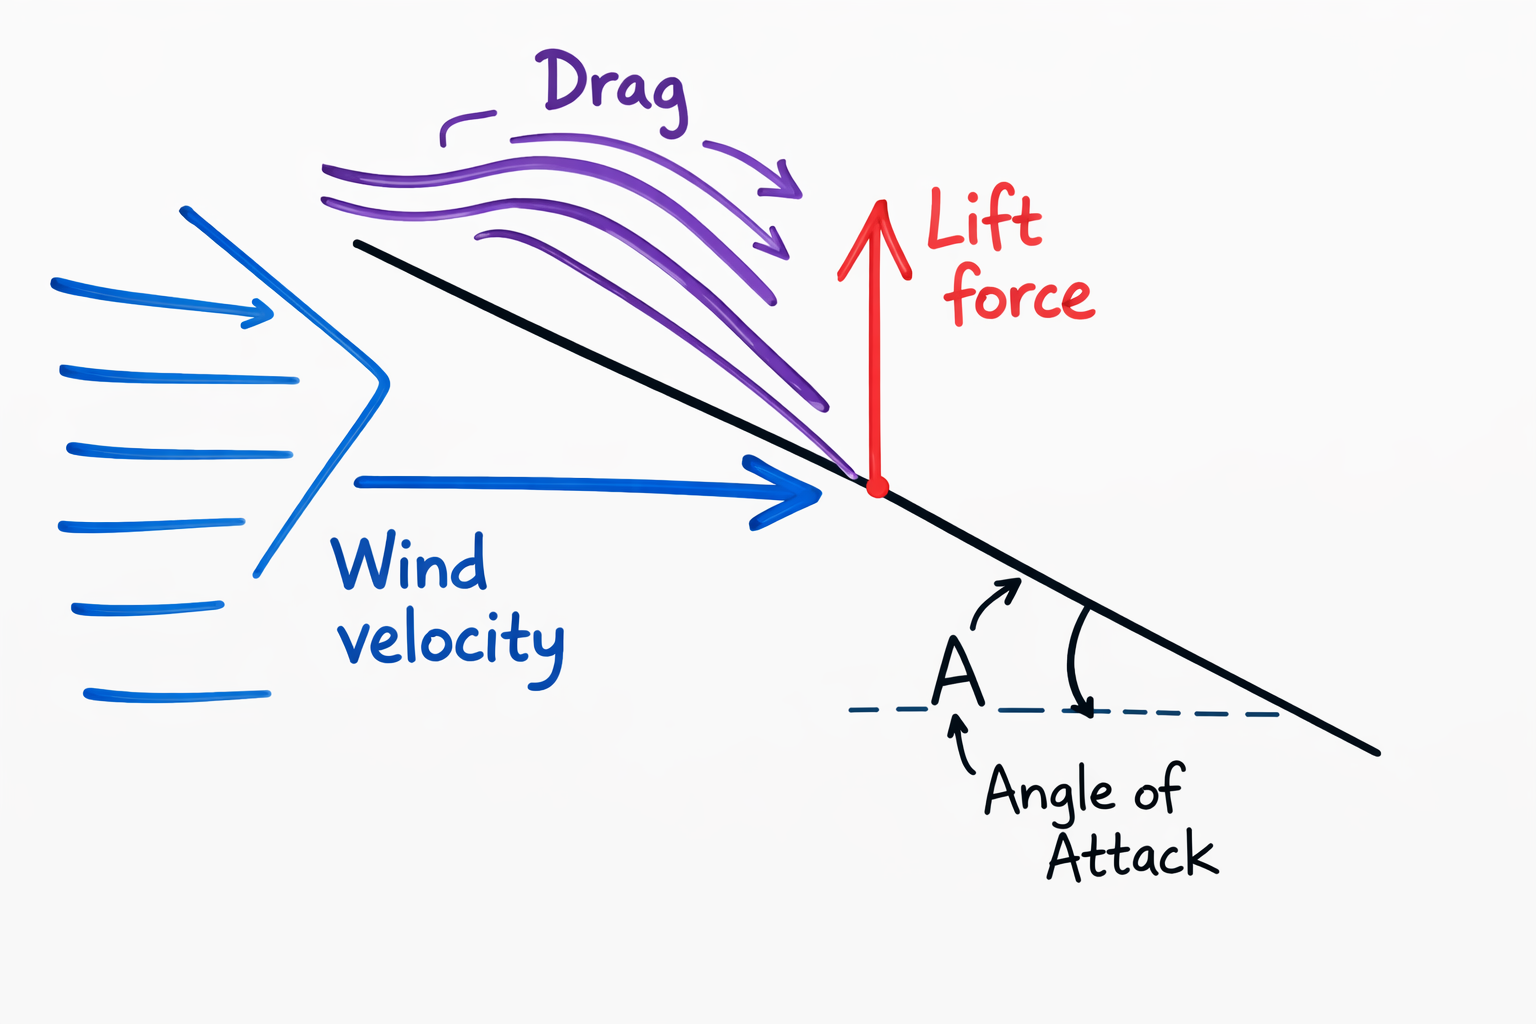
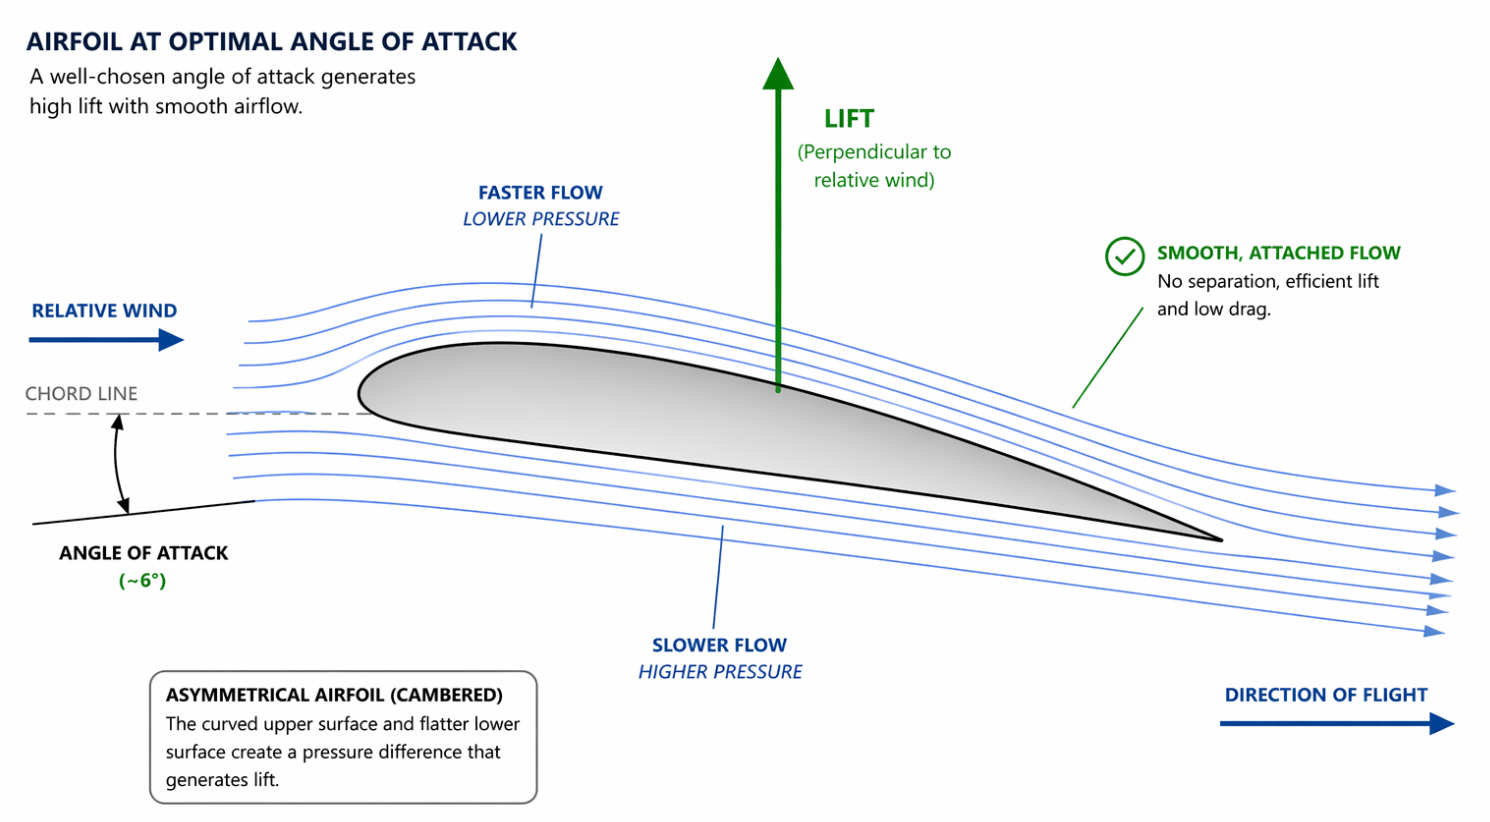
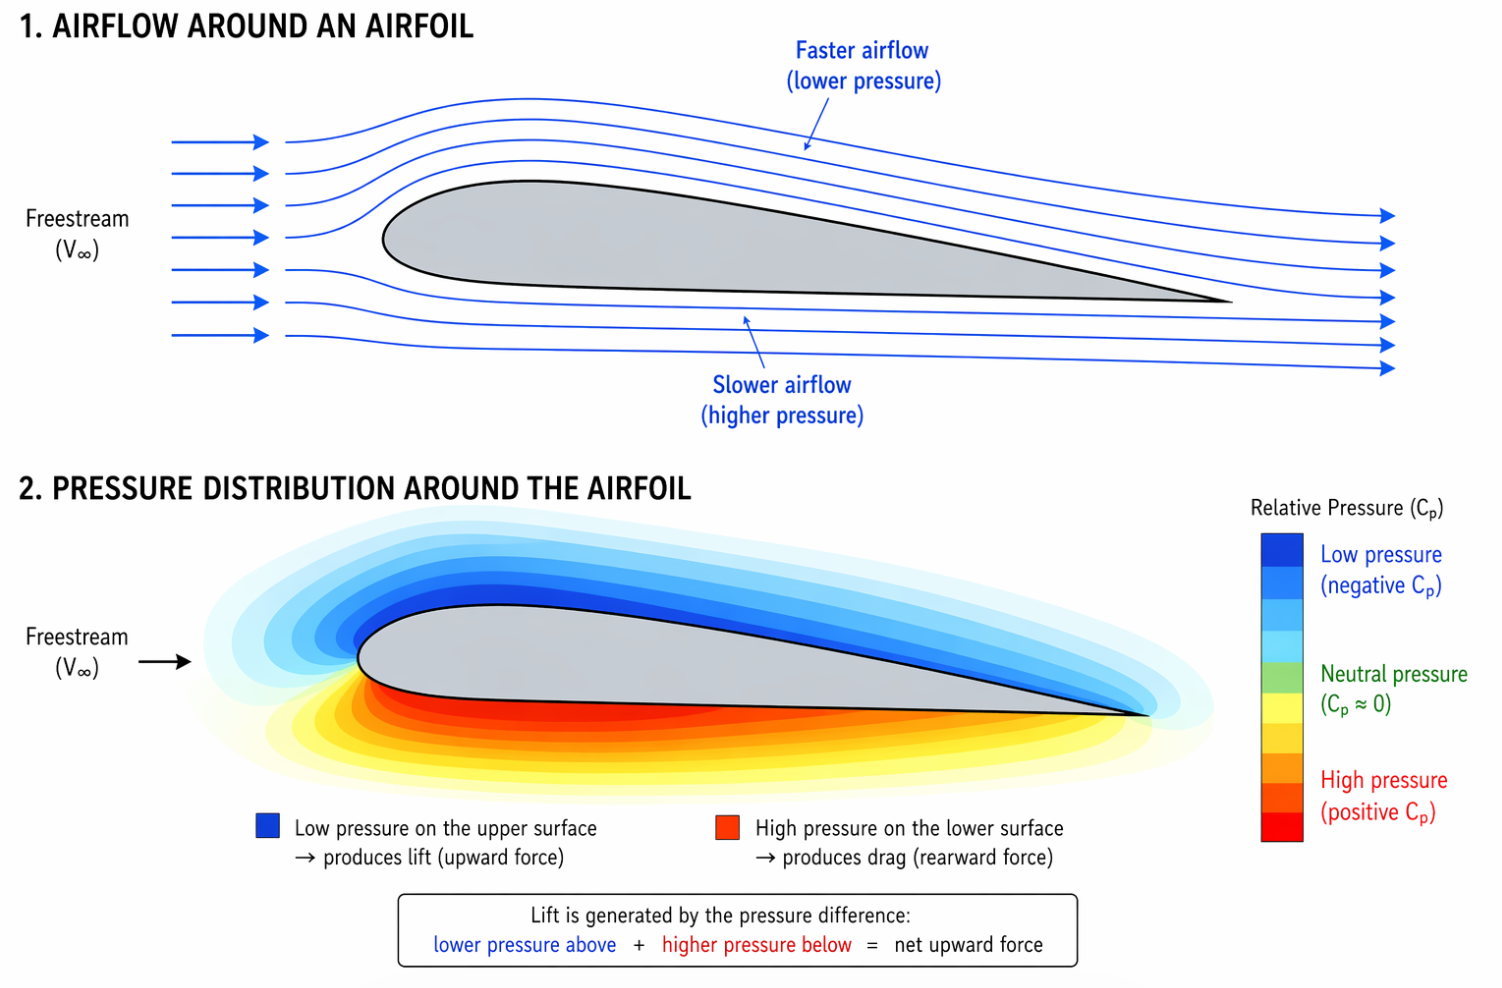
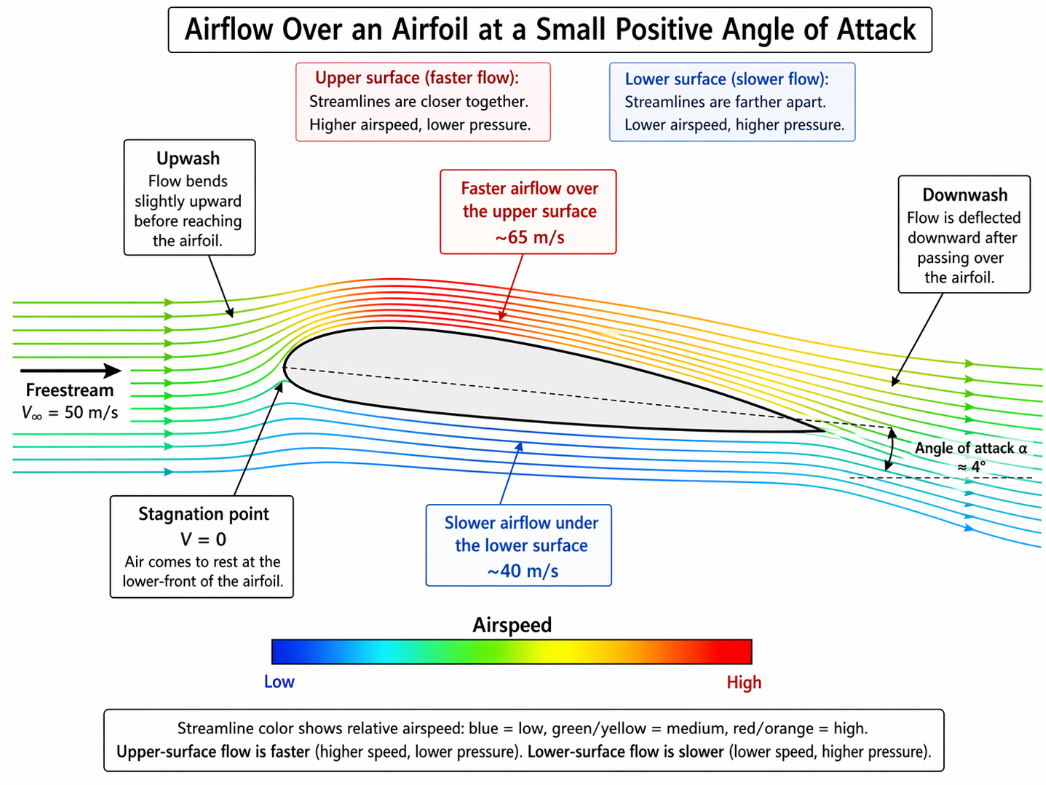
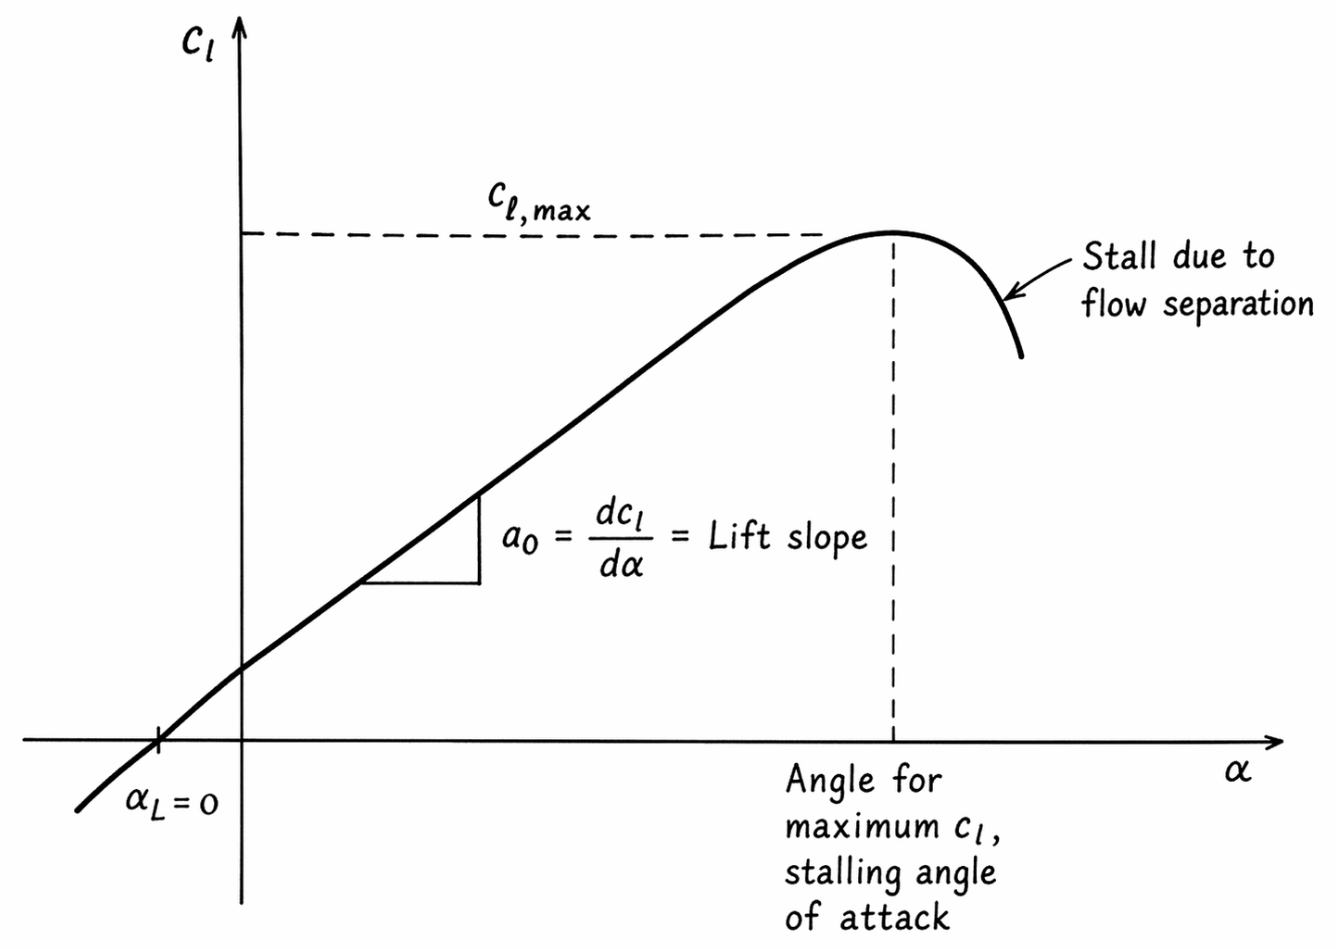
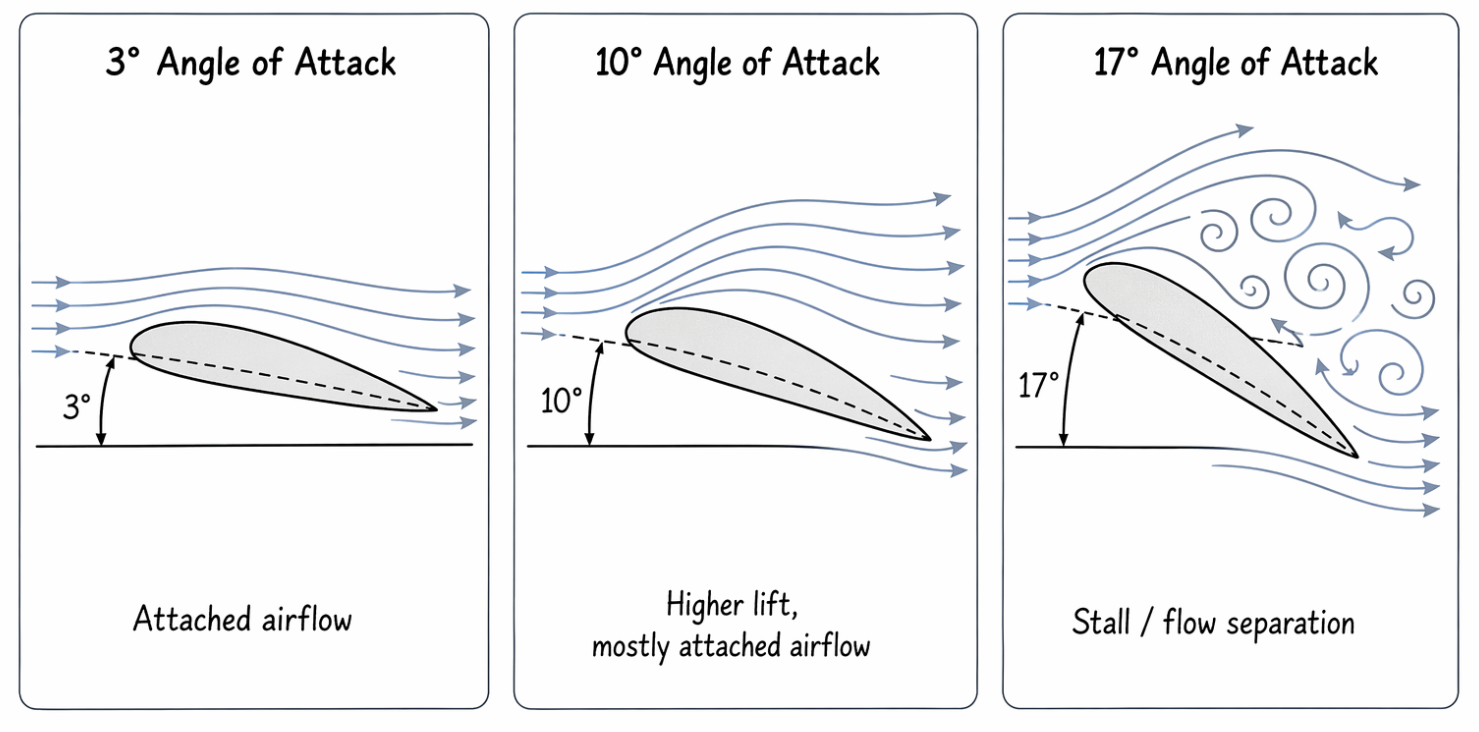
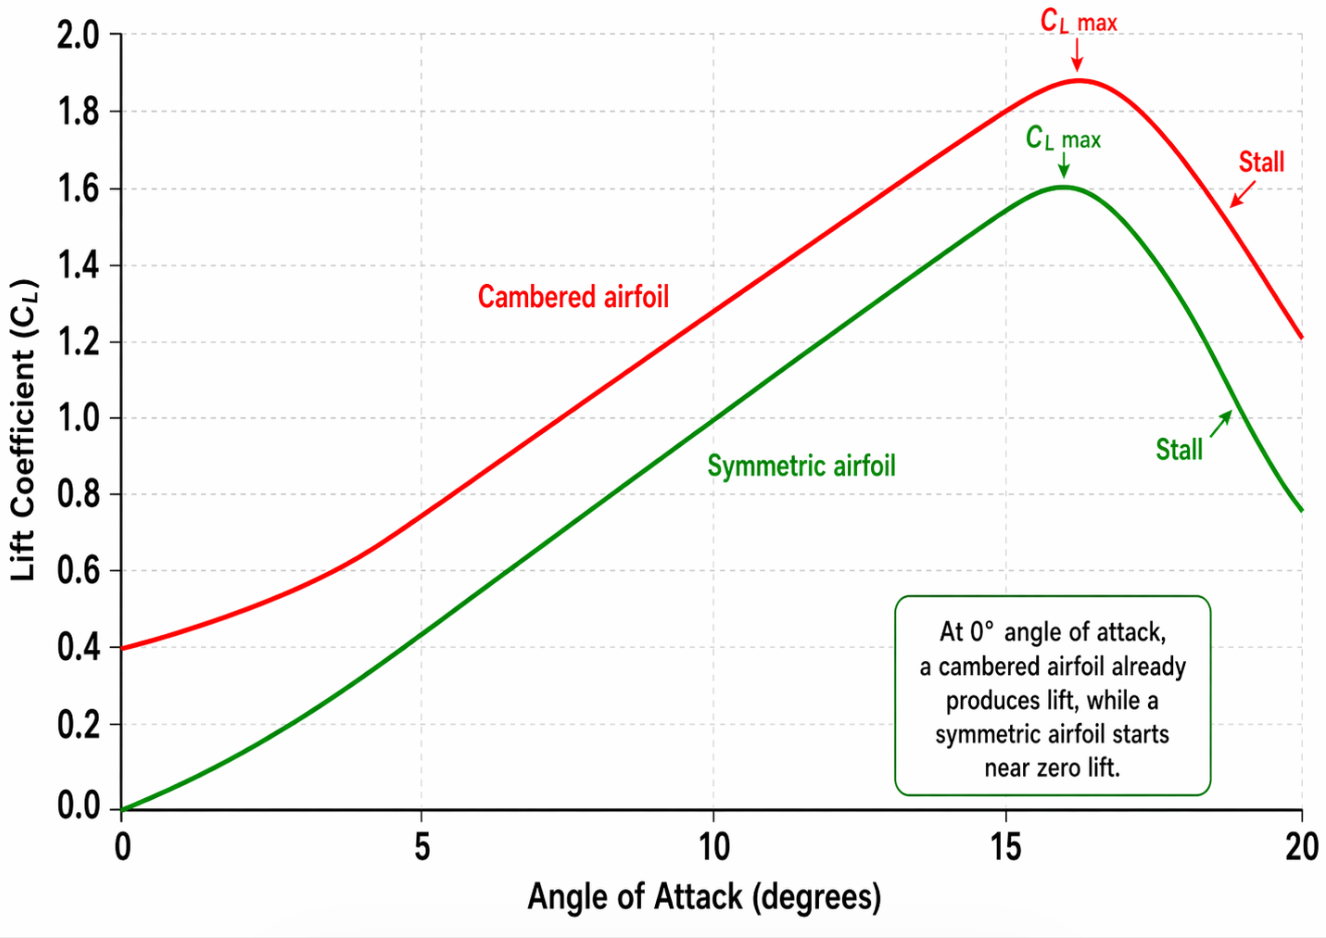
As airspeed decreases, lift decreases. To compensate, we must increase the angle of attack by raising the nose.
Aircraft control in slow flight (~60 knots):
Direction / heading": Rudder
Airspeed: Elevator
Altitude: Throttle
We also practiced with flaps extended, which increases lift and makes slow flight easier.
Finishing up
After completing the exercises, we returned to the airstrip for a smooth landing and taxied back to the flight school.
End of the page 🎉
You have reached the end of the page. You can navigate through other blog posts as well, share this post on X, LinkedIn and Reddit or return to the blog posts collection page. Thank you for visiting this post.
This page can contain a collection of personal notes, steps to remember, finished and unfinished content. Please excuse brevity.
Do not use specific information given like fuel flow, landing/take-off distances for your flights. Always refer to the POH of your exact plane for flight preparation. My information is just for references that I used.
Introduction
Lesson number
Lesson name
Lesson date(s)
1.3
Airwork 1
22-08-2025
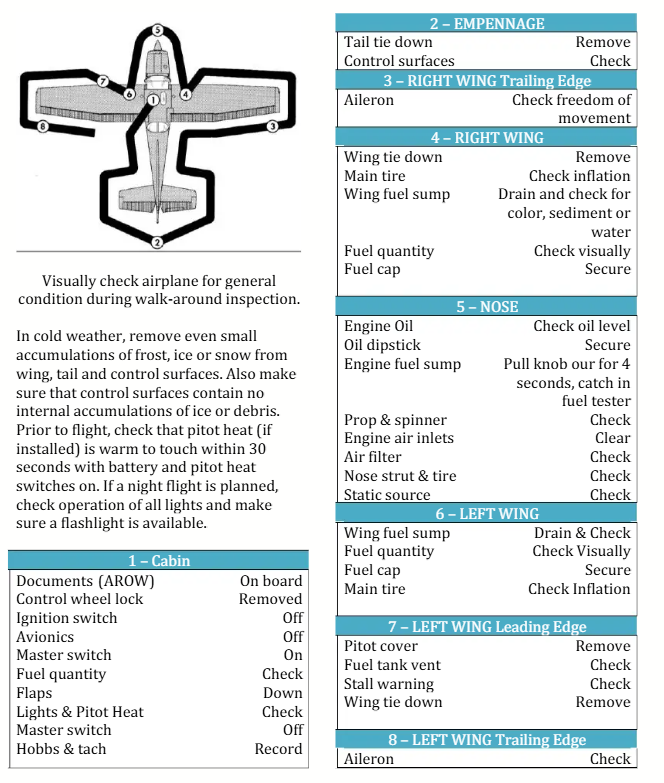
In this flight, I learned how to perform the preflight inspection myself by doing the walk‑around using a structured checklist. In this first checklist item, we look for reasons not to fly. In IT terms, this can be compared to a physical risk assessment.
I had to repeat this with more steps and will do this every lesson to fully master the procedure.
I performed the check as follows:
Cabin
Remove the control wheel lock (steering lock)
Check fuel quantity from the gauges (not fully trustworthy)
Test flap movement from 0° to full 40°
Check lights and pitot heat (especially relevant at 10°C and below)
Tail
Check elevator freedom and correct response to yoke movement
Remove tail tie‑downs (extra weight)
Right wing
Check flap condition
Check aileron movement for freedom and correctness
Right wheel & fuel
Check tire, brakes, and strut
Measure fuel manually using a dipstick
Check for water contamination in the fuel
Nose
Check oil level (minimum 5 quarts, 6 for longer flights)
Check propeller condition and freedom
Check air inlets for contamination
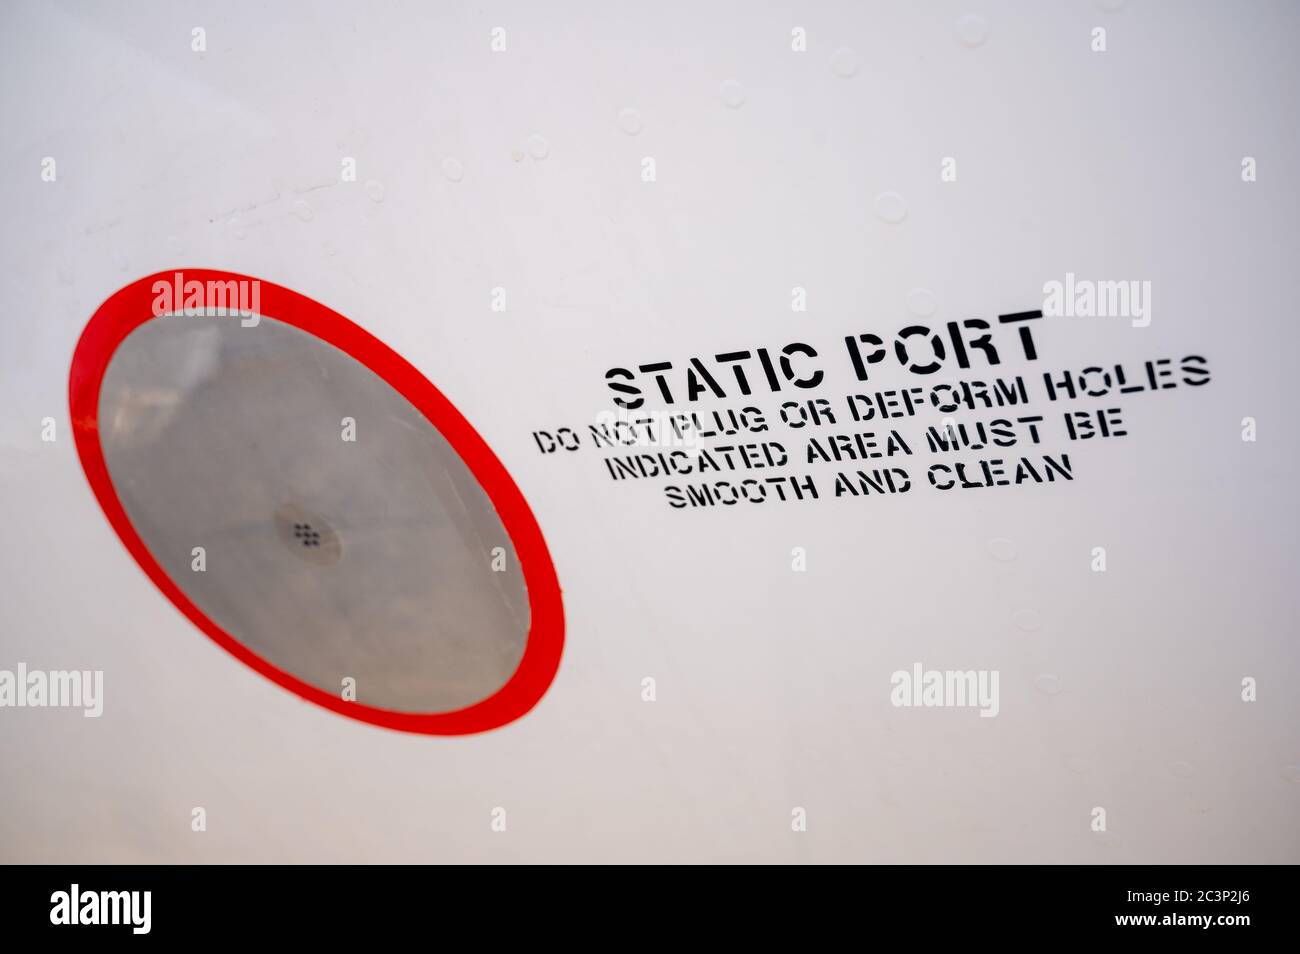
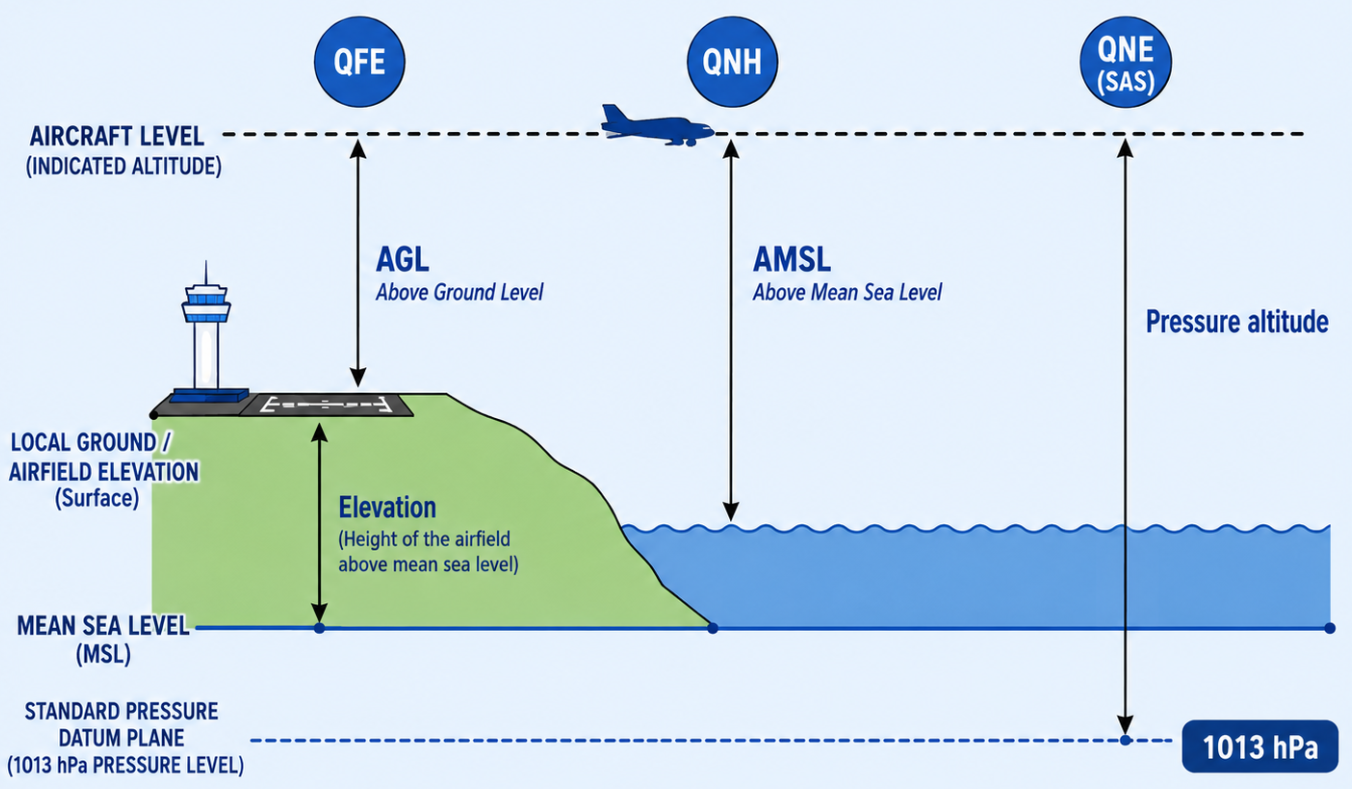
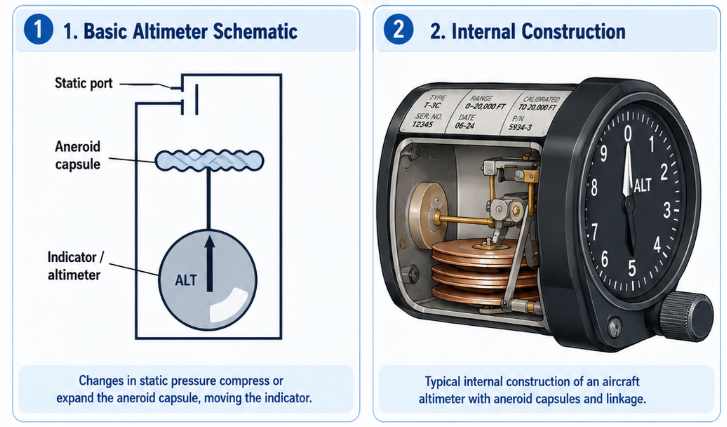
Inspect static pressure port (used to measure altitude in hPa)
Left wheel & wing
Same checks as right side
Drain fuel sump to check for dirt or water
Inspect front tire and brake
Pitot & stall warning
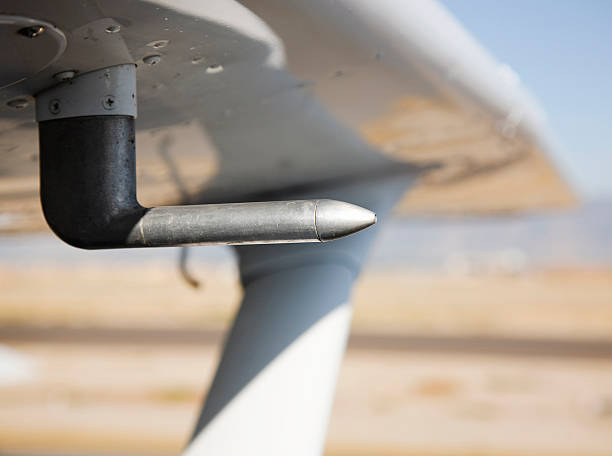
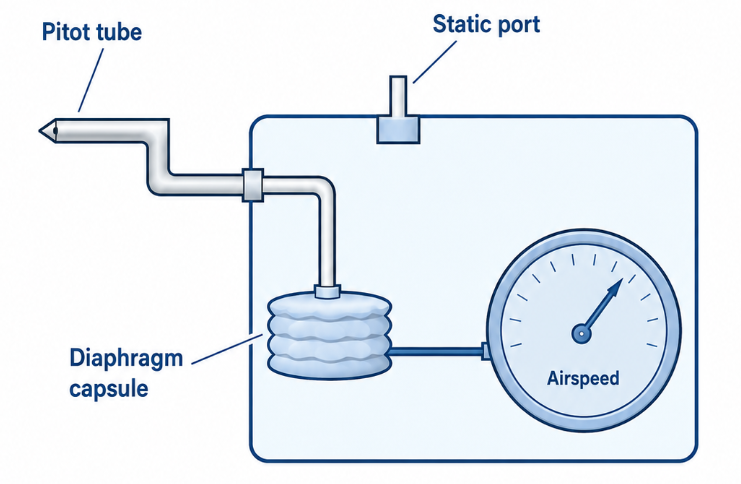
Check pitot probe (indicated airspeed)
Check analog stall warning (testable using suction)
Left aileron & flap
Verify free movement
Confirm correlation with yoke movement
Aileron movement reminder
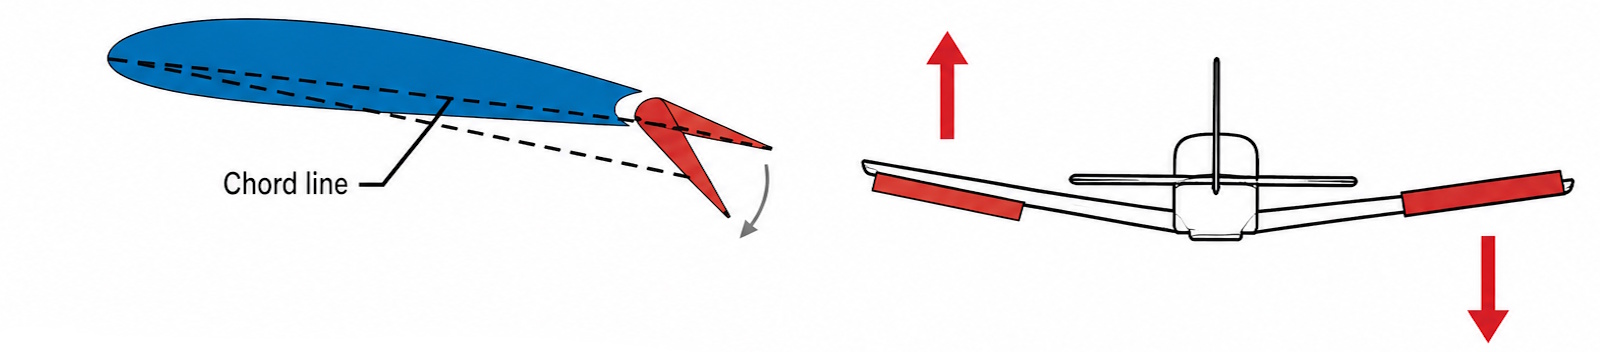
Steering left → left aileron up, right down
Steering right → right aileron up, left down
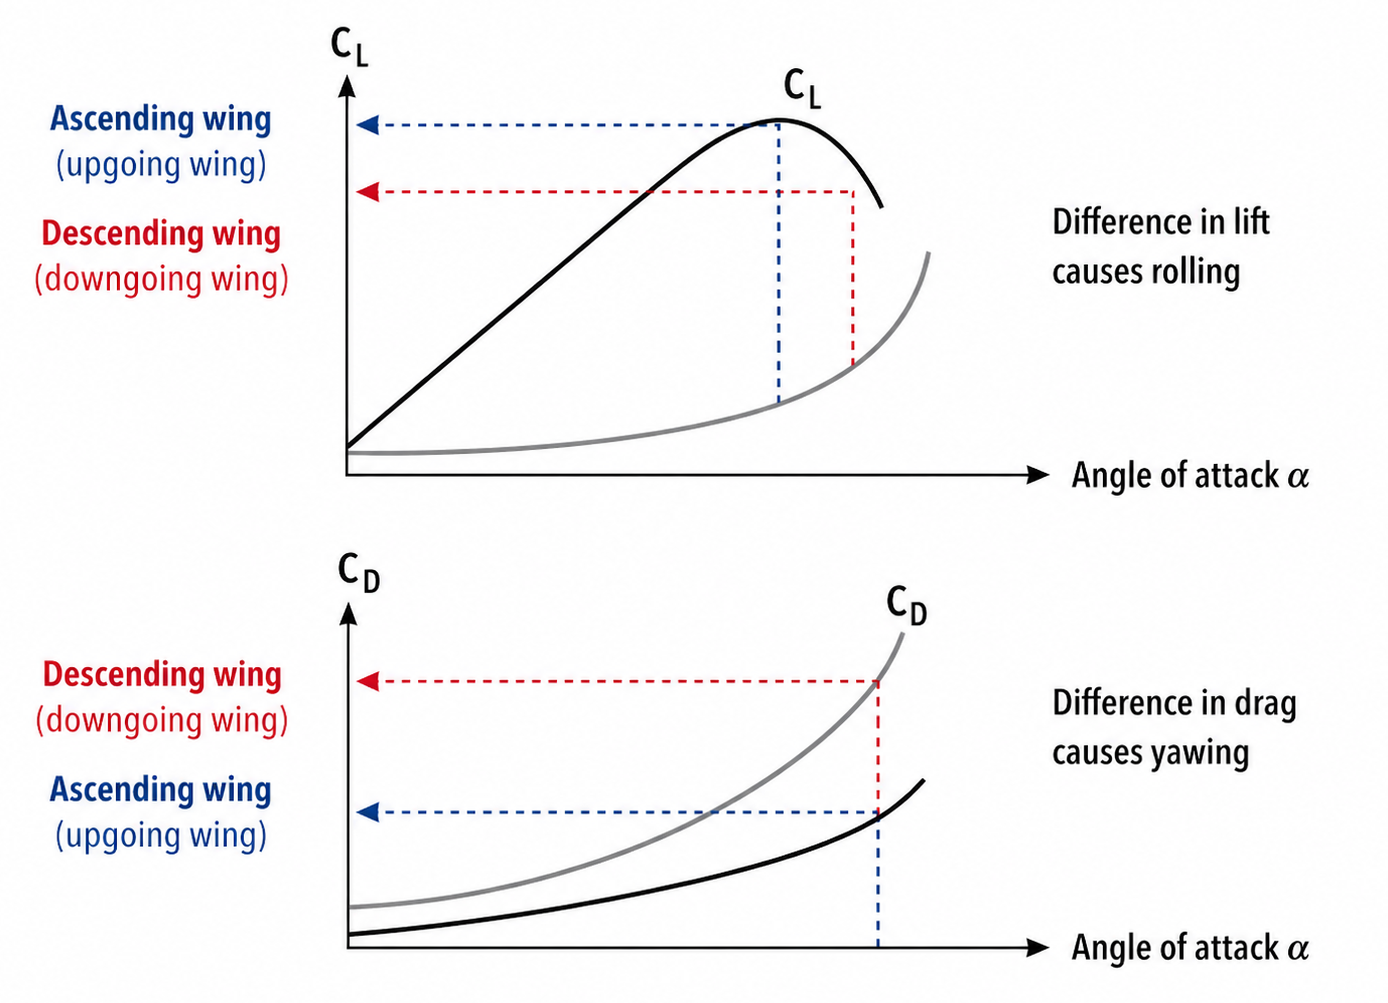
Wing going up produces more lift
Wing going down produces more drag
Trip fuel and fuel calculation
When fueling the aircraft, we must ensure enough fuel for every possible phase of the flight. Fuel is not only for A → B — weather or runway issues might force a diversion.
Fuel planning includes:
Taxi fuel
Trip fuel
Contingency fuel
Alternate fuel
Final reserve fuel
Possible extra fuel
The final reserve fuel (30–45 minutes) must never be used. Using it means the flight planning was insufficient.
Always filling tanks to the maximum may feel safe, but more fuel means:
More weight
Higher fuel consumption
Reduced performance
Less room for passengers or baggage
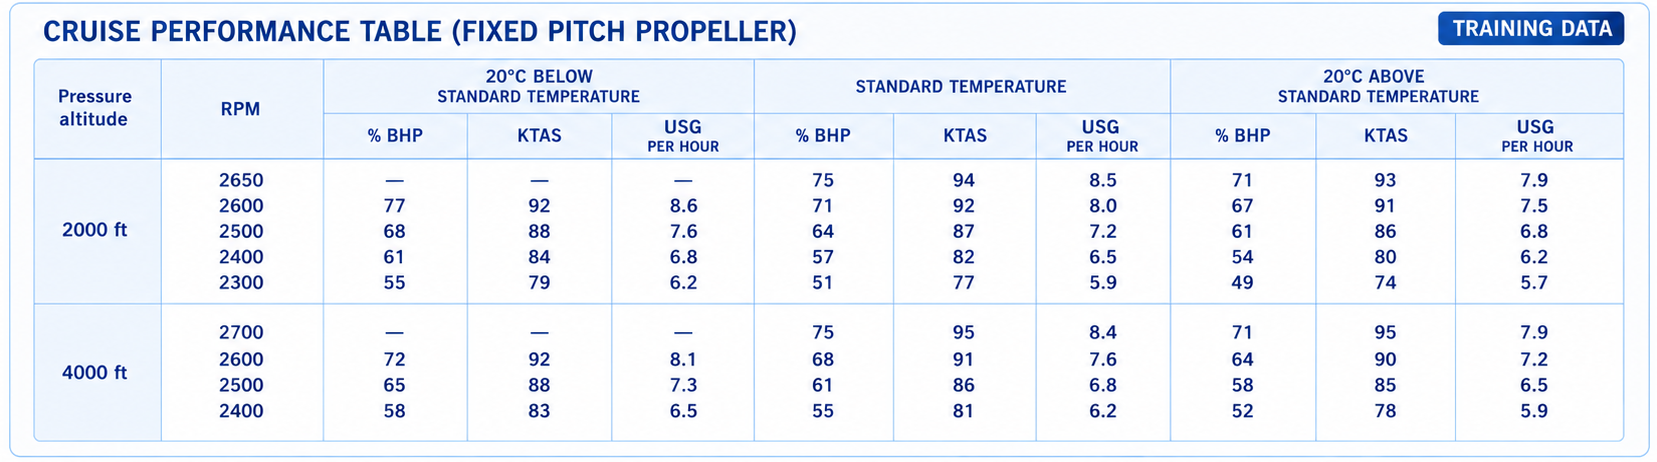
Fuel consumption is calculated using data from the Pilot Operating Handbook (POH).
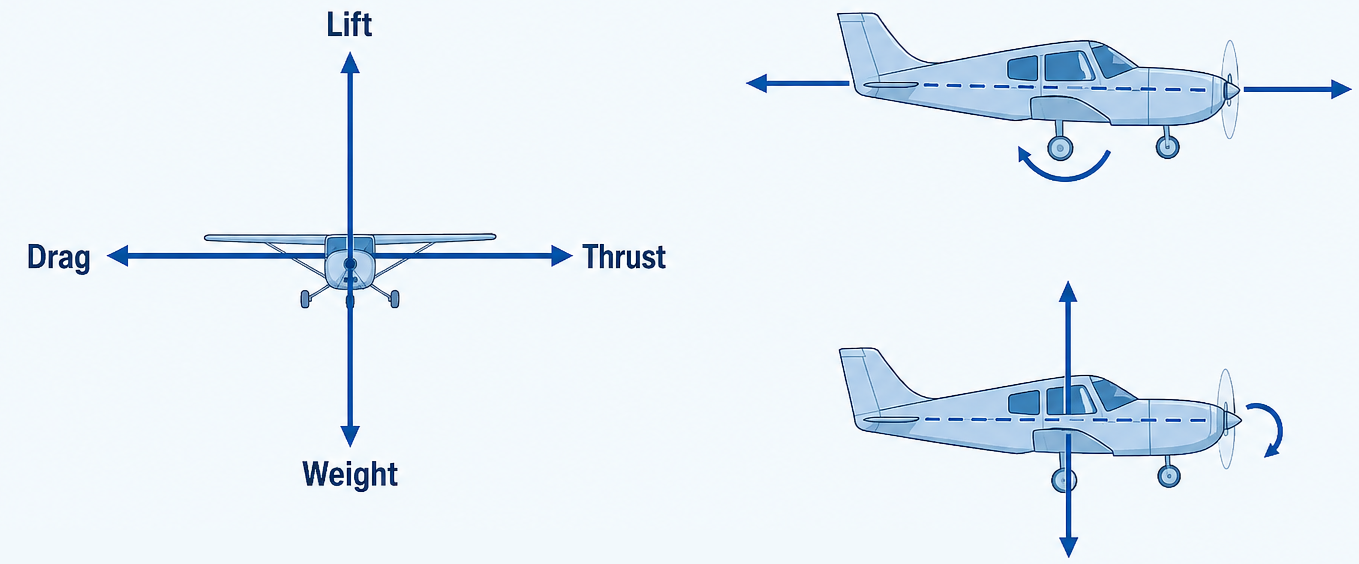
Aircraft forces
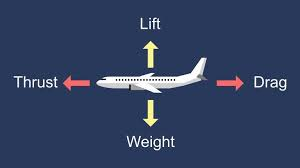
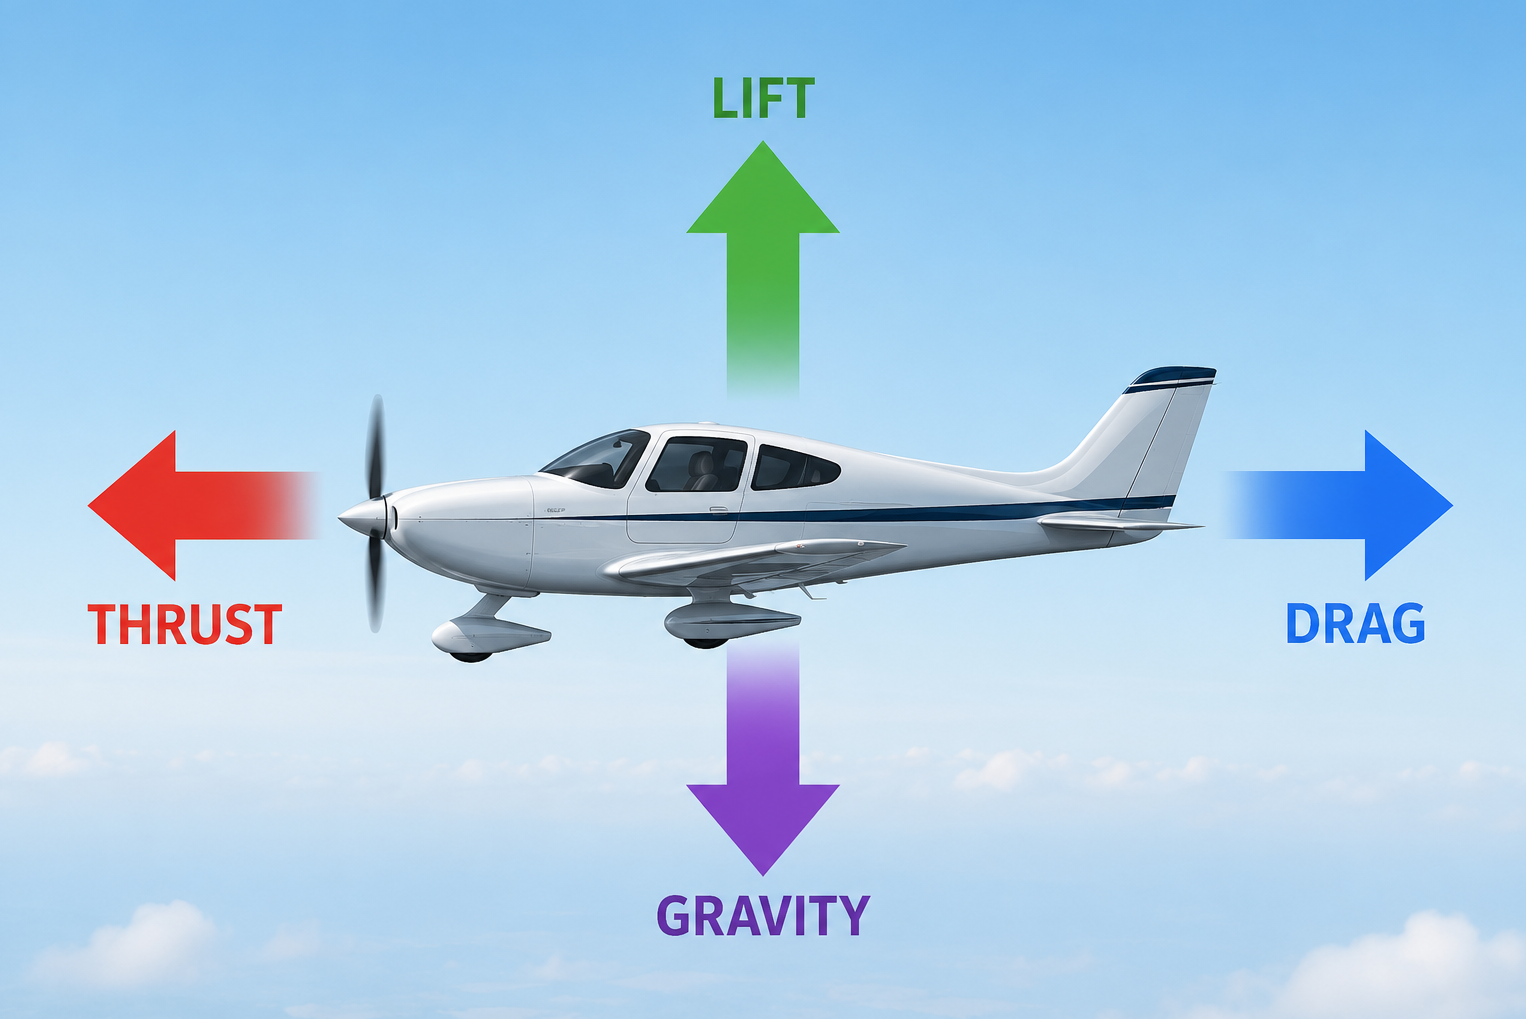
An aircraft is influenced by four main forces:
Lift – Force generated by the wings to keep the aircraft airborne
Drag – Opposing force slowing the aircraft
Weight / Gravity – Pulls the aircraft toward the ground
Thrust – Generated by the engine and propeller
In straight and level flight, all four forces are in balance:
Lift balances weight
Thrust balances drag
Flying visually
In this lesson, I learned to fly more visually by focusing on nose attitude instead of instruments alone. This greatly helps maintaining a stable speed and altitude.
Maintaining direction
When flying straight or during turns:
Pick a reference point far away (city, lake, building)
Fly towards that point
Maintaining altitude
Focus on how the horizon sits over the nose:
This visual reference quickly shows climbs or descents
Reduces reliance on instruments
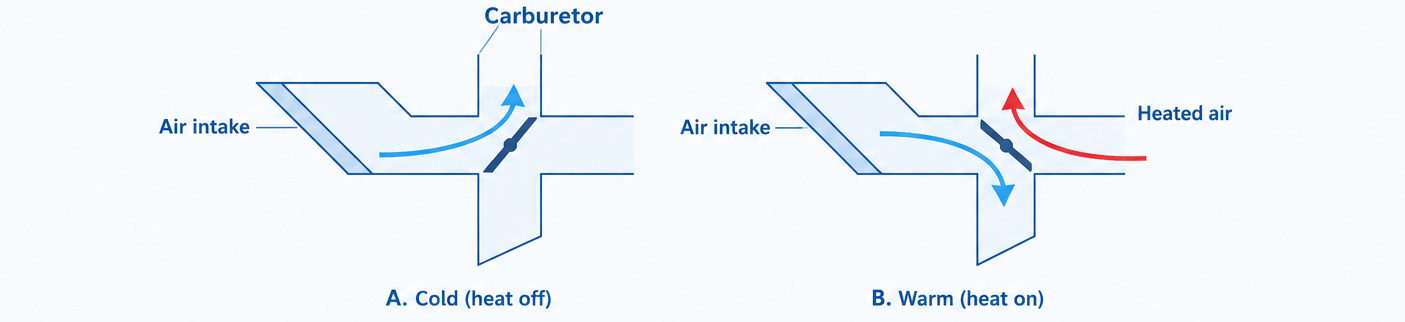
Carburetor heat
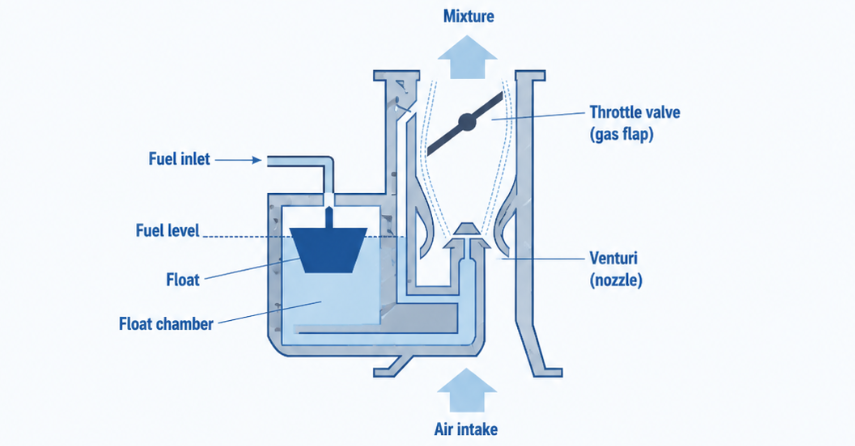
The carburetor mixes air and fuel. Because intake air cools inside the carburetor, engine RPM drops (±150 RPM).
General rule:
Use carb heat whenever possible
Disable only when maximum power is needed
Usage:
Take‑off & climb: Carb heat OFF (cold)
Cruise: Carb heat ON
Carburetor icing can occur even on warm days. Ice formation is detected by a rise in RPM when carb heat is applied.
Remember:
“No rise, no ice.”
Slow Flight
Due to spare time, we practiced slow flight again. By extending flaps, we increase lift and drag, allowing slower flight speeds — the reason flaps are used during landing.
Slow flight is also used in the circuit:
Allows tighter turns
Prevents overshooting
Gives more time for radio calls and checks
In slow flight, control dynamics change:
Altitude → Throttle / RPM
Speed → Nose attitude
Direction → Rudder
End of the page 🎉
You have reached the end of the page. You can navigate through other blog posts as well, share this post on X, LinkedIn and Reddit or return to the blog posts collection page. Thank you for visiting this post.
This page can contain a collection of personal notes, steps to remember, finished and unfinished content. Please excuse brevity.
Do not use specific information given like fuel flow, landing/take-off distances for your flights. Always refer to the POH of your exact plane for flight preparation. My information is just for references that I used.
Introduction
Lesson number
Lesson name
Lesson date(s)
1.4
Airwork 2
02-09-2025
We started by reviewing previous material and then went deeper into the theory of a nose attitude. During the flight we practiced slow flight, throttle effects on nose attitude, gliding, and trimming.
First, we discussed some theory.
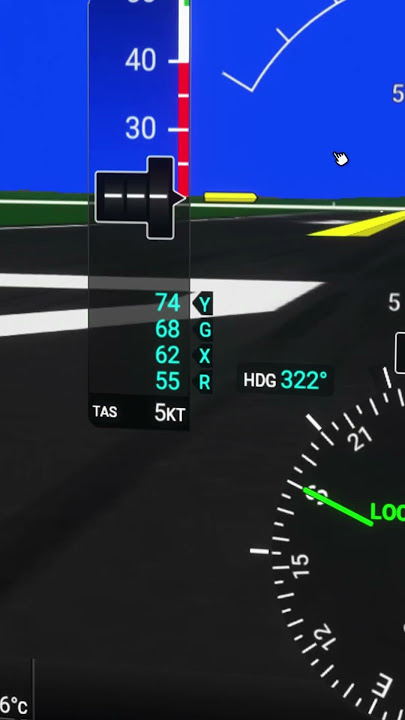
At take-off, we use different speeds for different phases:
Vr – Rotation speed
In a Cessna 172: ~55 knots (102 km/h)
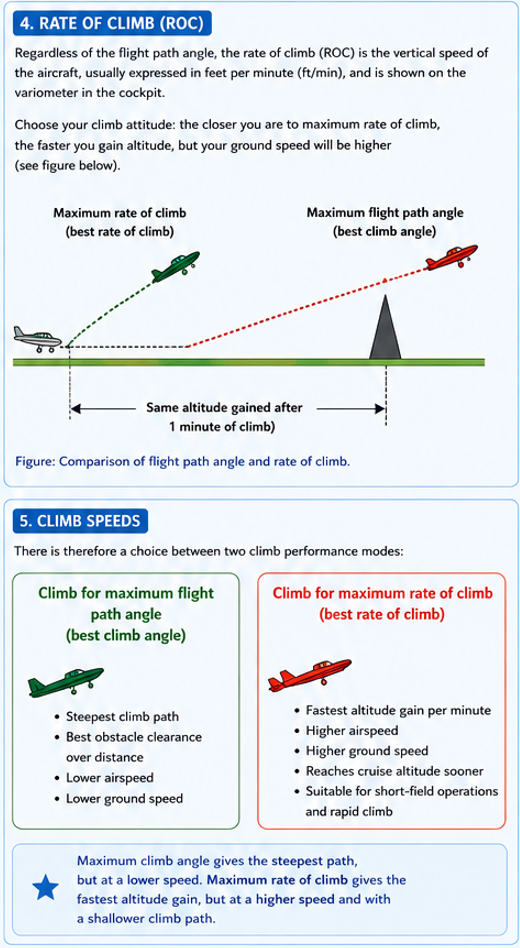
Vx – Best angle of climb (maximum altitude gain for distance)
In a Cessna 172: ~65 knots (120 km/h)
Vy – Best rate of climb (maximum altitude gain for time)
In a Cessna 172: ~75 knots (139 km/h)
Vg – Best glide speed (engine failure)
In a Cessna 172: ~65–68 knots (124 km/h)
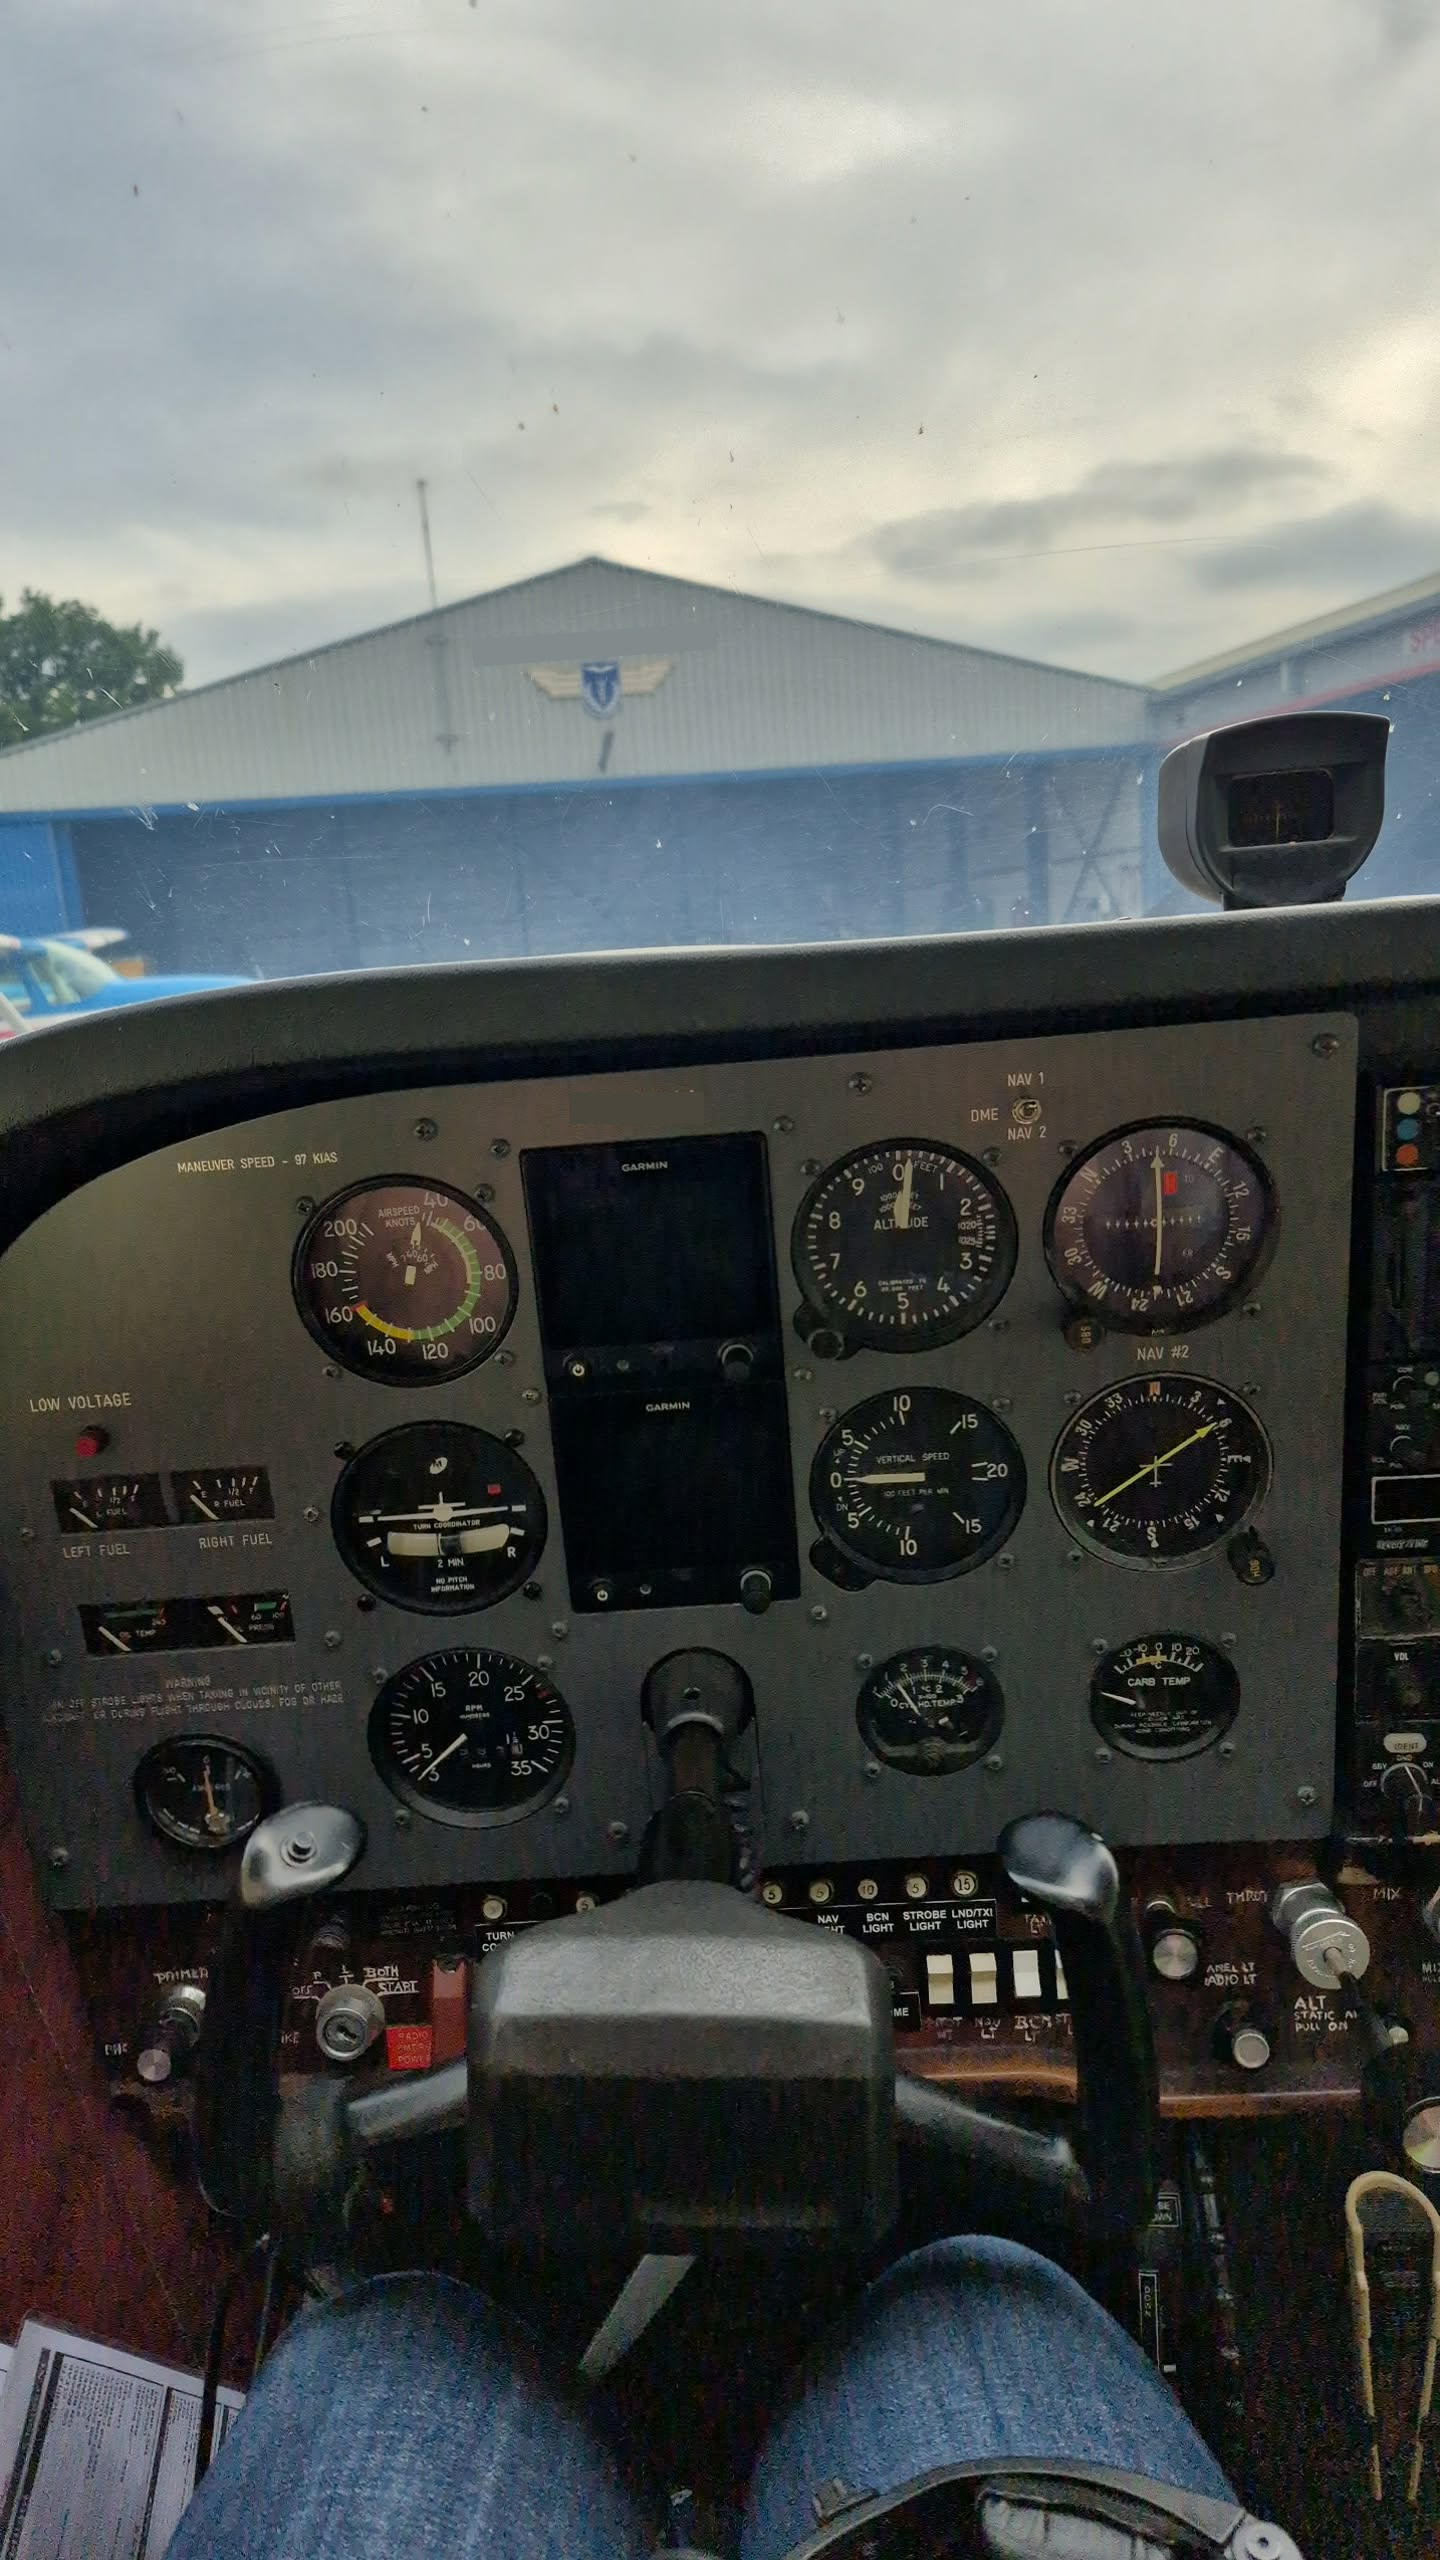
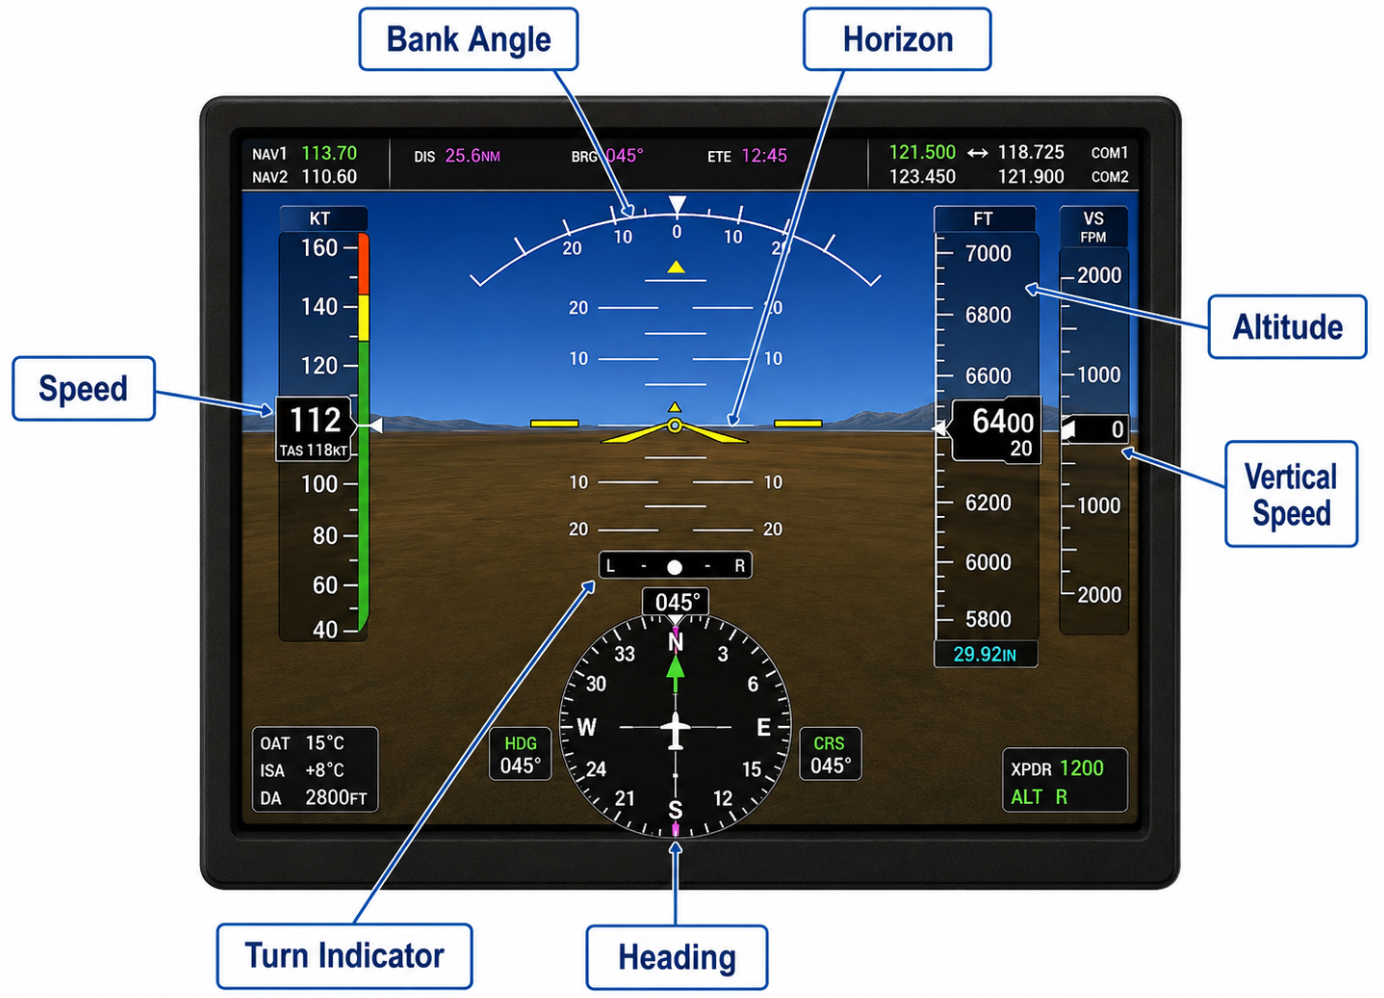
These speeds are marked on the Garmin G1000 primary flight display:
And they correspond to the take‑off phase like this:
During take-off:
We rotate at Vr (55 kts) to lift the aircraft off
We initially climb at Vx (65 kts) to clear obstacles
After ~200 ft AGL, we perform the after take‑off checklist:
Flaps up
Climb at Vy (75 kts)
Effect of throttle and the nose
Throttle input directly affects nose attitude:
More throttle / RPM → Nose rises
Less throttle / RPM → Nose lowers
When trimming and stabilizing the aircraft, throttle can be used to help level off and maintain a steady attitude.
Gliding
During descent from approximately 2000 ft to 700 ft, we performed a glide.
Normal descent: ~1800 RPM
Glide: Engine at idle
While gliding, we trimmed the aircraft with a slightly nose‑up attitude. This resulted in minimal engine noise and was a great exercise for understanding glide paths during engine failure scenarios.
Trimming
Trimming is essential for stable, level flight. It means correcting pitch for a specific combination of throttle, altitude, pressure, and speed.
A correctly trimmed aircraft maintains altitude without continuous control input.
Procedure:
Reach the desired altitude
Correct with the yoke (push or pull)
Trim away the yoke force by trimming nose up or down
Trim logic:
Trim down: Turn the trim wheel up
Trim up: Turn the trim wheel down
Although this feels counter‑intuitive, it mirrors the direction you would move the yoke.
Briefings
We practiced creating standardized briefings following the principle:
Say what you do, do what you say
Taxi Briefing
Mention taxiways
Mention hotspots
Stay clear of taxiway centerline to avoid “chimneys”
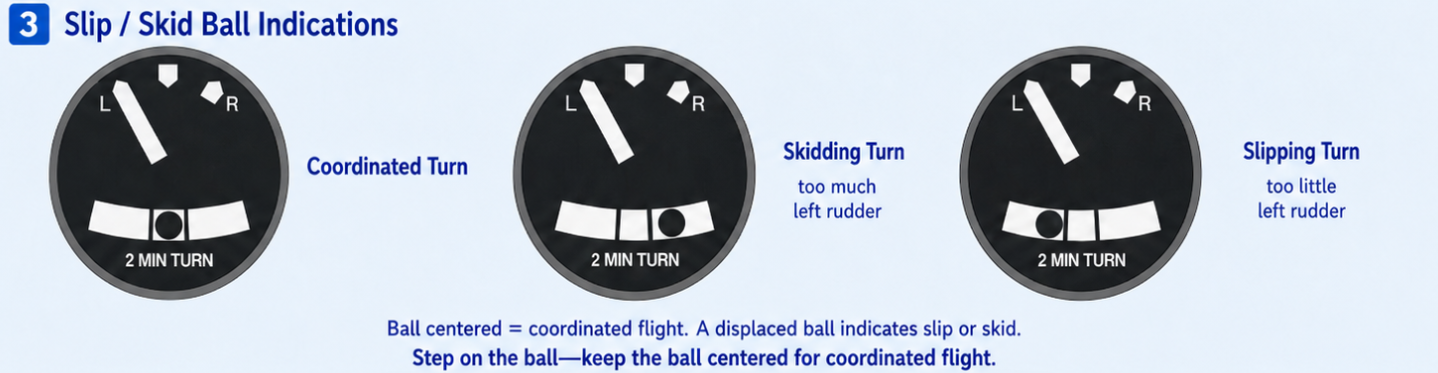
Check turn coordinator, compasses, and attitude indicator by steering right, then left
Park the aircraft at a 45° angle to the runway for run‑up
Departure Briefing
State the departure runway
Mention base leg and final checks
Confirm full throttle on take-off
Engine failure or fire with runway remaining
Including failures before rotation speed
Engine failure or fire without runway remaining
Forced landing
State Vr, Vx, Vy (55 / 65 / 75)
At 200 ft:
Flaps up
Climb to 700 ft
Leave circuit at 45° (e.g. 305° for RWY 26, 225° for RWY 18)
The flight details
End of the page 🎉
You have reached the end of the page. You can navigate through other blog posts as well, share this post on X, LinkedIn and Reddit or return to the blog posts collection page. Thank you for visiting this post.
This page can contain a collection of personal notes, steps to remember, finished and unfinished content. Please excuse brevity.
Do not use specific information given like fuel flow, landing/take-off distances for your flights. Always refer to the POH of your exact plane for flight preparation. My information is just for references that I used.
Introduction
Lesson number
Lesson name
Lesson date(s)
1.5
Airwork 3
26-09-2025
In this lesson we performed several airwork exercises, preceded by theory briefings.
The focus was on aircraft control, procedures, and situational awareness.
Exercises covered:
Basic climbing and descending to a specific altitude
Memory items for emergency scenarios (QRH)
Taxi briefing
Take‑off briefing
Normal turns (30° bank)
Steep turns (45° bank)
Basic climbing and descending to a specific altitude
In cruise flight, we typically fly around 95 knots (175 km/h).
When climbing or descending to a new altitude, we must do this efficiently and precisely, avoiding overshooting or undershooting the target altitude.
Climbing (APT)
Important terminology- Altitude – Height above sea level (ft)- Attitude – Nose angle (pitch axis)
For a climb:
Use Vy (best rate of climb)
Cessna 172: 75 knots
Use full throttle
Carburetor heat OFF (engine is already warm at high RPM)
Climb technique:
From straight and level flight at 2000 ft:
Increase nose attitude until 75 knots
Apply full throttle
Trim as needed to reduce control pressure
50 ft before target altitude:
Reduce nose attitude to slow the climb
At target altitude:
Level off
Accelerate to ~90–95 knots
Set cruise RPM (~2300 RPM)
Descending (PAT)
Descending differs from climbing:
No additional power needed
Controlled primarily by power reduction and attitude
Descent procedure:
Carburetor heat ON
Reduce power to ~1700 RPM
Set nose attitude for descent (~500 ft/min vertical speed)
Level‑off technique:
100 ft before target altitude
Carburetor heat OFF
50 ft before target altitude
Adjust pitch and power to level flight
Resume cruise:
~95 knots
~2300 RPM
Memory items in checklists
Aircraft Quick Reference Handbooks (QRH) contain checklists for various scenarios.
Some checklist items are marked as memory items which must be known by heart, as there is no time to read during the event.
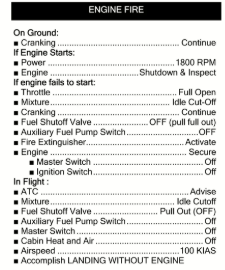
Example: Fire during start
If fire occurs during engine start:
Continue cranking for 5–10 seconds to try to suck the flames into the engine
If engine starts:
Parking brake set
1700 RPM
Prepare seatbelts, doors, fire extinguisher
Wait max. 2 minutes/120 seconds
If fire continues:
Mixture cut‑off
Throttle full open
Fuel selector OFF
Ignition OFF
Master switch OFF
If engine does not start:
Mixture cut‑off
Throttle full open
Continue cranking briefly
Ignition OFF
Master switch OFF
Fuel selector OFF (if possible)
Extinguish fire using any possible method
Memory items exist because delay can cost the aircraft and lives.
They must be learned per aircraft type.
ImportantAlways learn memory items directly from the aircraft’s Quick Reference Handbook. Procedures can differ between aircraft types and models.
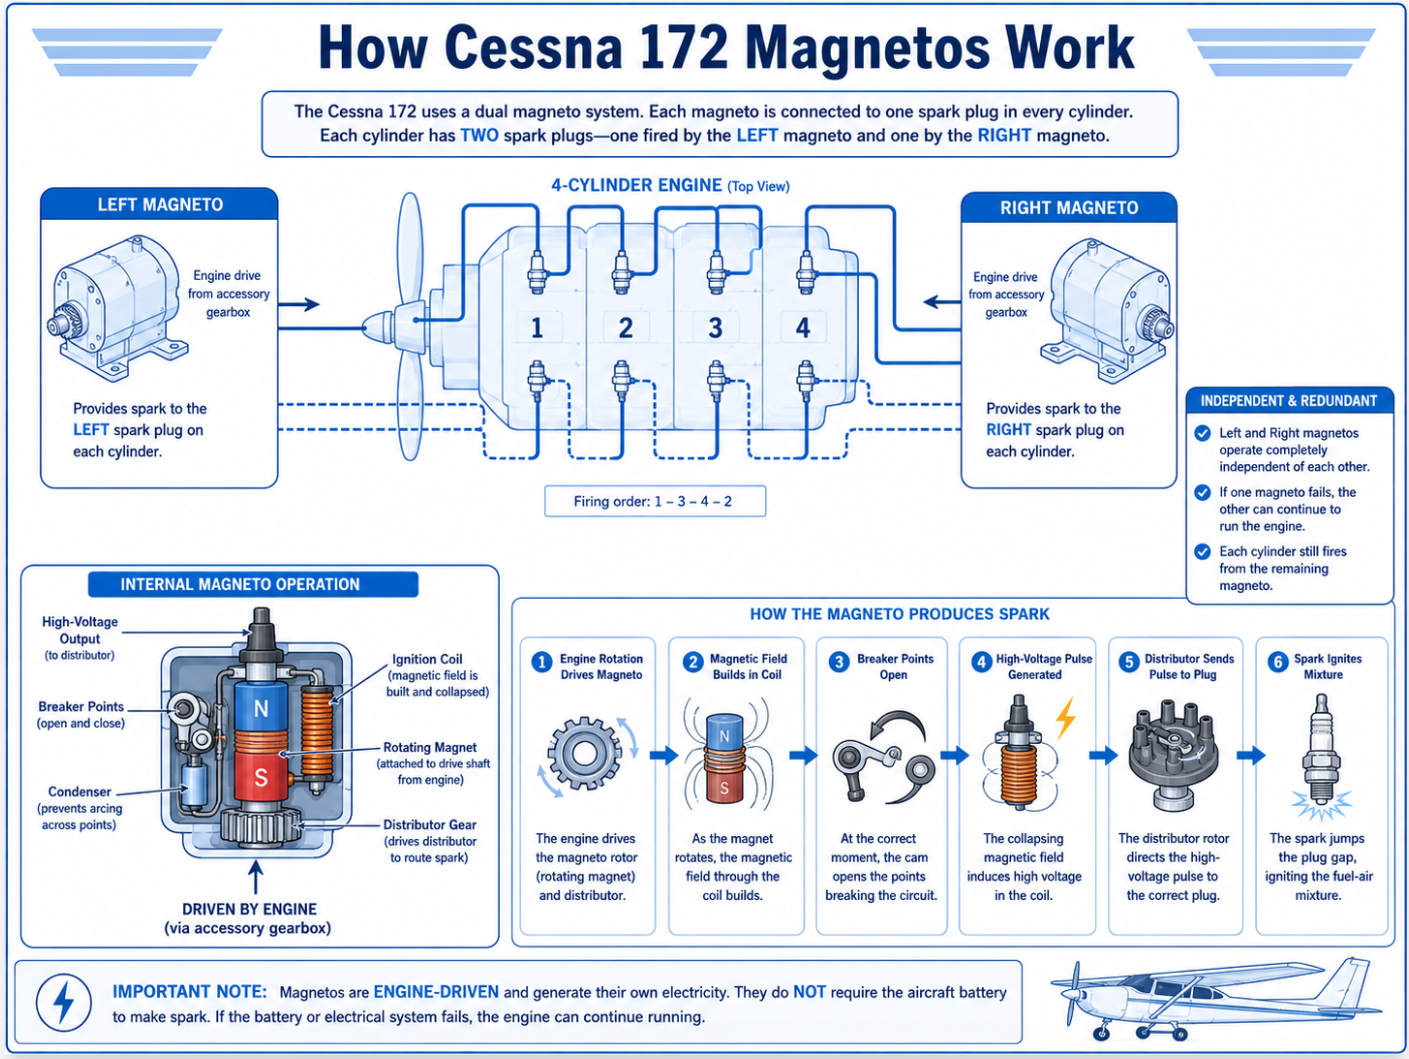
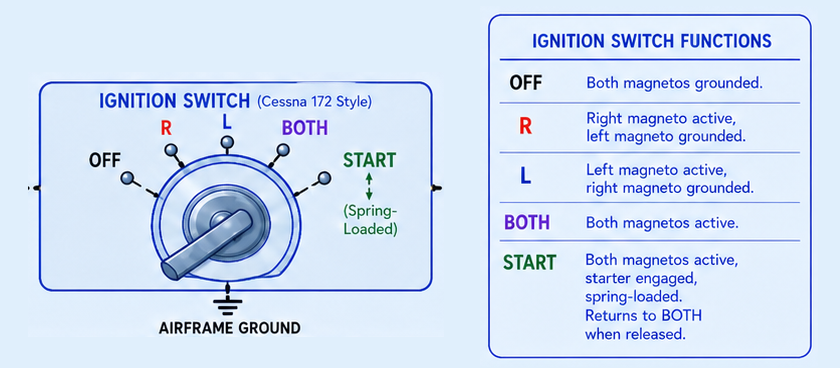
Magneto check
During the Before Take‑off checklist:
Set magnetos to Right first
Back to Both
Set magnetos to Left
Back to Both
This minimizes movement:
Two counter‑clockwise
Two clockwise
One counter‑clockwise
One clockwise
Airborne checks
While airborne, perform regular checks (once or twice per minute):
Oil pressure
RPM
Engine temperatures
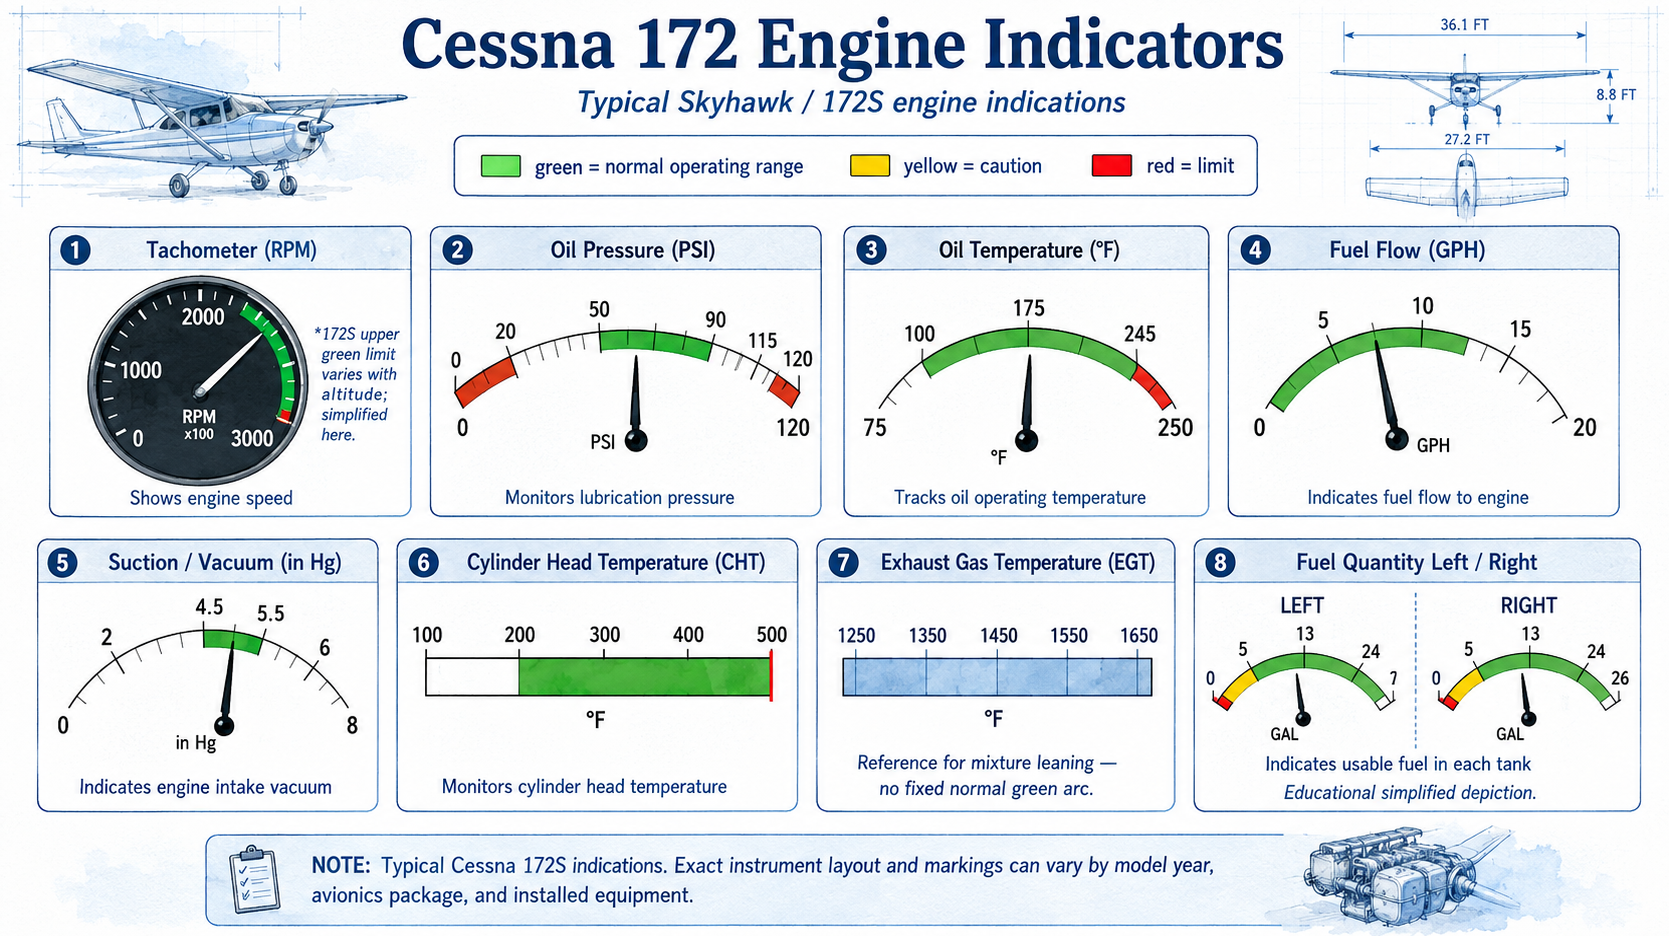
Vacuum gauge
Additionally:
Continuously scan for traffic using horizontal and vertical eye movement
Deviate or perform a 180° turn if traffic is at the same altitude
Be predictable, just like road traffic
Make radio contact whenever possible
Briefings
Briefings are performed at the start of each flight phase to maintain shared situational awareness and reduce surprises.
We use the ANWB structure:
Aircraft
NOTAMs
Weather
Briefing
Taxi briefing
Performed during the Before Taxi checklist.
Items to brief:
Aircraft status (defects / remarks)
Relevant NOTAMs
Weather impact
Route to run‑up area
Taxi speed and RPM
Expected turns
Instruments to check:
Turn coordinator (ball & symbol)
Gyro / magnetic compass
Heading indicator
Avoid hotspots and deviate from yellow line to avoid nose‑wheel chimneys
Effect of wind (counter‑steering)
Brake check when starting taxi
“Any questions?”
Departure briefing
Performed before take‑off.
Brief:
Runway and usable length
Flap setting (default: 10°)
Power setting
Rotation speed (55 knots)
Climb speed after 200 ft
Circuit height and exit (700 ft / 45°)
Direction of departure
Cruise altitude and speed
Emergency scenarios:
Before 55 knots
Throttle idle
Braking
Inform ATC
After 55 knots – non‑flyable
Forced landing ahead
30° left or right (wind‑dependent)
Above 1000 ft: consider turn‑back
After 55 knots – flyable
Stay in circuit at 700 ft
Full‑stop landing
Extra vigilance with gliders, parachuting or tow operations
Arrival briefing
Performed when approaching the destination airport.
Brief:
Aircraft status
Destination NOTAMs
Weather
Runway and usable landing distance
Flap setting (40°, adjust for wind)
Circuit direction
Approach speed ( 65 knots )
Go‑around procedure:
Complete circuit
Line up for another attempt
End of the page 🎉
You have reached the end of the page. You can navigate through other blog posts as well, share this post on X, LinkedIn and Reddit or return to the blog posts collection page. Thank you for visiting this post.
Slow flight and fast flight exercises focusing on aircraft control at extreme speeds, taxi checks from memory, and improvements in preparation and SOP usage.
This page can contain a collection of personal notes, steps to remember, finished and unfinished content. Please excuse brevity.
Do not use specific information given like fuel flow, landing/take-off distances for your flights. Always refer to the POH of your exact plane for flight preparation. My information is just for references that I used.
Introduction
Lesson number
Lesson name
Lesson date(s)
1.6
Slow flight
13-10-2025 & 20-10-2025
One of the harder lessons so far: slow flight. The purpose of this lesson is to fly as slowly as possible while remaining safely airborne in the Cessna 172.
The first time we flew this lesson, it did not go as planned. I lost too much altitude and controlling the aircraft was difficult, especially because the exercise had to be maintained for an extended period of time. For this reason, I had to retake the lesson.
Slow flight described
Before starting slow flight, we first scan for traffic, then begin the exercise.
Reduce throttle to approximately 1500 RPM
As thrust decreases, more lift is required → pitch the nose up
Trim the aircraft while reducing speed
To compensate for lift loss, increase throttle to around 1900 RPM
Maintain direction using gentle rudder input and focus on a reference point
Without flaps, we can safely fly at approximately:
55 knots (101 km/h)
With flaps extended, we can safely fly at approximately:
43 knots (80 km/h)
I found it very difficult to hold the aircraft in the correct attitude:
Altitude decreased too much or
Airspeed increased too quickly
Maintaining heading is especially challenging, because at around 10° nose‑up attitude, outside visual references are limited. In this configuration, heading control relies almost entirely on inside instruments.
After about three attempts, I managed to perform the exercise correctly, but it was clear that repetition was needed.
During the second lesson (one week later), performance improved significantly:
The aircraft was lighter
Stall speed was slightly lower
Control felt more predictable
The slowest speed achieved during slow flight was 49 knots (90 km/h), which is very close to the onset of a stall.
During the Before Take‑off checklist and magneto check, call‑outs are mandatory:
Confirm values are within limits
Ensure the nose wheel is straight before braking
Reflection
This lesson made it clear that an overall change in learning and preparation is needed.
Going forward, I will:
First study the SOPs
Practice exercises in the flight simulator
Only then perform them in the real aircraft
This should improve safety, confidence, and consistency during future lessons.
End of the page 🎉
You have reached the end of the page. You can navigate through other blog posts as well, share this post on X, LinkedIn and Reddit or return to the blog posts collection page. Thank you for visiting this post.
This page contains all my notes for the 1.7 Stalls lesson. This was a very hard lesson because of the weather situations in late 2025. The lesson was cancelled for about 5 times, and 2 times we were already in the air but the weather was worse than forecasted. Then we did 3 lessons full of stalls till this was proficient enough to succcesfully restore them.
This page can contain a collection of personal notes, steps to remember, finished and unfinished content. Please excuse brevity.
Do not use specific information given like fuel flow, landing/take-off distances for your flights. Always refer to the POH of your exact plane for flight preparation. My information is just for references that I used.
Introduction
Lesson number
Lesson name
Lesson date(s)
1.7
Stalls
03-11-2025, 30-01-2026, 27-03-2026, 03-04-2026 and 17-04-2026
This page contains all my notes for the 1.7 Stalls lesson. This was a very hard lesson because of the weather situations in late 2025. The lesson was cancelled for about 5 times, and 2 times we were already in the air but the weather was worse than forecasted.
For the stalls lesson we needed the following weather parameters:
Flying on 3000ft to have enough altitude (potential energy) to recover from a stall.
As we are flying VFR, we need to be at least 1000ft under the cloud base
No significant weather
10km visibility
Wind at most 15 knots
This means I have done this lesson about 5 times, where only the last 3 were really valid as stalls lessons. I had to do two lessons because of the time shortage we had on the first valid lesson and the several attempts.
03-11-2025
Today we had the lesson scheduled in the afternoon. As the clock was going back from UTC+2 to UTC+1 due to daylight savings, we have dark at an earlier time than before. We also had around 14 knots of wind which was completely crosswind to the runway.
We started doing the Stalls briefing and theory of a stall. Then we continued checking the aircraft and doing the rest of the preparations. Then we took off, but quickly realized that the flight will be ended soon due to the weather and visibility, as we were not able to climb to 2500ft.
After around 25 minutes after taking off, we landed and scheduled a new flight.
30-01-2026
Today it was my first flight lesson in 3 months after around 4 cancellations. In the mean while, i’ve been very busy succeeding in the following items:
Radio Telephony rating
Navigation PPL theory exam
Communication PPL theory exam
The weather was our bottleneck, once again today. It was a cool and cold winter day with snow from earlier this week. This gave us beautiful winter sights from the plane. At around 2000ft (600 meters) after take-off we decided to not do the exercises today because of the cloud front coming to our way. This gave us a great and nice airliner-like view of flying above the coming cloud layer. We have descended and then headed back to our base for a butter landing by my instructor.
27-03-2026
Finally after some cancelled lessons and a vacation, we were finally able to do a lesson again. The weather was great with a layer of stratiform clouds at around 9700ft.
We reviewed the theory about stalls and the briefings done before executing the exercise. Then we prepared the flight reviewing the NOTAMs, aircraft and potential risks, and taxied to the fuel station where we filled up the aircraft.
We did the exercises and this went better as we proceeded doing more stalls. At first, I was too gentle at pulling back and also by recovering the stall. After around 4 times, I did this prociently according to the instructor. Some area’s where I can improve is getting the aircraft into a full stall, as this is very counter-intuative, pulling even more on the yoke when all alarms and bells go off.
We did these 2 exercises:
Stall recovery in clean (flapless) configuration
Stall recovery in approach configuration (20 degrees of flaps)
I learned that stalls can happen at anytime, when not having full focus or flying in circuits so a fast and adequate recovery action is needed to save yourself and passengers.
03-04-2026
Today we had the second full stalls lesson with somewhat less good weather than last week but still proficient to do our lesson. As we only did 2 of the 3 stall exercises, I needed to do another lesson which was good.
We had good weather, once again a little crosswind of around 8 knots and a cloud base on 7900ft of stratiform clouds. In all words, good weather for a nice flight.
We did 3 exercises this lesson:
Stall recovery in clean (flapless) configuration
Stall recovery in approach configuration (20 degrees of flaps)
Stall recovery in landing configuration (30 degrees of flaps)
Recovering stalls went a bit better than the lesson before, but I needed to remind some things that must be done better:
The stall can be recovered by only decreasing the angle of attack
Not directly push full throttle, which happens out of reaction
Steer with rudder, and not with ailerons
Better managability of the flaps, flaps go faster up than down in flight
Pushing the yoke is natual when recovering from stalls, so don’t be scared
Overal the lesson went great, the crosswind takeoff was the best so far, doing everything right from the taxi to the leave of the circuit, including crabbing take-off and holding altitude. Its a very strange feeling when taking off and having some crosswind, that your plane points into the wing, while having an other track as your heading.
The objectives for me to do at home for the next lesson are:
Review briefings of the taxi, take-off and exercise
Review exact RT
Overall, great lesson and looking forward to the next one.
17-04-2026
Today we did a reviewing and pre-circuit lesson, covering every aspect I have learned before in one lesson. This to completely prepare for the upcoming circuit lessons, where every aspect is very important as we are much closer to the ground.
Basic ascending and descending
Airwork, maintaining different altitudes and headings
Trimming the aircraft
Every stall exercise
Slow flight
I finally flown some of the circuit, all the way to late final where the controls were transferred to the instructor but there was a lot of progress after this lesson.
This is also the last lesson where we actively did the stalls, and now we are ready for the real work.
Stalls theory
We did some theory about stalls, what they are and how they happen and must be answered. We can have 2 stages of stalls:
Stall approach -> A stall is coming, some symphons are available
Full stall -> The actual stall where you will feel a result, like a wing dip, nose dip or airspeed loss
I will describe both of those further.
Stall Approach Recovery
In the Stall approach, we are close to a stall and are in the phase that the full stall can be avoided by taking action. In this situation, we can identify a stall approach by looking for these symthoms:
Stall warning beep (around 5kts before the actual stall)
Buffet, this means that the aircraft shakes a bit due to the disrupted airflow on the wings
Airspeed indicator, the end of the green arc, or white arc if flaps are deployed
When having these symtoms, immediately do the following actions:
Release yoke back pressure and some forward pressure to end the stall and unload the wings
Full throttle power
Disable the carb heat to have the highest engine RPM
Level the plane
Remember to never use the ailerons when recovering from stalls as this changes the angle of attack of the wings even further, increasing your stall and decreasing change of recovery.
Then we do some checks from bottom to up to the left to double check if we doing things right:
Fuel Selector (both unless instructed otherwise)
Mixture rich
Throttle
Carberateur heat
Ignition
Magnetos
Engine instruments (Oil temperature, pressure, cylinder head temperature (CHT) and/or exhaust gas temperature (EGT), ammeter and suction/vacuum)
And complete the exercise with some outside checks (APOS):
Altitude
Position
Orientation
Sky 180 scan for traffic/weather
Full stall recovery
In the full stall, we are stalling and one of these three things are happening:
Nose drop
Wing dip (always one of the 2)
Altitude loss
When having these symtoms, immediately do the following actions:
Release yoke back pressure and maybe some forward pressure to end the stall
Full throttle power
Disable the carb heat to have the highest engine RPM
Level the plane
Remember to never use the ailerons when recovering from stalls as this changes the angle of attack of the wings even further.
Then we do some checks from bottom to up to the left to double check if we doing things right:
Fuel Selector (both unless instructed otherwise)
Mixture rich
Throttle
Carberateur heat
Ignition
Magnetos
Engine instruments (Oil temperature, pressure, cylinder head temperature (CHT) and/or exhaust gas temperature (EGT), ammeter and suction/vacuum)
And complete the exercise with some outside checks (APOS):
Altitude
Position
Orientation
Sky 180 scan for traffic/weather
One thing to add, if doing stalls in landing configuration, we need to simultaneously decrease the flaps to also decrease the drag, which means more engine power resulting in more speed. You must at least decrease the flaps to 20 degrees to gain power. Full power on flaps 30 or 40 has so much drag that the engine almost cannot compensate for it.
Homework Altitude vs. Distance
Because of the bad weather in the winter weeks and no chance to do the stalls lesson, I was asked to do some homework. This consisted of these questions to get a better understanding of power, pitch, speed, flaps and range.
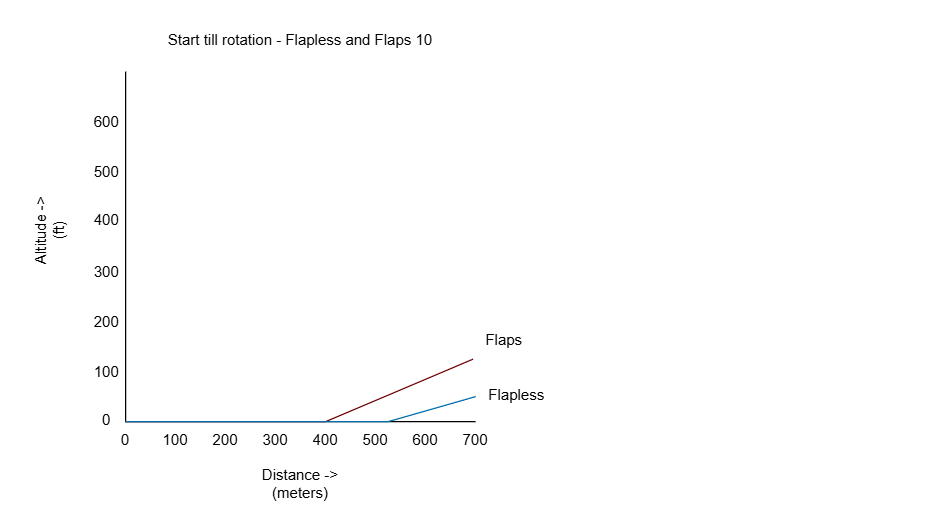
1. Flaps and Flapless at take-off
In the first question, I was asked to draw a graphic of what happens with the altitude and distance at the start of the take-off till rotation and somewhat after that.
In this graphic, I drew 2 lines, one for flaps 10 and one for flapless. As we have less lift without flaps, we will need a longer runway and therefore climbing later than with flaps extended. Both at a speed of around 65 kts.
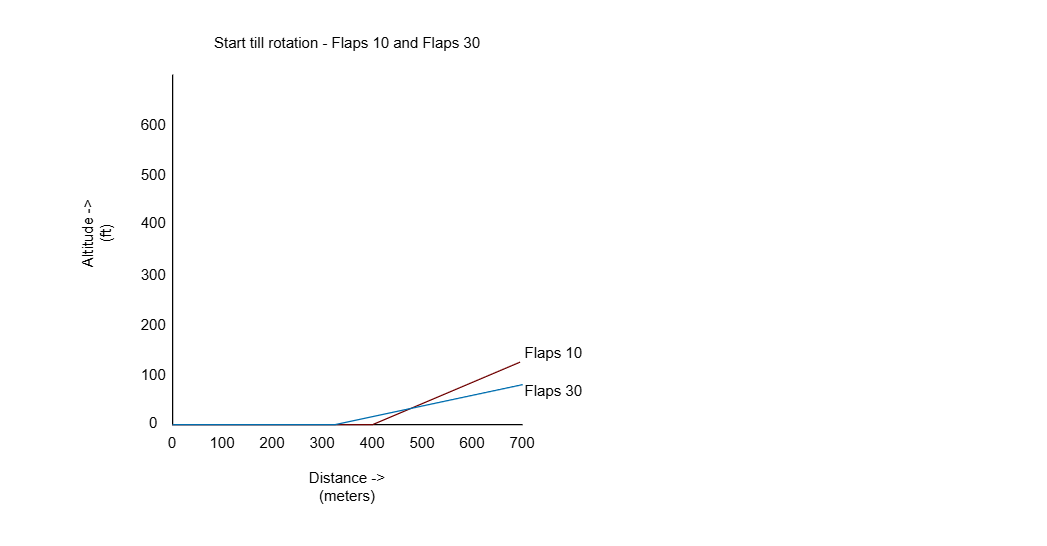
2. Flaps 10 and Flaps 30 at take-off
The second question was about answering what would perform better at take-off, flaps 10 or 30.
Flaps 10 is in terms the most efficient take-off flap setting, as this is a nice combination of lift and drag. Flaps 30 has an earlier lift-off point of the ground but at the cost of a low speed as result of the enormous drag it creates. We only use Flaps 30 in case of a short field take-off or needing to avoind objects at the end of a (short) runway.
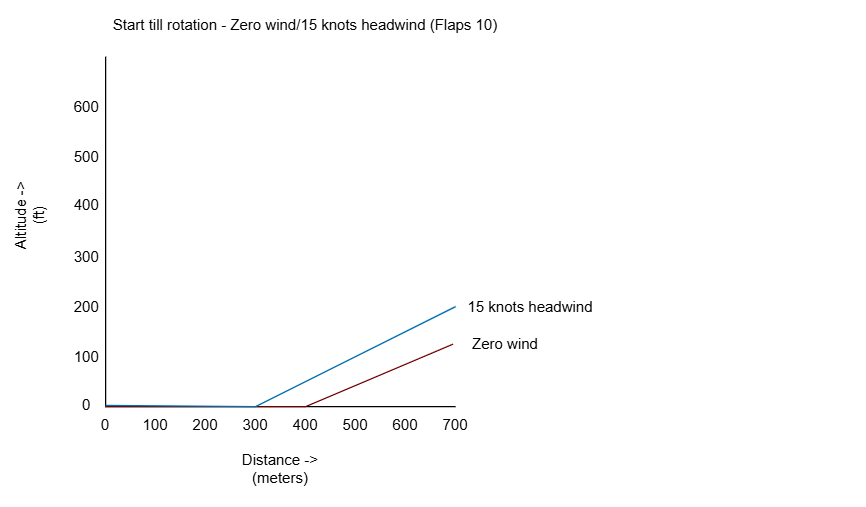
3. Zero wind and 15 knots headwind
In the third question, I have to display the difference of a headwind. I chose an headwind of 15 knots, as this displays a nice difference and its a moderate wind speed for a better lift off.
As you can see, with 15 knots headwind, we will lift of earlier because of the extra 15 knots true airspeed. The horizontal flow of air is already 15 knots, so our plane could lift of at about 40-45 knots instead of the normal 55-60 knots.
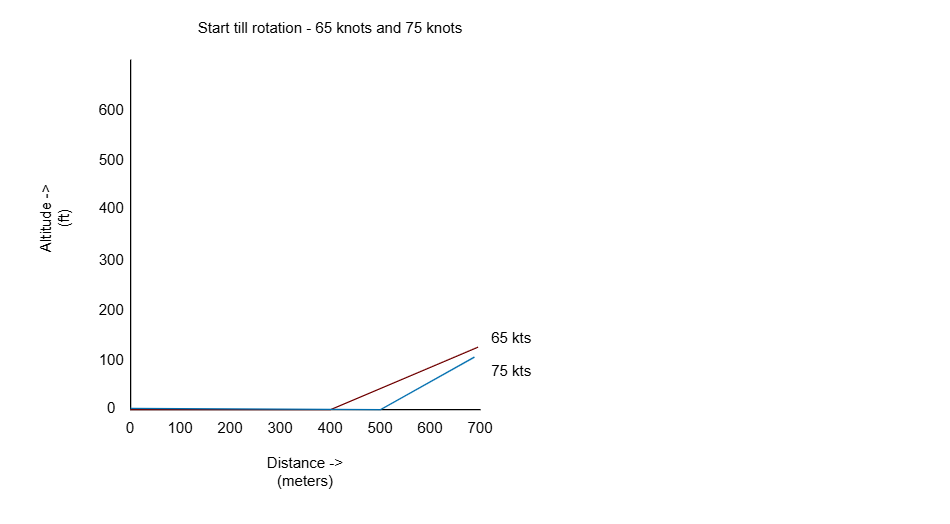
4. 65 knots vs. 75 knots
In the 4th question I was asked to draw the difference of 65 knots and 75 knots.
For the Cessna 172, these are exactly these values:
Vx: Best climb speed for short distance -> 65 knots
Vy: Best climb speed for short time -> 75 knots
So I drew this graphic where you see that to clear a certain distance, 65 knots is a better speed but when you take time, 75 knots is a better speed.
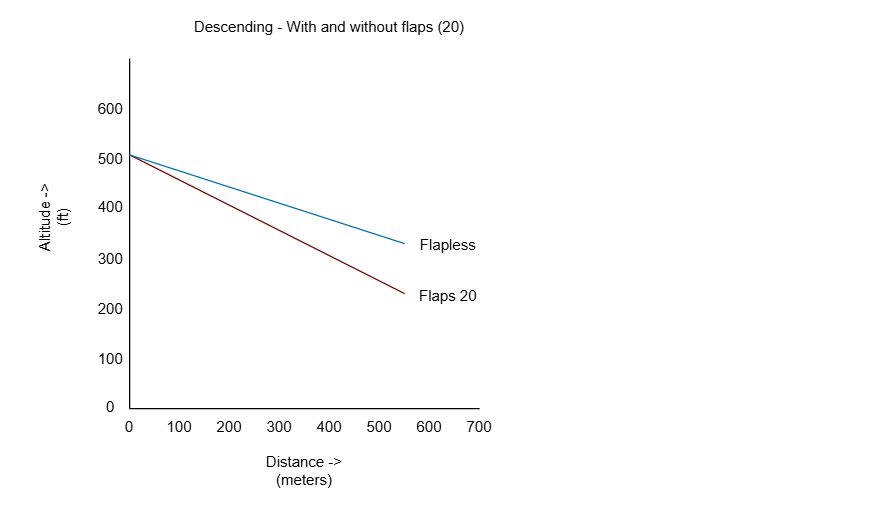
5. Descending with and without flaps
In the fifth question, we switch to the descending process. Here I was asked to draw the difference between descending with 1700 RPM and 95 knots with a speed of -500fpm vertical.
As Flaps increase or drag and lift and decreases our speed, we are able to descend faster in the same period of time.
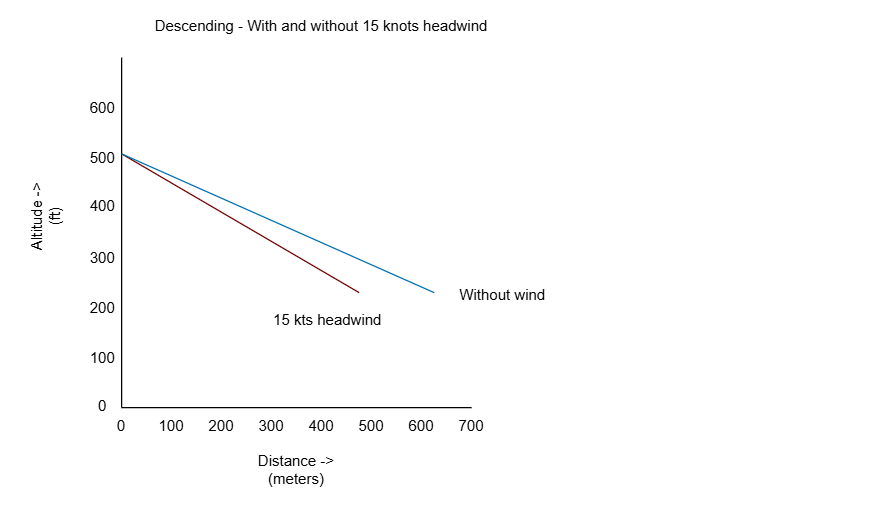
6. Descending with and without headwind
The 6th question was about the descending distance. Here we talk about horizontal distance we clear during descending.
As we want to descend, and we have 15 kts headwind, we are able to descend steeper. In the same time, we are descended further while flying less horizontal distance. This means a faster and steeper descent.
This is a result of the headwind decreasing our ground speed.
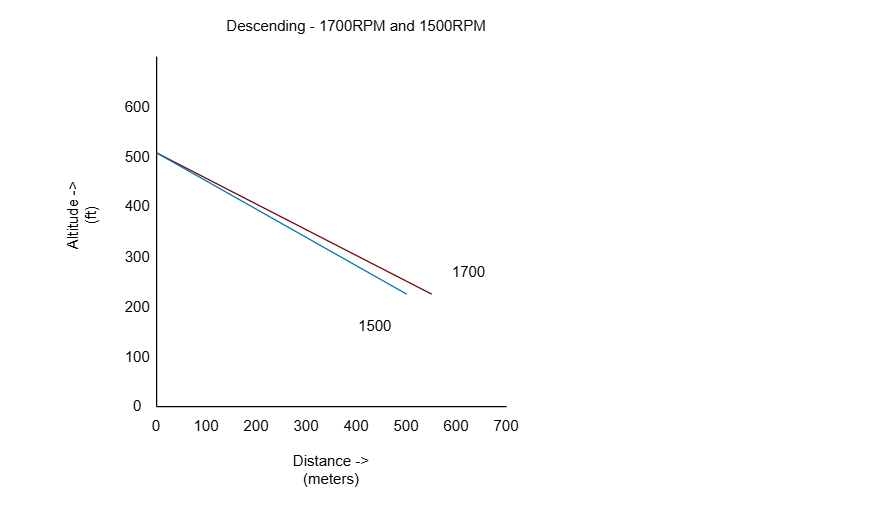
7. Descending - 1700RPM and 1500RPM
When descending with 1500RPM and 1700RPM, we have a little difference in terms of power. We have less forward trust, so somewhat more drag and a lower ground speed. This makes it possible to descend a bit faster relative to the ground distance.
8. Descending - Power Idle to touchdown
When descending with 3 different speeds, some strange will happen without knowing the theory behind it.
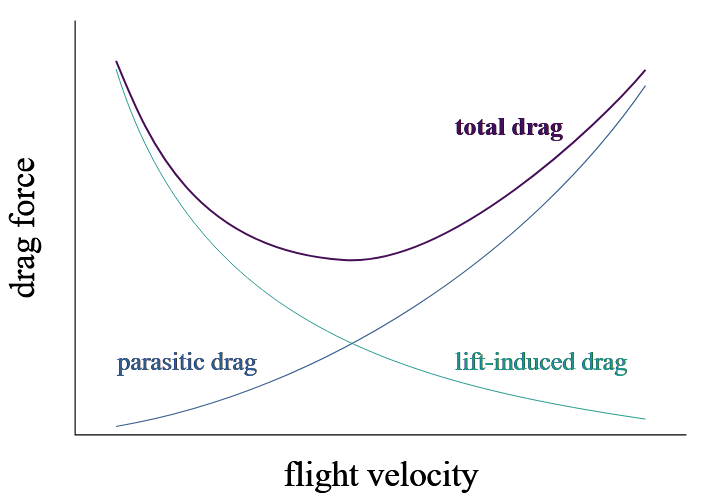
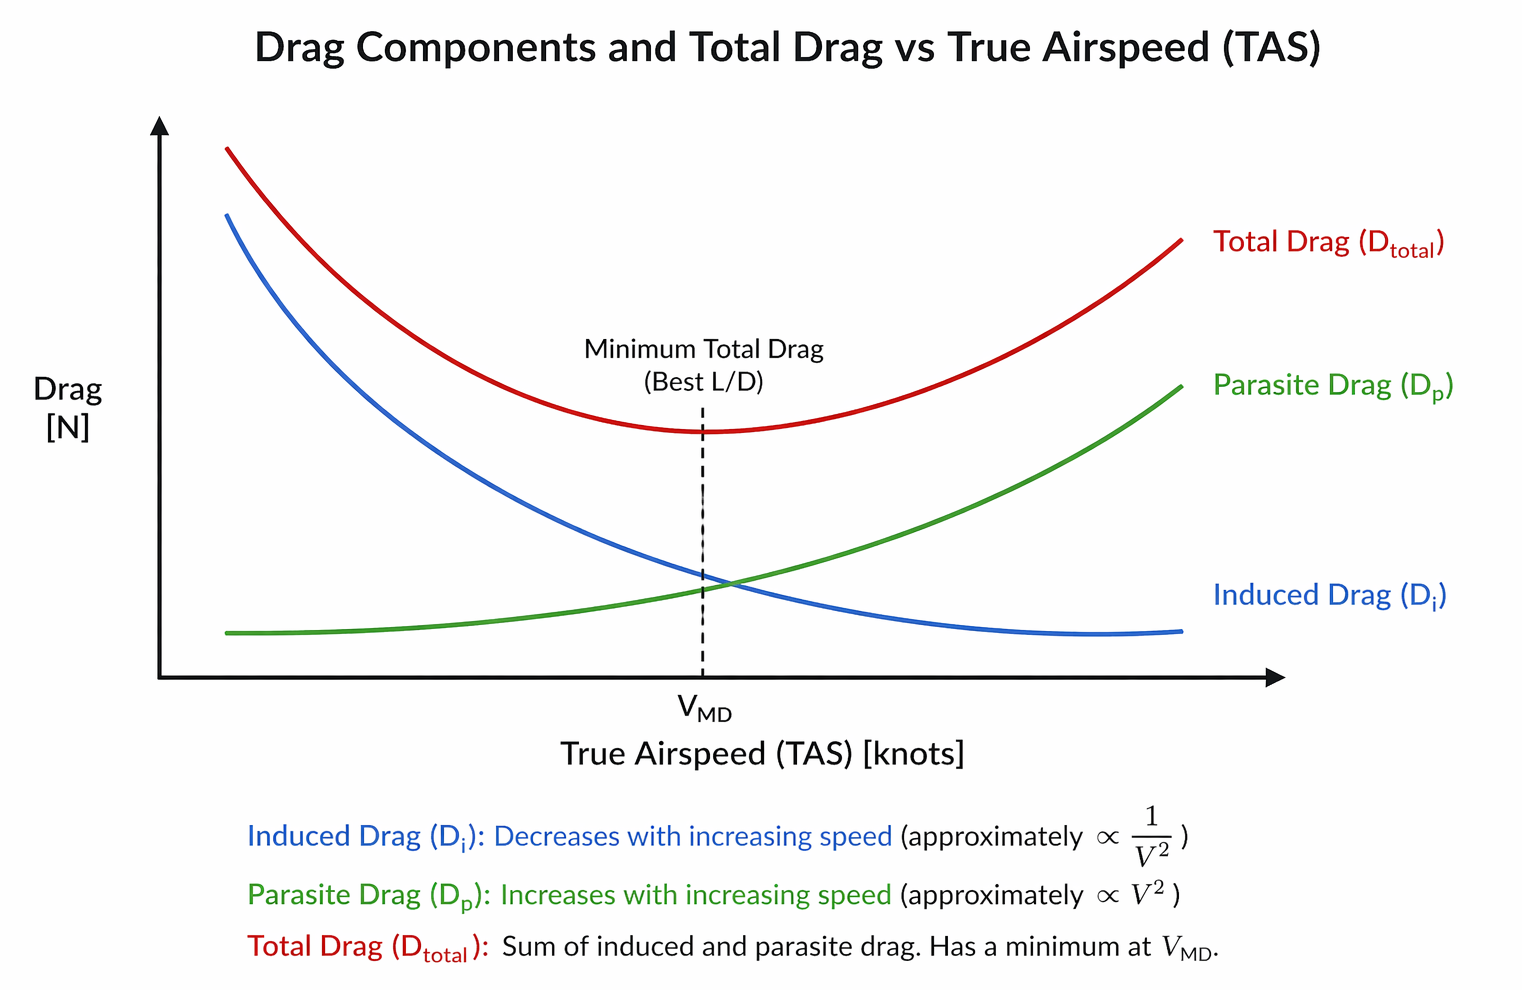
50 knots: You will descend steeply as you fly at the edge of a stall, this makes you descend fast relative to the ground and you have lots of parasite drag
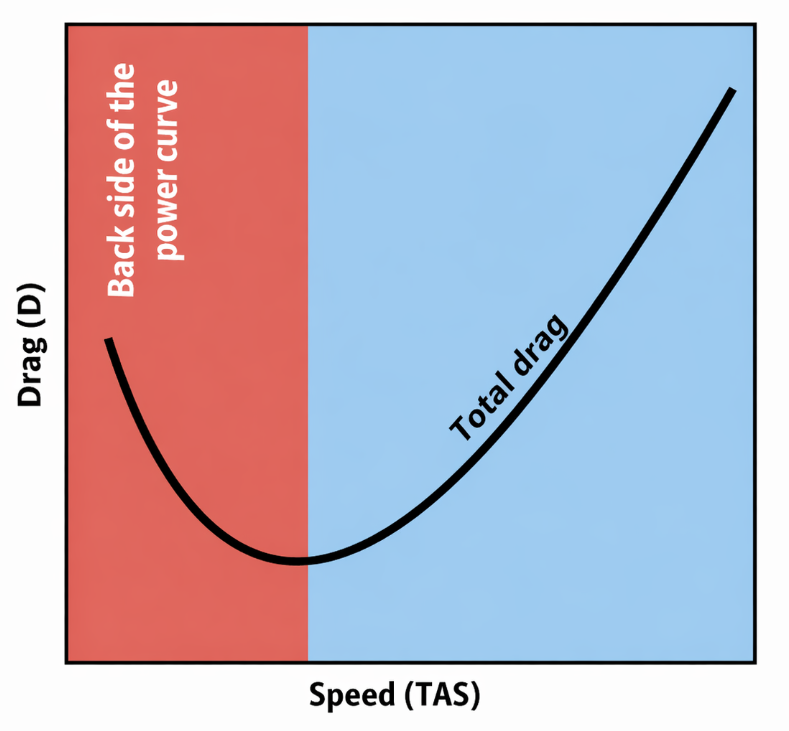
65 knots: this is the best glide speed of the Cessna 172 and gives you the best distance to altitude ratio, and in this graphic so the furthest distance. You are perfectly in the middle of parasite drag and induced drag at this speed
75 knots: this is faster than best glide speed and makes you descend too fast, too much induced drag
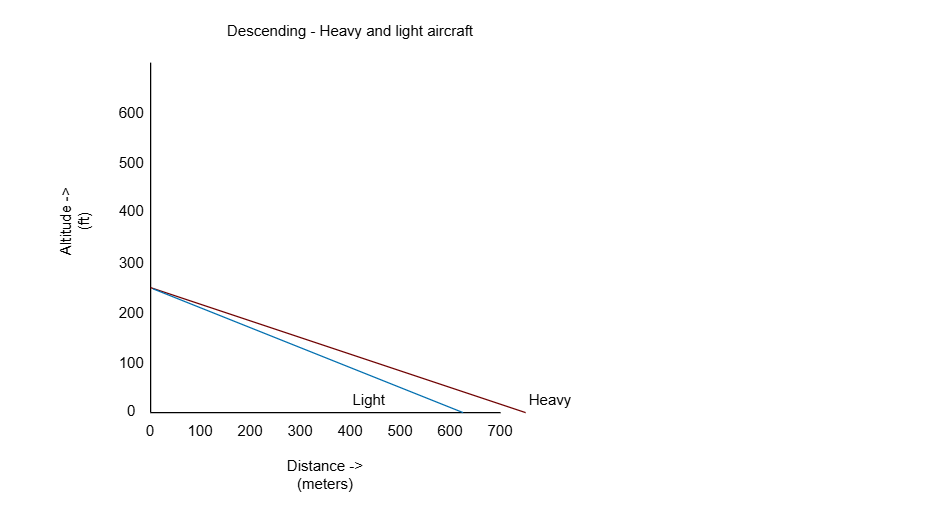
9. Descending - Best glide speed heavy and light aircraft
In a cessna 172, the default best glide speed is around 65 knots. However, if we increase the weight of the aircraft, we have to also increase the lift to compensate for the extra weight. To create this more lift we need a little more speed. Heavier aircraft means you need a higher best-glide speed.
However, a higher speed relative to the ground means that we need more horizontal distance than flying in a light aircraft, so you need to descend earlier.
10. Final to touchdown and roll-out - Flapless, 10 and 30
Descending with flaps, especially to touchdown is much easier, as the more degrees of flaps we have, the less ground speed and so more time to point the plane correctly at the runway. If we have a flapless configuration, we need to maintain a very slow speed resulting in a very high pitch attitude. FLaps help us descending more easily and to see the runway much better.
This is the reason we will be completely finished earlier on the runway, braking away our kinetic energy.
11. Final to touchdown and roll-out - Zero and 10 knots headwind
Headwind also decreases our groundspeed, having less speed relative to the ground. This gives us more time to point the plane at the runway and we need to lose less kinetic energy. With headwind, we will be standing still somewhat earlier.
End of the page 🎉
You have reached the end of the page. You can navigate through other blog posts as well, share this post on X, LinkedIn and Reddit or return to the blog posts collection page. Thank you for visiting this post.
Today was the day that we do circuit training for the first time. An hour before this flight lesson, I passed the meteorology theory exam which I’m very happy about, after some doubts the night before. Now I need to do just 2 more exams (AGK and POF) to be done with the theory.
This page can contain a collection of personal notes, steps to remember, finished and unfinished content. Please excuse brevity.
Do not use specific information given like fuel flow, landing/take-off distances for your flights. Always refer to the POH of your exact plane for flight preparation. My information is just for references that I used.
Introduction
Lesson number
Lesson name
Lesson date(s)
1.8
Circuit 1
20-04-2026
Today was the day that we do circuit training for the first time. An hour before this flight lesson, I passed the meteorology theory exam which I’m very happy about, after some doubts the night before. Now I need to do just 2 more exams (AGK and POF) to be done with the theory.
Before looking further into the required steps and procedures, I will first review how an aerodrome circuit looks like. Every part of it has an name, which makes it easy to communicate with ATC and other traffic about where you are around the aerodrome. Saying phrases like “North of the runway” or “Approaching runway” are very vague phrases which we avoid.
Aerodrome circuit explained
A circuit around an aerodrome is divided in several legs, where we will always take-off and land into the wind. That is where the names come from:
Leg name
Description
Upwind
The leg you fly when taking off
Crosswind
The leg after the first turn where you actually having crosswind
Downwind
The leg completely opposing the runway, where you gain ground speed due to tailwind
Base
The leg before final, where
Final
The final leg into touchdown/landing
Here is the full diagram of all legs including recommended flaps settings and engine RPMs with a Cessna 172:
The rest of this page, I will use these phrases.
Runway memory items
The runway memory items is this short checklist you must know right before lining up and take-off. Lining up means crossing the yellow separator from taxiway to runway.
Carb heat - Off
Transponder - ALT
Flaps 10
Strobe, and Landing lights - On
Taxi lights - Off
Pitot heat when in air under 10 degrees
Check magnetic heading
Circuit flying rules
In the circuit, some rules apply to flying the circuit to make it safe for yourself, other traffic and people on the ground.
Minimum altitude for turning is 300ft HAA (Height above aerodrome), normal turning altitude is 500ft HAA
Do not perform the after take-off checklist in the circuit
On crosswind leg, pay attention for possible new traffic joining the circuit at mid-downwind. This is the traffic entry point
Descend power is 1500RPM
Turn to final with at least 70 kts IAS and max 20 degrees bank to avoid a stall, preferably fly every turn at 20 degrees max: when not climbing
You should have 350ft HAA after completing the turn to final
Landing flaps must be extended at 150ft HAA
RT calls in the circuit
At some points, the tower and other traffic expect you do do various radio calls in the circuit. This is an extra reminder to other traffic to announce your position and traffic separation.
Lining up runway (initial take-off)
Beginning downwind
Mid downwind -> landing intention (Full stop/Touch and go)
On base (not required)
On final
Possible go-around
When leaving the circuit
Leaving circuit area
The lesson itself
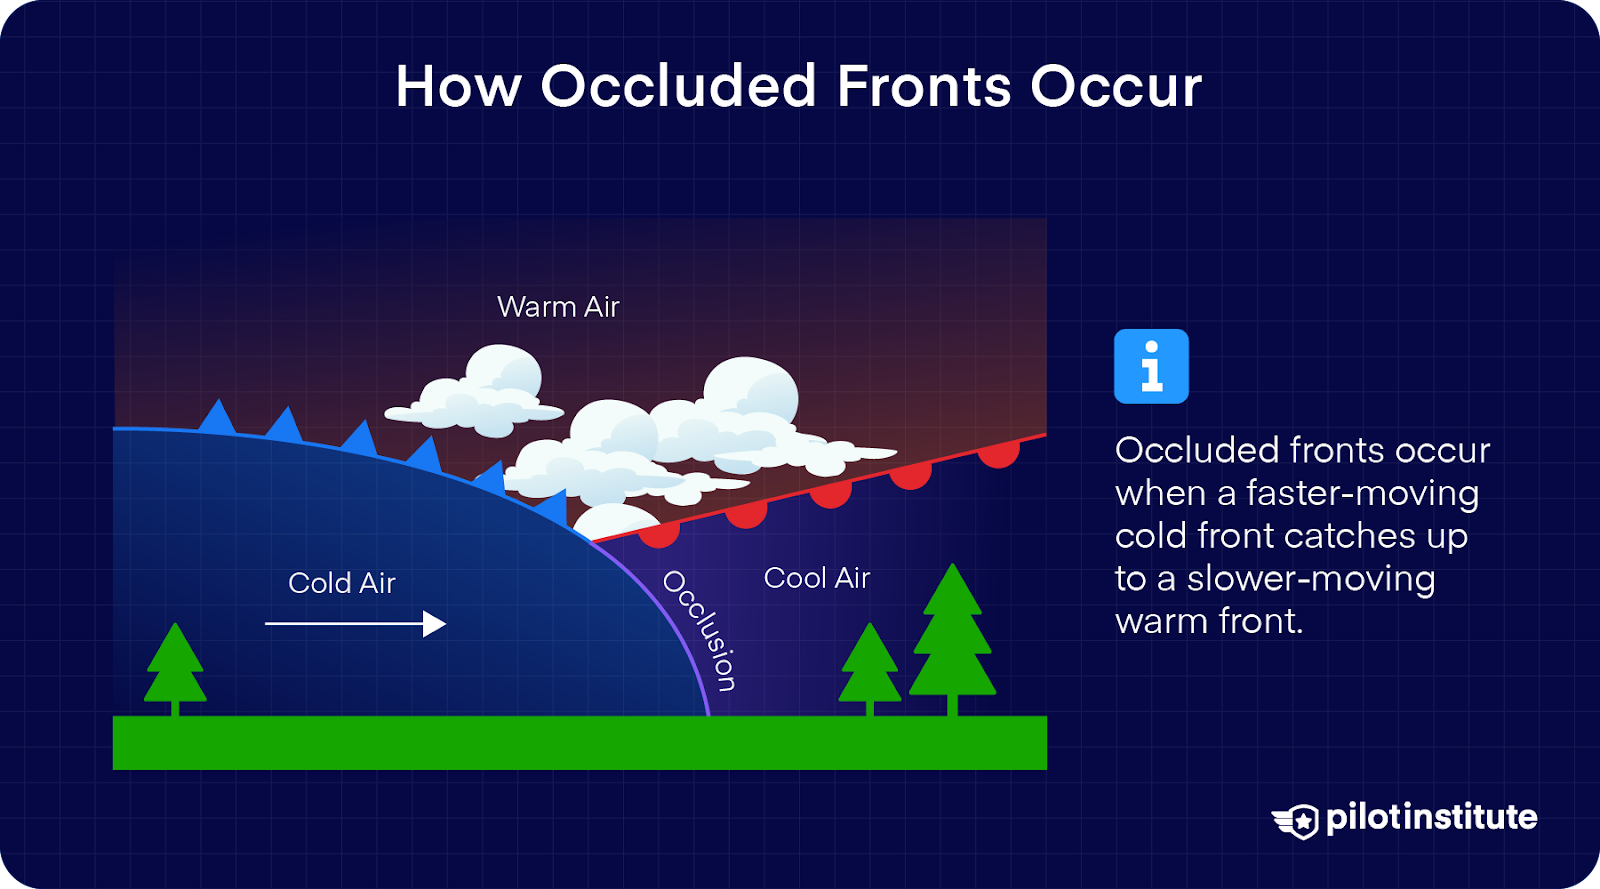
The lesson itself went great. The weather was okay but not great. We had a slight crosswind coming from the north at around 7-8 knots. This was completely opposing the runway at a 90 degrees angle. It was around 12 degrees and a sky filled with cumulus clouds with a layer of altostratus above. A typical occlusion-front weather type.
After doing the pre-flight inspection on my own we taxied to the runway and took off. We exited the circuit to re-enter it again, just to practice this. Then we did 6 circuits and landings with flaps and a last circuit without flaps.
The most important sentence of this lesson is: “Pitch for speed, power for altitude”. This means:
Increase power to gain altitude, decrease power to lose altitude
Increase pitch angle to lose speed, decrease pitch angle to gain speed
As we had a crosswind, we needed to do some other actions too. We had to crab the airplane into the wind to maintain the track to the runway and we need to land on the wind-facing wheel first. This prevents us from overrunning the runway by the wind.
The lesson went great and after some touch-and-go’s I think taking off went a lot smoother.
Remarks
The set of real reminders which I need to remember for future lessons are the following:
Starting the pre-flight inspection, check magneto’s set to OFF -> this prevents a hot prop
Carb heat must be set on downwind leg and kept on till after landing and completing the after landing checklist
Keep the plane into the wind with Ailerons
Review and practice the briefings for take-off and approach
End of the page 🎉
You have reached the end of the page. You can navigate through other blog posts as well, share this post on X, LinkedIn and Reddit or return to the blog posts collection page. Thank you for visiting this post.
This page can contain a collection of personal notes, steps to remember, finished and unfinished content. Please excuse brevity.
Do not use specific information given like fuel flow, landing/take-off distances for your flights. Always refer to the POH of your exact plane for flight preparation. My information is just for references that I used.
Introduction
Lesson number
Lesson name
Lesson date(s)
1.9
Circuit 2
23-04-2026
Today we had a beautiful weather day with a small layer of stratus clouds dissolving as the sun rose and with a slight crosswind component. At the time of take-off, they almost all dissolved giving us a clear sky with sun. The wind was around 6 knots, coming in a 60 degree angle of the runway, which is not that strong and good for some circuit training. Because we did some basic circuits the previous lesson, we will going to make it a bit harder now with some more factors into play.
In this lesson we also did the following extra exercises:
The circuit went good, with some remarks of course, as this is the second lesson. We added the downwind checks where we check the following (iHARSi):
Incoming traffic
Altitude
Distance to runway
Heading
Speed
Incoming traffic again
On downwind, we do a little rounding checkup of every important component of the plane where we have to determine if we are going to get the runway.
Fuel selector: Both
Flaps -> to 10 degrees
Mixture: Rich
Throttle
Carb heat -> set to on (pull)
This went better as we progressed into more circuits. However, still a lot room for improvement. Everything is clear but when all components come into play at the same time when flying a plane is a bit hard.
Rejected take-off
A part of this lesson was performing a rejected take-off. This is a procedure where we determine, during the ground-roll for taking off, that it’s unsafe to fly. This can have multiple causes, like:
Birds on the runway
Engine RPM unstable or too low
Incoming unforeseen aircraft
Other causes which renders the plane not safe to fly
When performing this, we close the throttle and keep the nose wheel somewhat lifted to defend it from shimmnying. We will only brake to get the right taxiway or when we do not have enough runway left.
Short field take-off
At a short field take-off, we consider the runway length very worthy and limit the amount needed to clear an object at 50 feet after the runway. In this procedure, we will line up on the runway by limiting the amount at the start. We keep holding the brakes there till the engine hits full RPM. Then we release the brakes and off we go. We will catch up the unwanted movements of the plane with the rudder pedals while keeping our heels on the ground.
When we have crosswind, we steer into the wind and gradually release that steering as we tend to hit rotation speed.
Soft field take-off
We also performed a soft field take-off, where we consider the runway to be soft and has a great risk of being stuck in mud or grass. We do a rolling take-off here, where we keep rolling and going into the take-off roll. Stopping might get us stuck in the grass, making the situation very dangerous.
We also keep some back pressure on the yoke to release pressure of the nose wheel.
Go around
A go around is performed if an aircraft is not safe to land or the runway is already in use. During the go around we push full power and then release the flaps to 20 degrees. This gives us more engine power as the drag reduces a lot. If there are other activities at the aerodrome like towing, gliders and parachutes, we keep the opposing side of the runway for those activities.
We also did this exercise today and went all right. However I need to remember keeping the plane straight and not dipping because of the lift-loss.
Wave off
A wave off is when we are busy landing but we are not 100% stable just above the runway. During this exercise my instructor pressed the rudder pedals softly on purpose, and we had to give full engine power to make another approach.
Waving off is better than a bouncy landing which can be dangerous.
Glide-in approach
We did also an glide-in approach. This is where we only use the pitch angle to glide to the runway. On the Base leg, we closed the throttle and glided from 1000ft to the runway. Being on 1000ft gives us a lot of potential energy to make it to the runway. This was a very fun exercise to do.
Flapless landing
We ended this lesson with a flapless landing once again. Here we do not use flaps, making the approach angle much flatter. This however comes together with higher speeds (+5 kts on every leg) and a longer landing roll.
Remarks
Climb attitude after take-off -> be sure to keep 65 knots when climbing from the runway and then 75 knots after retracting the flaps
Climbing turns with maximum of 15 degrees
More exercise on doing multiple things together -> downwind/base
Battling the effect of flaps: more flaps means more climb and less flaps is less climb. Be more pro-active when setting these by reacting faster on those effects
Again review my briefings
Right now my total amount of flight hours is 12 hours and 45 minutes (12:45) which is more than proficient for the lessons I have done.
The next lesson
The next lesson we will perform a diversion to another airfield, as where I have to prepare for that reviewing the charts and the procedures. This is my homework.
I will also perform this into my simulator in the days towards this next lesson.
End of the page 🎉
You have reached the end of the page. You can navigate through other blog posts as well, share this post on X, LinkedIn and Reddit or return to the blog posts collection page. Thank you for visiting this post.
In lesson 3 of the circuit training, we reviewed the circuit part and did a training diversion to an airfield in Germany, to experience a diversion but also a navigation flight. This page also contains the additional circuit lessons I took to fully master normal and crosswind landings.
This page can contain a collection of personal notes, steps to remember, finished and unfinished content. Please excuse brevity.
Do not use specific information given like fuel flow, landing/take-off distances for your flights. Always refer to the POH of your exact plane for flight preparation. My information is just for references that I used.
07-05-2026 (Diversion)
Lesson number
Lesson name
Lesson date(s)
1.10
Circuit 3 with diversion
07-05-2026, 09-06-2026, 22-06-2026 & 16-08-2026
Today we did a circuit training lesson with a diversion to an airfield in Germany. The purpose of this lesson was a little preparation for the upcoming solo lessons. Then I have to find a possible diversion for myself, as an airfield can be closed temporarily for several reasons. We don’t want to still be in the air while having too less fuel and such.
It was a great day for flying with some sun, 5 knots crosswind and an air filled with stratocumulus and alto-cumulus clouds and the temperature was around 14 degrees.
We took off from our default airfield with a short briefing of the route. Then we went to the fuel station to have at least 24 gallon on board, giving us 3 hours of flight time which is plenty. According to the lesson program, we needed to do circuits but we only did the diversion today. We aim for another 2-3 circuit lessons to fully control that.
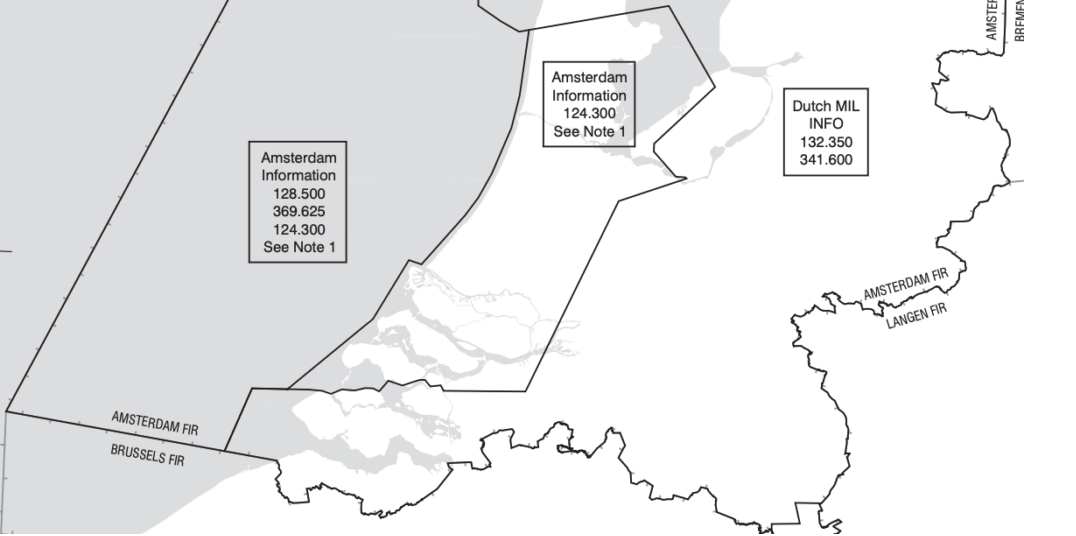
After taking off we signed on to Dutch Mil info for the first time, this is something which is not needed in training flights but we did it to get an basic understanding of how this is done. Dutch Mil Info is the Flight Information Service (FIS) for most of the Netherlands, giving traffic and weather information to General Aviation pilots. Its not a control center, so we pilots still have to maintain our own separation but Dutch Mil can give us possible information in special cases.
We navigated to the other airfield using basic chart-navigation. We plotted 3 lines between obvious visual reference points like cities, powerlines and trainroads and calculated a basic course-plan. We followed those points and after a short flight we landed safely on the airfield. Then after a short break we headed back to our main airfield and debriefed the lesson.
Remarks
Some remarks from this lesson for myself are:
Take higher circuits into account, we were a little high on final making the landing distance also very long
Keep the altitude better under control using visual flight -> pitch attitude
All with all it was a good lesson with two decent landings and looking forward to the next one, which details will come online soon.
09-06-2026
Today we had a great circuit training flight of exactly one hour. The weather was okay with around 9 knots of slight crosswind but almost full headwind which is nice for lessons like this.
We did 8 take-offs and landings which in the beginning I had to first get a little used to the controls again after a short break of around 30 days of flying and at landing 3 it went a lot better. Landing 7 and 8 went completely by myself where number 7 went a little bit bouncy but number 8 was really smooth.
In the briefing for this lesson I learned more about the attitude of the planes’ nose during the flare, this must almost hit the horizon for the pilot’s point of view. We need to shift the focus point to the end of the runway as you point the nose towards there. This is something which sounds simple but takes a lot of practice to master.
Remarks
Some remarks of this lesson where:
Steer somewhat smoother and not do great actions, especially on final and flaring
Remember the downwind checks after the initial position, altitude and incoming traffic checks
Seats and belts
Fuel selector
Mixture
Engine instruments
Carb heat -> on
Flaps
Overall it was a good flight lesson and I think I made some decent progress.
22-06-2026
Today, once again a circuit training lesson. We flown about 1 hour and 15 minutes and did 10 take-offs and landings. The weather was very great, only downside was the relatively high temperatures. About 26 degrees celcius at 11 o’ clock. The sky itself was almost clear, only some high level cirrus clouds so nothing to worry about on that part. We had a little crosswind of 7 knots.
I have also reviewed the briefings and RT another time and learned them completely. This was the first lesson I did them correctly on my own, so thats a win.
The first 3 landings went a bit rough where the instructor had to correct some but it went gradually better. Did not fly for about 2 weeks so we have to adapt a little. I also had a little harder time centering the plane on to the runway because of the crosswind.
Then I had about 4 landings with minor corrections needed by the instructor and we also did a go-around to simulate a failed approach or landing. Its still a human task of course.
At about 2 landings, the altitude for the flare was correctly done by myself but then the flare itself was too weak, causing the plane to hit the runway a little hard. But hey, any landing where you can walk away from is a good landing.
Remarks
The room for improvement/remarks of this lesson are:
Get the flare altitude right
The coorperation of yoke/rudder input when having crosswind landings (slipping)
RT lines
Downwind checks were okay but also keep incoming traffic in mind, make bigger turns when traffic in front and/or slow flight
28-06-2026
Today a lesson on Sunday for the first time as the weather was pretty good. It was a bit warm, like 27 degrees celcius, giving us worse climb performance but did not stop us for once again a circuit lesson.
The lesson went progressively better as the last 2 or 3 landings were very good. I learned that at the flare/touchdown looking at the end of the runway and pointing the nose to the end of the runway is a great technique to make soft landings without bouncing too hard on the tarmac. Also the RT simultaneously went better and almost smooth on the end.
Remarks
Of course there were some remarks which I have to improve:
Keep an eye on the field
Apply slow flight when busy traffic in the circuit
Keep looking at the end of the runway during the flare
The instructor said that he saw some good progress in these last two lessons which is nice.
16-08-2026
Today we went back to a circuit lesson only to prepare for the first solo flight. We had some quite worse weather than the lessons before, with some light rains just before the lesson. The sky was fully filled with stratocumulus and nimbostratus clouds but with some dry periods over the day. The wind was about 7 knots and around 20-30 degrees of the runway so that was really great for some circuit training.
We first left the circuit and gone back in to train this as well. Then we did 8 landings in total, where 5 of them where great according to my instructor. 2 were not corrected in time and one we had to perform a wave-off, which is basically a late go-around. This happened because we needed to correct with our rudder too much and caused some bouncing action.
The last 3 landings in a row went very great where the flare was executed much better and we let the aircraft do the descent itself by flaring, power idle and keeping the nose just below the horizon.
Remarks
The remarks and homework of this lesson are:
Keep the speeds good ay all phases of the circuit:
55 knots: Rotate
65 knots: Climb out of ground effect
75 knots: Climb out from 200ft to 700ft
Keep 75 knots till 700 feet is reached
Downwind: 80-85 knots
Base: 75 knots
Final 65 knots all the way till the runway threshold
The flare-height was good according to my iinstructor, so we need to keep this
Minor rudder inputs on final
Remember all checks, start on beginning downwind and perform check run 1 for incoming traffic and position, then perform downwind checks
All with all a great lesson with great improvement since all the previous circuit lessons.
End of the page 🎉
You have reached the end of the page. You can navigate through other blog posts as well, share this post on X, LinkedIn and Reddit or return to the blog posts collection page. Thank you for visiting this post.
Today we did the progress test for phase 1. This is a flight where we will perform every exercise learned in Phase 1. To enhance this lesson, I got another instructor which can also help me improve on different area’s.
This page can contain a collection of personal notes, steps to remember, finished and unfinished content. Please excuse brevity.
Do not use specific information given like fuel flow, landing/take-off distances for your flights. Always refer to the POH of your exact plane for flight preparation. My information is just for references that I used.
Introduction
Lesson number
Lesson name
Lesson date(s)
1.11
Progress test 1
20-07-2026 & 04-08-2026
Today we did the progress test for phase 1. This is a flight where we will perform every exercise learned in Phase 1. To enhance this lesson, I got another instructor which can also help me improve on different area’s.
Progress test 1 (20-07-2026)
Another lesson today after again one cancelled lesson because of the weather. Flying with 34 degrees celcius was not what we wanted. Haha.
Today we had around 20 degrees celcius, with a 8 knots wind from the north (variable between 280 and 040) and a sky full of cumulus clouds, starting at 2800 feet AGL. A great day for some VFR flying with no significant weather or other risks.
So today we will do the progress test for phase one. A lesson of one hour to perform every exercise done in phase one:
Steep turns with 45 degrees bank angle
Stalls in clean, approach and landing configuration
Climbing and descending turns
Two circuits
Landing the plane with some crosswind (~8 knots)
Homework
I got some homework for the next lesson, which will also be a progress test but then a final test for both the exercises above and the circuits.
Progress test 1 (04-08-2026)
Today we had another progress test 1 lesson to actually put the cherry onto the pie like we say in Dutch. It was a very warm day today with a stunning 34 degrees celcius. The sky was very blue with some cirrus and cirrostratus clouds, but as they are very high level clouds no reason to not fly.
Because of this temperature, we have to add up 2400ft to our density altitude. At sea level, this is not a problem but this can be a problem if flying from a high-elevation field like Courchevel in France.
This weather gives us worse climbing performance because of the less amount of air particles and a longer take-off run needed, but when flying, our TAS and ground speed will be higher because there is less air to fight with (less dense, warm air expands).
We did the following excercises during this flight:
Steep turns with 45 degrees bank angle
Stalls in clean, approach and landing configuration and also a descending turn stall in approach configuration to simulate the turn from base to final
Climbing and descending turns
Trimming and staying level
Four circuits
Landing the plane with some crosswind (~5 knots)
The final two landings went good but because of the crosswind somewhat traversing. All with all a great lesson with some progress and I now have passed the 20 flight hour mark and 65 landings which is a great setup for phase 2.
Remarks
As always, I have some remarks for the next lessons and flights:
More flying on visuals and nose attitudes
Better coorperation between rudder and ailerons during landings, especially in crosswind
End of the page 🎉
You have reached the end of the page. You can navigate through other blog posts as well, share this post on X, LinkedIn and Reddit or return to the blog posts collection page. Thank you for visiting this post.
This category contains the details of my flight lessons in Phase 2, where you learn to fly good.
2.1 First Solo
In this lesson I performed my first solo flight ever and did some circuits as perparation. A great summary of this lesson is the day of becoming a pilot instead of a student.
This page can contain a collection of personal notes, steps to remember, finished and unfinished content. Please excuse brevity.
Do not use specific information given like fuel flow, landing/take-off distances for your flights. Always refer to the POH of your exact plane for flight preparation. My information is just for references that I used.
Introduction
Lesson number
Lesson name
Lesson date(s)
2.1
First solo
10-09-2026
Today was finally the day that my first solo flight took place on the Cessna 172 which is a very great experience after around 24 hours of being with a instructor at all times, you are the only one in control of the flight left.
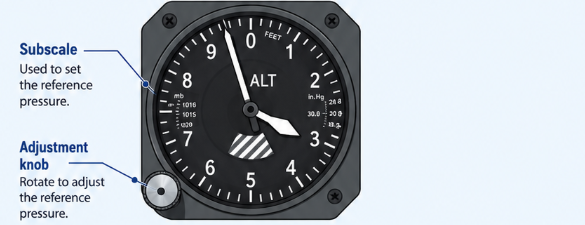
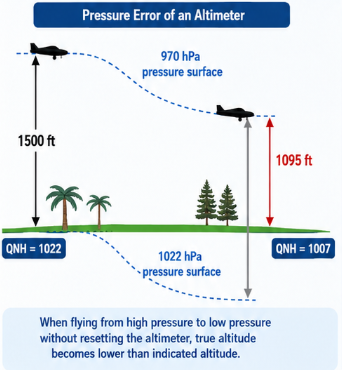
The weather was great flying weather, with around 4 knots of wind and a beautiful blue sky filled with some cumulus clouds here and there but nothing to worry about. The temperature was around 18 degrees celcuis and the pressure around 1020 hPa.
We first did some circuits to warm up, shape things up and getting a feel for how a solo flight will go today. After that we did the actual solo flight.
Medical Class 2
Before this lesson, I did my medical examination to gain the EASA medical class 2 certificate which is required to be in an airplane on your own. This was an overview of checking ears, eyes heart, helthyness, blood pressure and such. I succeeded good, so no problems there.
The circuits
Before I was sent off to perform my first solo circuit, we did around 5 circuits with a landing as final action. The circuits went okay with some remarks about the checks and actions which I will later dive into.
The landings were really good and I finally got myself at landing the plane good for at least 4 times in a row. The first landing was okay but with some traversing motion, but was a warm up for me after around 2,5 weeks of no flying. The round-out and flair altitude were really good and the touchdowns also. Every landing is different, which may sound stupid but you get to experience this while doing, this is really true.
After 5 circuits my flight instructor wanted to call it a day and the suprised me with “Hey, great luck man I’m out of here.” Haha.
The solo circuit
So the 6th circuit I had to perform was the solo circuit. I went from the taxiway back to the beginning of the runway, then took of to turn a circuit around the aerodrome and then land again.
When becoming a pilot, flying solo and having a feeling of accountability is very important and you gain this in the lesson program. When learning to drive a car, you will drive solo after getting the exam which is really different from flying.
Cool. So I lined up on the runway, took off and made 4 left turns to land the aircraft back on the same runway. The circuit itself went okay, with some remarks which I will describe separately and made an error in the radio call on downwind but nothing to worry about. The tower/ATC knew I did my first solo so they do expect not a perfect pilot and were really humble. They applauded for the landing and made a joke that my instructor never made such a good landing. Great people, haha.
After landing and parking the plane, I was awarded some applause and congratulations and awarded a water douche just as every other pilot over the world to celebrate the first solo flight.
Remarks Circuits
The remarks of the circuits with instructor are:
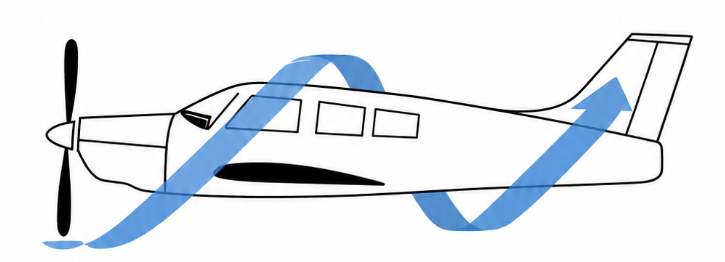
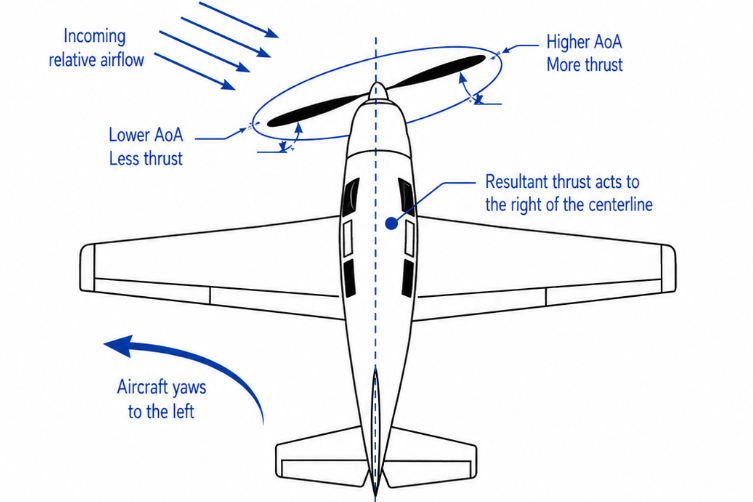
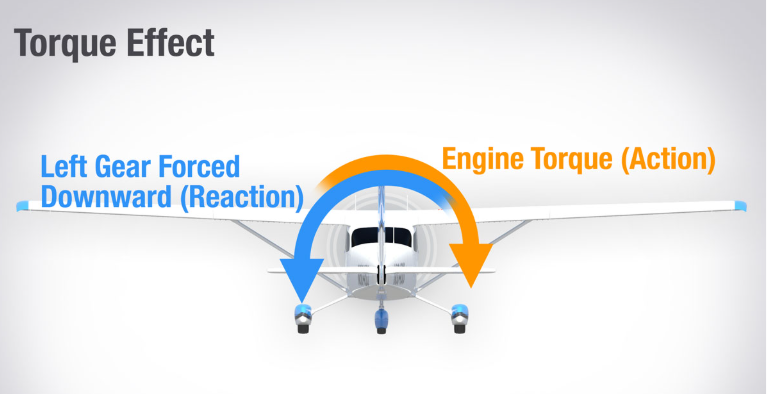
Remind the propellor slipstream, especially on final. When on high power, the nose goes to the left
Descending turns must be done with some forward pressure on the yoke. The upgoing wing will produce some lift and can cause a climb of the plane
So don’t climb in turns
Keep the approach speed on at least 65 knots, better some knots more than too less as this gives you more energy for the round out and flare
Try to keep back pressure longer during the flare to touch down at a lower vertical speed
During final till touchdown, keep feet straight on pedals to have good control over the direction and brakes. During touching and go, switch to heels on the ground to not make accidental brake inputs
Remarks Solo
As the first solo flight is a bit thrilling, this is a good cause of some minor errors so I will not point out everything I did wrong but will mention some room for improvement.
Think of the radio calls you make and make them sound right, I told ATC to make a touch and go instead of a full stop as we did around 40 touch and go’s at this moment, little bit of memory based
At rotation, let the plane gain some speed and keep 65 knots for the rest of the climb till 200 feet. From there you can switch to 75 with flaps up
What I did good on my solo flight:
Correcting the nose attitude during touch down, was a little too fast but corrected it with just the right amount of back pressure to make it buttery
Speeds, RPM, pitch and flap settings
The checks and restore actions
A great summary of this flight is is: great aviation and navigation, moderate communication.
End of the page 🎉
You have reached the end of the page. You can navigate through other blog posts as well, share this post on X, LinkedIn and Reddit or return to the blog posts collection page. Thank you for visiting this post.
This page can contain a collection of personal notes, steps to remember, finished and unfinished content. Please excuse brevity.
Do not use specific information given like fuel flow, landing/take-off distances for your flights. Always refer to the POH of your exact plane for flight preparation. My information is just for references that I used.
Introduction
Lesson number
Lesson name
Lesson date(s)
2.2
Forced landing 1
24-08-2026
Today we did the Forced Landing 1 lesson and exercises. The main objective is to have a landing plan and field within reach at any given moment as an engine can be failing unexpectedly. Training this procedure can save lives, not only of pilots but also from the passengers and even for people on the ground.
The weather was perfect today, with 3 knots of wind which is very calm. We also had almost zero clouds and minor to zero thermal/turbulence.
We skipped the first solo lesson for now, because I found the forced landing exercise important to have done prior to be alone in a plane and I still had to perform the medical assessment for the class 2 certificate which I will do after this lesson.
The Forced Landing exercise
The Forced Landing exercise is something flight instructors will do and then sometimes randomly cut the throttle to let the student pick a field and demonstrate how they would land there. Some basic information we must know:
Wind direction
Best glide speed is speed of minimal drag means highest gliding distance (somewhat slower decreases distance but increases time)
So basically from the beginning of the engine failure we have those 5 steps, where best glide speed and simultaneously looking for a field are the two most important steps.
Pitch for 65 knots (vGlide) and trim ~5 times for nose up which is down
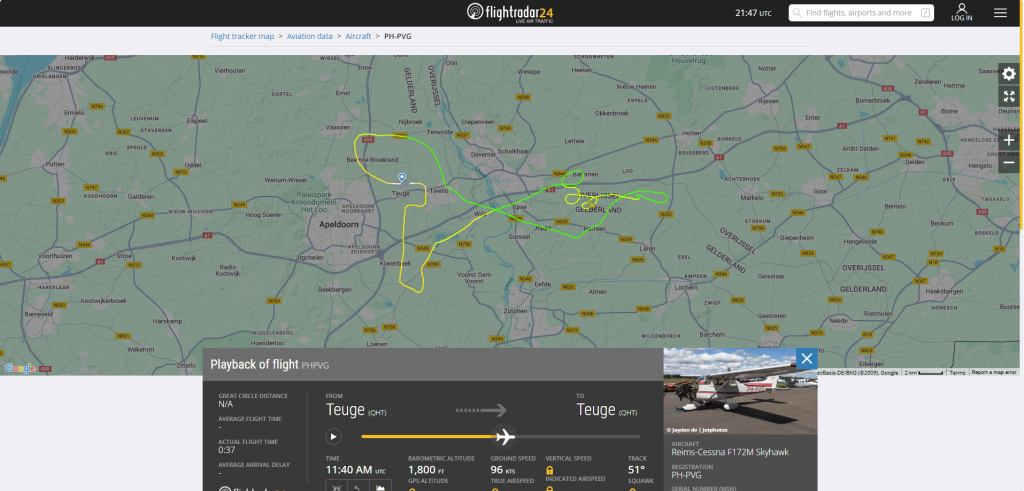
Check for possible causes in the cockpit
If engine doesntt start, you are commited to landing and should have a landing point by now
On the end of downwind set Flaps 10 and keep field in reach
Turn to base/final and set Flaps 30 for a steep descent and land the plane
Evacuate (if not simulated)
So suitable fields are fields that are somewhere about between light-green to yellow.
Dark green mostly means thick grown crops or sweetcorn for example
Earth-colored mostly means sand and wet earth
We did this exercise about 4 times, and the first time was more like a demonstration. Then I had the controls and it went allright with some room for improvement to get a better descent path but the plane could be landed at all attempts if done better. We will contintue exercising this in the following lessons till it will be done good to perfect, as this is one of the most important lessons.
After the forced landing exercises we also did 3 circuits where 2 of the landings went very great with a clapping instructor during the second landing, where you know you are on a great pace :)
Remarks
Altough I got an applause, this doesnt mean that everything went perfect of course. The remarks of this lesson are:
Better remember the memory items of the Forced Landings and better preparation on the forehand
Speed on final must be kept at 65 knots at all times all the way till the runway threshold
Better steering with the rudder during the round-out and flare
The centerline is not a holy grail which must be hit at all times, some feet of is no problem. Safe landings is number 1 priority so do not correct for this
End of the page 🎉
You have reached the end of the page. You can navigate through other blog posts as well, share this post on X, LinkedIn and Reddit or return to the blog posts collection page. Thank you for visiting this post.
In this second solo lesson, I left the circuit/airport area to fully fly standalone. Then I performed some simple exercises and re-joined the circuit to land safely.
This page can contain a collection of personal notes, steps to remember, finished and unfinished content. Please excuse brevity.
Do not use specific information given like fuel flow, landing/take-off distances for your flights. Always refer to the POH of your exact plane for flight preparation. My information is just for references that I used.
Flight lesson 2.3 - Solo 2
Lesson number
Lesson name
Lesson date(s)
2.3
Solo 2
28-09-2026
The flight lesson 2.3 with name Solo 2 focusses on basic flight procedures being alone in the cockpit. In phase 1 I learned how to fly, take-off and land the plane with some turns, stalls and recovery procedures baked in. In the first solo we break the seal of flying solo for the first time, without any form of help in the cockpit. The second solo flight is somewhat more complex and wants you to:
Take-off
Leave the circuit
Perform some 30 degrees and 45 degrees (steep) turns
Rejoin the circuit
Perform 1 or 2 touch and go’s
Make a full stop landing
This is really a very basic flight where most aspects will come into play, as well as every memory item, procedure and radio call must be performed. A great way to step up the game in solo flight.
The weather during this lesson
The weather during this lesson was great. We had a sky filled with some high level stratus clouds with some cumulus clouds under it. We got some half sunlight because of the layer of (also)stratus. The wind was somewhat variable but stable on our runway. No big crosswind challenges here.
Few clouds, of maximum 2/8 coverage on 7400 feet AGL
BKN190
Broken clouds, of maximum 7/8 coverage on 19000 feet AGL
22/15
Temperature 22 degrees celcuis, dewpoint 15 degrees, relative humidity 68%
Q1020
Air pressure calculated back to sealevel: 1020 hPa
=
End of METAR
First the lesson with instructor
As we are going solo with relative little experience and after a week of not flying, we will first do the lesson with instructor. Then he gets out and wishes me luck to repeat everything on my own.
With instructor, everything went okay. Some little remarks here and there like climbing in turns, speed too little and too less or much bank angle. No big deals. Then we did 2 circuits where I pulled off my best landing so far. We almost did not feel any touchdown and this is where I want to be at all landings. The landing after that, we had to make big turns because of other traffic, slow flying into downwind and base and resulting in us too high and a somewhat unstable landing. Could have been a go around.
Then my instructor got out and wished me luck to repeat everything.
Flying the Solo 2 lesson
I went back to the holding point of the runway and took off with no remarks. This went perfect and it amazes me again how much the plane wants to climb with the less weight without instructor. I climbed out of the circuit and left the circuit. Then I did the after take-off checklist on my own which is a strange experience, after doing this about 20-25 times with instructor.
I flew to a nearby village at 10 kilometers away to perform the steep turns. I decided to perform two turns, one over left and one over right.
To review the steep turn exercise a bit, we bank just like any other turn but at 30 degrees we add around 200-300 RPM and hold the plane on a specific altitude. In my case 1.500 feet. Both turns went great in my opinion, with the turn over the left I climbed around 50 feet in altitude. I corrected this in the right turn.
Then I went back to the circuit, and some traffic was already in the pattern. Therefore I left the circuit as my instructor has done also one or two times and rejoined with a big and sweeping curve.
In the circuit, everything went allright but my landings were a little bit too hard on touchdown. Both of them. I need to get the correct flare height and amount of yoke input somewhat better. My instructor saw the landings from half a mile and marked them as OK, but not perfect but I found them worse.
Remarks
Of course, Im a little bit of a perfectionist so every lesson has some remarks:
Getting the right flare height and amount of input
No altitude changes in turns, keep the plane on the desired altitude
End of the page 🎉
You have reached the end of the page. You can navigate through other blog posts as well, share this post on X, LinkedIn and Reddit or return to the blog posts collection page. Thank you for visiting this post.
This page can contain a collection of personal notes, steps to remember, finished and unfinished content. Please excuse brevity.
Do not use specific information given like fuel flow, landing/take-off distances for your flights. Always refer to the POH of your exact plane for flight preparation. My information is just for references that I used.
Flight lesson 2.4 - UPRT 1
Lesson number
Lesson name
Lesson date(s)
2.4
UPRT 1
06-10-2026
The flight lesson 2.4 with name UPRT 1 is an advanced flight lesson where we learn some Upset Prevention and Recovery Training (UPRT). This means we will be trained to recognize the plane getting in a spin or spiral dive and be able to recover successfully. Getting in those situations can happen, and be better prepared and know what to do than facing this and completely lose control.
2.5 Solo 3
In this third solo lesson, I left the circuit/airport area to again fully fly standalone. Then I performed some simple exercises and re-joined the circuit to land.
This page can contain a collection of personal notes, steps to remember, finished and unfinished content. Please excuse brevity.
Do not use specific information given like fuel flow, landing/take-off distances for your flights. Always refer to the POH of your exact plane for flight preparation. My information is just for references that I used.
Flight lesson 2.5 - Solo 3
Lesson number
Lesson name
Lesson date(s)
2.5
Solo 3
28-09-2026
The flight lesson 2.5 with name Solo 3 focusses again on basic flight procedures being alone in the cockpit. I already did one circuit solo in my first solo flight and did the steep turns solo and headed back. This lesson focusses more on airmanship and
Take-off
Leave the circuit
Climbing turn (15 degrees)
Descending turns (30 degrees)
Rejoin the circuit
Make a full stop landing (or touch and go if possible)
This is again really a very basic flight where most aspects will come into play, as well as every memory item, procedure and radio call must be performed. A great way to further step up the game in solo flight, as we have to make 10 hours of solo before getting a PPL license.
The weather during this lesson
The weather during this lesson was Okay, but somewhat deteriorating. We had a sky filled with some cumulus clouds with a layer of stratus above it, causing some light drizzle. The wind was somewhat variable but cross to our runway. No big crosswind challenges here, but something to take into account.
Few clouds, of maximum 2/8 coverage on 4100 feet AGL
SCT069
Scattered clouds, of maximum 4/8 coverage on 6900 feet AGL
BKN075
Broken clouds, of maximum 7/8 coverage on 7500 feet AGL
22/15
Temperature 22 degrees celcuis, dewpoint 15 degrees, relative humidity 68%
Q1020
Air pressure calculated back to sealevel: 1020 hPa
=
End of METAR
Flying the Solo 3 lesson
As the Solo 3 lesson was right after the Solo 2 lesson, the flight instructor told me the plane was free for 1,5 hours and the weather was okay. As I already drove to the aerodrome, it could be great to add another solo flight to this afternoon. I agreed and reminded the last winter where I got a spree of 5 lessons being cancelled.
So I stepped back in the same plane where I was 15 minutes ago. I proceeded to the holding point of the runway and took off with no remarks. After leaving the circuit, I climbed to 1500 feet while doing a right turn at 15 degrees of bank angle which already covers the climbing turn. On 1500 feet I stabilized and performed the after take-off checklist.
From 1500 feet, I climbed in a turn to the left to 2000 feet where I noticed the weather becoming somewhat worse in the west. I decided this can be a problem if being in the air for an hour but not for a very short flight of this.
At 2000 feet, I noticed some (few) clouds being not that much higher than me flying, worse than the METAR told us, so I decided to make a decending turn over right and stay at 1500 feet to be clear of the clouds. Then I saw the weather on the right becoming worse and decided to fly back to the aerodrome. Before entering the traffic circuit/pattern, I again had to descend and did this over left, so I did both exercises over the left and right side.
I re-entered the circuit with much less traffic this time and made a stable circuit with great turns. During the circuit my plan was to do one touch and go, but on the end of downwind, some rain started falling down, so I decided to change that decision to a full-stop. I also called out being on base as some traffic was already on the holding point, keeping them sharp and telling I’m inbound.
Then I landed the plane in a better way than in the Solo 2 flight, but room for improvement. After landing and parking the plane, an unknown man came to me and asked which flight I did and told me and my instructor that he was behind me and I was doing a great job. For me this made my day. Haha. Now back to the things that could be done better.
Remarks
Of course, Im a little bit of a perfectionist so every lesson has some remarks:
Getting the right flare height and amount of input
No altitude changes in turns, keep the plane on the desired altitude
More focus on actual flying as radio calls and procedures get more natural now. Example, being on final and the radio is busy? Land the plane, and dont wait to make the call. Aviate, Navigate and then if time left; communicate.
Happy with both lessons on one day. Now it feels like I’m really make some progress, especially when both flights are solo flights.
End of the page 🎉
You have reached the end of the page. You can navigate through other blog posts as well, share this post on X, LinkedIn and Reddit or return to the blog posts collection page. Thank you for visiting this post.
This page can contain a collection of personal notes, steps to remember, finished and unfinished content. Please excuse brevity.
Do not use specific information given like fuel flow, landing/take-off distances for your flights. Always refer to the POH of your exact plane for flight preparation. My information is just for references that I used.
Flight lesson 2.6 - UPRT 1
Lesson number
Lesson name
Lesson date(s)
2.6
UPRT 2
06-10-2026
The flight lesson 2.6 with name UPRT 2 is an advanced flight lesson where we learn some Upset Prevention and Recovery Training (UPRT). This means we will be trained to recognize the plane getting in a spin or spiral dive and be able to recover successfully. Getting in those situations can happen, and be better prepared and know what to do than facing this and completely lose control.
2.7 Solo 4
In this fourth solo lesson, I left the circuit/airport area to again fully fly standalone. Then I performed some more advanced exercises like slow flight and approach to stalls and full stalls and re-joined the circuit to land.
This page can contain a collection of personal notes, steps to remember, finished and unfinished content. Please excuse brevity.
Do not use specific information given like fuel flow, landing/take-off distances for your flights. Always refer to the POH of your exact plane for flight preparation. My information is just for references that I used.
Flight lesson 2.7 - Solo 4
Lesson number
Lesson name
Lesson date(s)
2.7
Solo 4
12-10-2026
The flight lesson 2.7 with name Solo 4 focusses again on basic flight procedures being alone in the cockpit. In this lesson, I’m supposed to perform these exercises at least:
Take-off
Leave the circuit
Performing Slow Flight in clean configuration (60 knots)
Performing Slow Flight in landing configuration (50 knots)
Perform a approach to stall in clean configuration
Perform a approach to stall in landing configuration (Flaps 30)
Perform a full stall in clean configuration
Perform a full stall in landing configuration (Flaps 30)
Rejoin the circuit
Make 2 landings
Make 1 flapless landing
The weather during this lesson
The weather during this lesson was beautiful, with some minor winds but an overall clear blue sky with some small cumulus clouds. The wind was variable and this was the only risk to take into account
The METAR of a close aerodrome stated:
METAR XXXX 121225Z AUTO 14008KT 090V250 9999 NCD 15/06 Q1020
METAR information
Explaination
AUTO
Automatically generated by weather station
14008KT
Wind coming from 140 degrees at 8 knots
090V250
Variable wind between 090 and 250 degrees
9999
Visibility of 10 km or more
NCD
No clouds detected (best condition on automatic weather stations)
15/06
Temperature 15 degrees celcuis, dewpoint 6 degrees, relative humidity 40%
Q1020
Air pressure calculated back to sealevel: 1020 hPa
=
End of METAR
As the runway is headed 080 (runway 08), we can expect a pretty 8 knots of crosswind which I will describe at the end of this lesson in detail.
Flying the Solo 4 lesson
We started the lesson with a quick briefing of all the exercises that needed to be done. I got a list on paper which I could check off when in the air and flying the exercises step by step which I did. We first did 3 circuits to refresh the feeling of controlling an airplane again, which is a great thing I want to keep in the rythm for now.
The first landing I was too hard on touchdown and a little ballooning, resulting in myself deciding to go around which my instructor agreed on. The second landing was much better as I refreshed the good altitude to flare on and almost went butter smooth. On the third landing, we decided to try a flapless landing as this is also an exercises that needed to be refreshed. Flapless landings will be done at much higher speed, needing way more runway. On our case twice as much as our speed was a little high but the landing itself went great.
Then the instructor got out and I was out there alone in the plane, again. Yay.
The solo exercises
I will dive deeper in all the exercises I had to do, and will write down what went good and what can be enhanced further to learn from this experience. I took off, left the circuit and climbed to 2.500ft. This is a good altitude for performing stalls and slow flight, and I wanted to be on a nice and round number. After I left the aerodrome circuit, I also connected to the flight information services (DutchMillInfo) to have that experience once again.
Slow Flight - Clean
I started the Slow Flight exercise by doing it in the clean configuration. This means getting yourself at your desired altitude and keeping that altitude while flying in a higher angle of attack. To fly slowly, we need less thrust but to counter-act the loss of lift, we need to set the angle of attack of the wings higher. Then we increase the engine RPM to about 1800 RPM and keep in a steady 60 knots and I kept the plane at 2.500ft. The aileron controls become really sloppy at low speeds, almost doing nothing so directional control must be done with the rudder.
Slow Flight - Landing
Directly after the clean configuration slow flight I did the Slow Flight in the Landing configuration which is at 30 degrees of flaps. This amount of flaps increase our lift but also increase drag. This slows us down, being able to fly somewhat slower without stalling. In the landing configuration we can fly at around 50 knots, which is around 90 km/h. This sounds fast but being up in the air, it looks like you are going like 20 km/u.
On a scale of 1 to 10, I give myself an 8/10 for these Slow Flight exercises. It went great, but could have done better at keeping the airspeed steady, which fluctuated between 55 and 65 knots in the clean configuration at first but stabilized good by setting the correct pitch attitude and RPM.
Approach to stall - Clean
In the approach to stalls I flew at almost the critically low airspeed. This can be seen as a very unstable slow flight, changing into a stall if not corrected. In the approach to stalls in clean configuration, we have to fly at around 50 knots which is the end of the green arc and recover from this situation when one or more of these sympthoms happen:
Buffeting, aerodynamic shaking
The stall horn telling us that a stall is imminent
End of the green arc
Approach to stall - Landing
In the approach to stalls I flew at almost the critically low airspeed. This can be seen as a very unstable slow flight, changing into a stall if not corrected. In the approach to stalls in landing configuration which is flaps 30, we have to fly at around 40 knots which is the end of the white arc and recover from this situation when one or more of these sympthoms happen:
Buffeting, aerodynamic shaking
The stall horn telling us that a stall is imminent
End of the white arc
I think that the approach to stalls exercises went great, in both cases the stall horn was the first sympthom to happen and corrected it by only unloading the wings. My instructor told me to try and recover the stalls with only the pitch attitude which we done earlier in the stalls lessons.
I give myself a 10/10 for these exercises. I needed some time to think of anything I could done better but sometimes you do something exactly as intended and this was one of that cases.
Full stall - Clean
In the full stalls I needed to deliberately worsen the pitch attitude, resulting in a full stall. We don’t have symthoms anymore telling us that a stall is coming, we are in a stall and direct action is needed.
Symthoms of a full stall in are:
Wing drop
Nose drop
Altitude loss
So I started setting the engine to idle, still at 2.500ft and pushing to keep it at 2.500ft. The airspeed quickly drops all the way to around 50 knots and the stall horn beeped like crazy. In the stalls lesson I accidentally wanted to recover drops with the ailerons as natural reaction. So during the exercises I kept telling myself, no aileron, no aileron, no aileron and this worked. However, I flew in a Cessna 172 and those are sometimes almost impossible to get in a full stall. I eventually got the nose to drop and where I found this somewhat scary during the actual lessons, I was laughing at how many input was needed to get the nose to drop.
Full stall - Landing
In the full stalls I needed to deliberately worsen the pitch attitude, resulting in a full stall. We don’t have symthoms anymore telling us that a stall is coming, we are in a stall and direct action is needed.
Symthoms of a full stall in are:
Wing drop
Nose drop
Altitude loss
So I started setting the engine to idle, still at 2.500ft and pushing to keep it at 2.500ft. The airspeed quickly drops all the way to around 40 knots and the stall horn beeped like crazy again. I again told myself, no aileron, no aileron, no aileron. Eventually the nose dropped again, and the work on the rudder was good in my opinion. Great thing in those exercises is to have a outside reference point, which was some reflection about 30 miles away. The only thing you need to do is keep that in the same spot and your directional control will also be good.
I repeated this exercises about 2-3 times to get the hang of it, and I give myself a 8/10 for these exercises. Directional control was great, but some room for improvement at keeping the same altitude. I fluctuated between 2.400 ft and 2.700 ft but was good on the recovery actions where I did not lose too much altitude where I did at the stalls lesson some experiences ago.
Small break
As I had to fill a remaining time window of 20 minutes from my previous lesson, I had to add this time to my lesson today if possible. After the exercises I took a small break of around 10 minutes, descending to 2.000ft and enjoying our beautiful country from above. This was one of the major reasons to fly airplanes anyway. I made a large circle, just to head back to my starting aerodrome and going back to full business, as making circuits can be quite exhausting after a few. Much checks, RT calls and stuff to be done in short time while also keeping other traffic in mind.
Landing(s)
After the small break I headed back to the circuit joining point after announcing I’m inbound. I completed the circuit with no problems all the way to final. However, on Final I noticed that the winds were somewhat stronger than before, making a landing a bit harder. I got to the ground and exactly the same as in the first landing of today with instructor, I made a bounce, ballooned too much and needed to go around. I felt somewhat stupid but after an hour in the air it can happen. Maybe correction was enough but better safe than sorry.
Then I circled the circuit, repeating all checks and procedures as learned and again, on final I experienced some windshear causing the airspeed indicator to fluctuate a lot. When almost on final I was a bit high and the wind working against me so I went around without even touching the ground.
Third attempt then, noticed the winds coming from a 80 to 90 degrees angle and with variable speed, so I decided to use flaps 20 instead of 30 and to add 5 knots on every speed known, so 85 on downwind, 80 on base and 70 on final. Less flaps gives us less drag resulting in more speed, and less attacked by the winds. I touched down and it looked promising at first but did not apply the full crosswind correction, where the wind almost pushed me of the runway. As in a flash I anticipated that I couldn’t make it back on the runway without major inputs I again decided to go around.
Then I did a fourth attempt where I got to the runway, again with flaps 20 and corrected for the crosswind in an OK manner but not enough. I again ballooned too much as I did not correct for the higher speed I got, something we did not actually practice much. After ballooning too much I though touching down too hard and went for another, 4th go around. This seems very stupid, but I see this as assessing the situation, trying some things and then combining all the good things into an approach which works.
So, here I go on the 5th attempt. I thought in myself of a gameplan:
Crabbing on final
Flaps 20
Crosswind correction, winds coming from the right (left rudder, right aileron)
Flare as long as possible but not too much nose up input
And then I pulled of a (in my opinion) great landing, even with 8 knots of crosswind. I made a small bounce but the second touch was perfect and I rolled out all the way to the end of the runway. My instructor told me that the landing itself was very good. After coming to a stop and having some landings left to do, I finished the lesson myself as landing in 8 knots of crosswind is relatively hard without experience.
So altough I could have done much better, I could have seen and felt the crosswind the first go around and have done better on the second landing. I think the story is two sided, maybe the crosswind was a little to hard on a fourth solo flight but I could have done better myself but was a little bit suprised by the windshear on final.
I want to split the grade into two:
Landings: 4/10
Decision making: 7/10
Altough you can always experience slightly different situations as predicted and measured by nearby weather stations, this was a good lesson for me. Do a better assessment of the situation and how to fly it correctly. I skipped the other landing and flapless landing as I was somewhat happy to be on the ground. I and my instructor agreed on taking more crosswind landing lessons when the situation is again like this.
2.10 Precautionary landing
In this lesson we performed the Precautionary landing exercise, performed when in minor trouble like fuel problems, leaks, end of daylight period or a sick passenger on board.
This page can contain a collection of personal notes, steps to remember, finished and unfinished content. Please excuse brevity.
Do not use specific information given like fuel flow, landing/take-off distances for your flights. Always refer to the POH of your exact plane for flight preparation. My information is just for references that I used.
Introduction
Lesson number
Lesson name
Lesson date(s)
2.10
Precautionary landing
21-09-2026
In this lesson, we performed the Precautionary Landing exercise. This is a separate exercise from the other lessons we did till now, and focusses on to land the aircraft in a moderate controlled way outside of any aerodrome but in a field. As we still have our engine, primary and secondary flight controls, we are less dependent on those critical factors.
Causes of you having to perform a precautionary landing are often to save lives without any aerodrome in range while still having an engine and flight controls:
Fuel miscalculation or suspected fuel leak
Sick passenger on board
End of daylight period and/or planned aerodrome(s) closed
Lost in the vicinity, no contact with GPS, other aircraft
Unplanned weather deterioration, or getting not suitable for VFR conditions
The weather during this lesson
Today we had a great day for flying in terms of visibility, clouds and precipitation but the winds were very variable. We had a variable wind between 230 degrees and 020 degrees, and about 7 to 11 knots. The METAR of a close airfield, which are the actual measures reported this:
METAR XXXX 211355Z AUTO 30010KT 230V020 9999 SCT041 19/09 Q1030=
Let’s extract this information:
METAR information
Explaination
AUTO
Automatically generated by weather station
30010KT
Wind source: from 300 degrees (to 120 degrees) with a speed of 10 knots
230V020
Wind variable between 230 degrees and 020 degrees
9999
Visibility: 10 kilometres or more
SCT041
Scattered clouds (3/8 to 4/8 coverage) at 4.100 ft above the ground (AGL)
19/09
Temperature (19) and dew point (09) in degrees celcius (52% humidity)
Q1030
Air pressure at sea level: 1030 hPa
=
End of METAR
Enough about the weather, let’s dive into the exercise.
The exercise explained
So the Precautionary landing exercise is somewhat different from the Forced Landing exercise, as we still have our engine and our primary/secondary flight controls. As we have this, we can make a landing in a much safer way than just putting it what is within our gliding range and wants us to first do an inspection run of the chosen field.
During the inspection run, we will fly at a constant speed of around 70 knots and count how long it takes from start to end of the field. This tells us by a rule of thumb how long the field is so we can decide to land there. We check the following things during this run:
Time from start to end
Trees, power lines
Field material (softness, condition)
Cattle/animals
Objects at the start and end of the field
Other possible risks
Info
As we can count the time from start to end at around 500ft, we can use this rule of thumb to get an indication (not exact) of the available landing distance:
Indicated airspeed : 2 x seconds = distance traveled
__
This means, traveling 100 knots in 10 seconds is 500 meters, 62 knots in 20 seconds is 620 meters. The amount of knots devided by 2 is meters per second.
The exercise looks like this, where I have added the several steps:
So we fly 2 circles around the field, first to inspect and then to prepare and land like a normal circuit. Then we perform a soft field landing. On the last downwind, we could make use of our radio capability to inform the tower or flight information services that we need medical assistance. This can result in having that assistance minutes earlier.
Remarks
So we have performed this exercise around 3 times in this lesson. It went not perfect but also not bad. I chose the right fields to land on, preferably into the wind which gives us less ground roll. The first time, I was not perfect on speed with flaps 20 and with 10 knots of wind so I was corrected. The second and third time were much better and the third time actually having a good approach to the field with good speed.
After 3 times, we headed back to the airfield for 3 circuits with crosswind with okay landings but crosswind flying and landings are a good training area as this requires much more precise flying.
End of the page 🎉
You have reached the end of the page. You can navigate through other blog posts as well, share this post on X, LinkedIn and Reddit or return to the blog posts collection page. Thank you for visiting this post.
This lesson is not a real flight lesson but a grounded theory lesson on how to navigate properly using different checkpoints on a map and be able to write and maintain a navlog/flight plan.
This page can contain a collection of personal notes, steps to remember, finished and unfinished content. Please excuse brevity.
Do not use specific information given like fuel flow, landing/take-off distances for your flights. Always refer to the POH of your exact plane for flight preparation. My information is just for references that I used.
Flight lesson 2.12 - Navigation Ground School
Lesson number
Lesson name
Lesson date(s)
2.12
UPRT 2
06-10-2026
The flight lesson 2.12 with the name Navigation Ground School is a non-flying lesson but a deep dive into how to navigate using checkpoints. We can see this as a practical extension of the PPL Theory for Navigation which I passed around a year ago (https://flightblog.justinverstijnen.nl/ppl-theory-nav/)
Navigation goals
The goal of this lesson is that I am prepared to do on my own:
Choose a good and recognizable navigation plan with nav log with obvious points on the ground
Actually being able to perform the planned route
Reconsider the route at any checkpoint in case of being lost or diverted
Perform the flight planning with fuel, mass and balance calculations and take-off/landing distances
The Navigation Log
The navigation log which we will fill with our checkpoints and maintain during flight looks something like this:
Meaning
Route / Remarks
Write the checkpoint here with possible radio frequencies
Safe Altitudes
Safe altitudes, between MOCA* and possible upper limits
Flight Time - INT
Interval flight time (Checkpoint time)
Flight Time - ACC
Accumulated flight time (Total time)
ETO
Estimated time to Overhead Checkpoint
ATO
Actual Time Overhead Checkpoint
RETO
Rectified ETO, used when ETO and ATO has a big discrepancy
ALT
The planned altitude, if deviated we can add an arrow pointing up or down
The first point must be the departure aerodrome and the last point the arrival aerodrome.
Navigation Log - Filled
Gegeven
Checkpoint 1
Checkpoint 2
Checkpoint 3
Checkpoint 4
Route / Remarks
Safe Altitudes
Flight Time - INT
Flight Time - ACC
ETO
RETO
ATO
ALT
CH
DEV
MH
VAR
TH
WCA
TT
Distance - INT
Distance - ACC
TAS
WIND
GS
Fuel - USED
Fuel - REM
To be continued…
PPL Theory
This category contains pages about Private Pilot License theory.
Some content can overlap over multiple subjects, this is because they are important in each context and we need to know as much aspects as possible about them to fully understand.
Flight Planning & Performance (FPP)
This page contains my notes for the Flight Planning and Performance exam, where different aircraft performace calculations are described.
This page can contain a collection of personal notes, steps to remember, finished and unfinished content. Please excuse brevity.
Do not use specific information given like fuel flow, landing/take-off distances for your flights. Always refer to the POH of your exact plane for flight preparation. My information is just for references that I used.
Introduction to Flight Planning and Performance (FPP) (1)
Before we step into an airplane we are required to know the aircraft performance in our particular situation. We can ask ourselves questions like:
How much runway distance do we need for take-off and landing?
How long does our climb phase take to our cruising altitude?
What will our cruising speed?
What will be our fuel usage?
What will be our gliding distance?
Now these are not questions we will guess or something but we carefully calculate using numbers and graphs from the pilot operating handbook (POH) of our particular plane type.
In this module we will dive deeper in these questions and look at how we can make these calculations.
Air density
The air density is a unit of how much air molecules a certain part of the air contains. We will pronounce this as kg/m³. In the International Standard Atmosphere which is the baseline reference for our pilots, the definition of this is at mean sea level that one cubical meter air (1000 liters) weighs 1,225 kilograms. So 1,225 kg/m³.
Air density is determined by a few factors like air pressure and temperature and derives from the general gas equation:
Air Pressure (P): the air pressure in Pa (hPa x 100)
Gas constant (R): this is a ratio between pressure, density and temperature. We mostly use the number 287 for this, the ratio for dry air.
Air temperature (T): the air temperature at your airfield or cruising altitude in Kelvin, which is degrees celsius + 273.
Density (ρ) = P / (R x T)
An example calculation using todays numbers:
Info
METAR EHLE 031055Z AUTO 24010KT 9999 FEW016/// BKN019/// BKN022/// 18/14 Q1010 TEMPO 6000 -SHRA SCT018CB BKN022
Pressure: 1010 hPa x 100 = 101000 Pa
Gas constant: 287
Air temperature: 18 degrees celcius + 273 = 291
101000 : (287 x 291) = 1,209 kg/m³
This tells us that today the air is less dense than ISA, meaning we can expect worse aircraft performance. A result of the less density is the higher temperature (18 degrees instead of 15 according to ISA).
Density Altitude
To make this calculation somewhat easier for pilots to make, we have something called the Density Altitude. This is an altitude indication of how your aircraft will perform according to ISA. This makes these calculations much easier as we talk in altitudes instead of density like 1,225kg/m³. For example, if the density altitude is 3000ft we can expect performance as we are on 3000ft. This doesn’t mean we are actually on that altitude but is the altitude corrected for the actual air density.
Every 1c degree deviation of ISA temperature, we take 120ft as rule of thumb. If the air is colder than ISA this is a negative number, resulting in a lower altitude as the air is more dense. To calculate the density altitude we use the following formula:
Pressure altitude + (ISA DEV x 120) =
In the Netherlands, this density altitude often doesn’t make huge differences, but in countries with high elevations this can make huge differences in flight performance. Especially if you don’t take it into account. Let’s make up an example of Sedona Airport in the USA, the training airport when playing Microsoft Flight Simulator.
Info
METAR KSEZ 032035Z AUTO 03008KT 9999 CAVOK 37/16 Q1018 NOSIG(corrected for European readers)
As this airport has an elevation of 4825 ft, we are a huge portion away from sea level. The airport also is in the rocky mountains range making the temperatures huge.
To calculate density altitude, we need the pressure altitude first. This is the “ISA” altitude corrected for active air pressure. This is 4825 - 150ft = 4675 ft. As we have 5 hPa higher air pressure than ISA this is a little win. Now the density altitude.
37 degrees - 15 = 22 degrees of ISA deviation.
4675 + (22 x 120) = 7.315 ft Density altitude, which is almost 3.000ft higher
Mass and Balance (2)
The weight of an aircraft is a key factor to determine the flying performances. With the weight, we can calculate almost every V speed and the distance required for climb, take-off and landing. An aircraft is designed to operate in a specific weight range because exceeding this would result in unflyable planes with performance and controls not working as intended.
The key point here are:
Mass: The weight force, at 1G this is equal to the weight but increases or decreases if G forces do
Balance: The center of gravity point which must lie within limits
Why calculating Mass and Balance is being so important is partly described in this video, where the center of gravity of the plane shifted fatally to the aft part of the plane: https://www.youtube.com/watch?v=hvZEr3IkLJI
As mass and weight are mostly the same (if not talking about G forces), I continue to use the word weight.
Weight limits
We have two primary reasons why planes have maximum weights where they are certified for:
Structural limits: An increase of weight means the planes’ stressing factor is also increased, like the design-load.
Performance limits: The performance of planes are heavily dependent on the weight, like take-off and landing distances but also the V speeds like stall speed, best climb speed, glide speed etc.
Aircraft manufacturers use these terms to indicate the limits of weight for their aircrafts:
Limit name
Abbreviation
Description
Maximum ramp weight
This is the overall maximum weight of the plane excluding calculated taxi-fuel. This is the limit of air plane before even moving to the runway.
Maximum take-off weight
MTOW
This is the maximum weight the aircraft can be at take-off. Above this weight the forces must work really hard, exceeding structural limits where the plane is not designed for.
Maximum zero-fuel weight
MZFW
This is the maximum weight of the aircraft excluding usable fuel.
Maximum landing weight
MLW
This is the maximum weight at landing. When landing, the full weight of the plane must get on the ground, possibly harder than needed. This often results in the maximum landing weight being lower than the take-off weight.
Exceeding these weights will result in the plane being classified as un-airworthy.
When performing fuel and weight calculations and realising that we cannot take-off from a runway with a certain mass, you must re-do your calculations in terms of weight and fuel. To lower the amount of runway needed, you need to decrease the weight.
Determining the weight
To determine an aircrafts weight, we have to calculate the actual weight of an aircraft. This is basically a sum of all known weights.
Weight name
Abbreviation
Description
Basic empty weight
BEW
The basic weight of a plane without usable fuel, including unusable fuel. It also includes structure, engine etc.This is a number weighed by the maintenance company (CAMO). My training Cessna 172 for example is more or less 700kg.
Crew and passengers weight
POB
The persons’ weight of every pilot and passenger combined. Sometimes its better to “overguess” than actually asking people ;).
Baggage weight
The weight of the baggage.
Fuel weight
The weight of the usable fuel which we calculate based on the type of fuel.
The sum of all those weights give us the actual of gross weight and will decrease during flight as the fuel is being consumed.
Fuel weight
We calculate the weight of the fuel in our plane by picking default numbers based on the fuel we use. This is based on fuel density where we calculate the volume multiplied by density:
Density of AVGAS/MOGAS/Car gasoline - 0,72kg/liter or 6lg/USG
To calculate fuel, we have different categories where we use different parts of fuel. We must have enough fuel on board for the complete flight, possible diversion and even more than that. As fuel calculations are very important we determine the amount using these terms:
Fuel category
Used for
Taxi fuel
Taxiing to the runway excluding taxi after landing
Trip fuel
Take-off, climb, cruise, descend, approach and landing
Reserve fuel
Three types of reserve fuels needed in some situations
Contingency fuel
(+~5%) Fuel for unforeseen circumstances like wind, deferring routes, holding patterns
Alternate fuel
The fuel needed from destination to alternate including go around at destination, climb, cruise, descend, approach and landing on alternate.
Final reserve fuel
The minimum fuel that must be on board after landing. VFR flights this must be at least 30 - 45 minutes. This may also never be touched.
Extra fuel
All extra fuel on board for possible connected flights or flights to aerodromes without fuel station.
Block fuel
The total amount of fuel when departing from your parking place/ramp.
We base the forseen fuel consumption on the numbers of the pilot operating handbook.
Center of Gravity
The center of gravity (CG) is the central point of the gravity force. This point must be between the boundaries of the plane, as this has effect on the aircrafts performance. This center of gravity in general aviation aircraft is often determined in numbers of inches from a reference point. This reference point is called the “datum”. The reference point are mostly:
The firewall (wall between engine and cockpit)
Forward point of the fuselage/propellor
Wing leading edge
The pilot operating handbook will describe what the datum of your particular plane is. This point must be the same for that same aircraft at all flights.
Here I created a mass and balance sheet for a Cessna 172 in my second flight lesson, fully within the technical limits of the aircraft.
Normal category flights must stay within the red lines
Utility/aerobatic flights must stay within the grey dotted lines
This states what the forward and after limits of the plane are in terms of center of gravity and how much weight we may carry. The whole flight, your weight and balance must be within the performance envelopes. This is the red area on the graph above.
To calculate the mass and balance, note all weights like done in the picture above and lookup the CG locations of your plane in the POH. Then its simply a multiply-sum where the weight must be multiplied by the CG location which gives the moment-number -> the resulting turning effect. Always use a method with a table and graphic to be sure about your aircrafts limits.
Weight, Arm and Moment
To determine the center of gravity the moments are very important. We will talk about this three terms here:
Weight: The force applied by an object due to its mass and gravity
Arm: The distance from the reference point or pivot point to the line of action of the force
Moment: The resulting turning effect produced by a force acting at a distance from a reference point or pivot point
Arm and moment in picture.
During the flight, the center of gravity always will shift somewhat because of thefuel consumption. This effect can be bigger when the tanks are further away from the center of gravity. When having wingtanks, this effect is small but be aware to stay within the envelope of the mass and balance scheme. This is also the reason we always calculate the zero fuel weight.
Take-off and landing performances (3)
Calculating take-off and landing performances is crucial to us pilots as we want to know if we can land on a particular airport and runway with particular circumstances. To overcome shortage of runway, we calculate the distance we need according to the numbers in the POH. As the weather is never completely the same, we use the International Standard Atmosphere as reference point.
Take-off distances
The take-off consists of 2 different phases:
Take-off run/Ground roll: The first part where we power the engines to create enough speed and lift to get of the ground.
Initial climb: The first climbing phase where we need to clear an altitude above the ground (AGL) of 50 ft or 15 meters.
In the middle of the whole take-off we have Vr speed which we start rotating to get in the air. This is the aircrafts’ designed speed when taking-off is possible. We also know a Vlof speed which is the speed the plane comes loose of the ground, which is mostly close to Vr speed. We use this speed often in soft field take-offs to quickly get off the ground and win speed using ground effect.
Available take-off runway lengths
Determining the take-off performance is part of flight preparation. The needed distances must fit within the available distances at that time. We use three different terms to indicate the available runway length:
Take-off run available (TORA): The distance available for the the take-off run.
Take-off distance available (TODA): The distance available for the take-off run and climb to 50ft.
Accelerate-stop distance available (ASDA): The distance available for a rejected take-off.
In the most simple cases, these three values are exactly the same, but this is not always the case.
Stopway and Clearway
Much airports around the world have additions to the runways for safety and ease of use. The 2 categories are:
Stopway : A paved (verhard) addition to the runway only used for rejected take-offs (ASDA)
Sometimes on bigger airports this contains EMAS.
TORA + Stopway = ASDA
Clearway : A clear-of-objects addition to the runway which can only be used for the climb to 50ft (TODA). This can also be sand or even water.
Sometimes, the stopway and clearway are combined as the image below states.
Landing distances
We devide the landing phase into two phases:
Airborne distance: This starts at a distance of 50ft above the runway till touchdown
Landing ground roll: Begining from touchdown all the way till the plane has come to a complete stop
The landing distance is therefore calculated starting from that 50ft point all the way till the end of the ground roll. The landing distance available (LDA) is the distance from runway threshold till the end of the runway which can be found in the AIP. Some airports have a displaced threshold where the runway doesnt start at the beginning of the runway material.
The part before the threshold can be used for the take-off but not for landing. This does also count for a stopway and clearway.
There are multiple factors influencing the take-off and landing distances which are:
Weight (Take-off weight)
Wind
Density altitude (density of the air, Dense = more lift)
Approach-speed (landings)
Runway state (Dry, Damp, Wet or Contaminated)
Runway slope
Flaperons (Flaps)
Weight (Take-off weight)
An increase of weight requires us to make more speed, therefore increasing the take-off distance. As the weight factor increases, we also need to produce more lift and also requiring in a higher speed (Vlof). You can find the impact of weight on the take-off distances in the POH.
A rule of thumb we can use in general aviation aircraft is: an increase of 10% weight extends the required distance with 20%.
When landing, the weight will also increase our landing distance. More weight means a longer distance to stop that kinectic energy. More weight sometimes results in a higher approach speed. When landing after a flight, we have less fuel so also less weight. This lowers the gross weight. A good best practice is to use the take-off weight for your landing calculation, so you calculate with the numbers from the start.
Wind
The wind also is a major factor in take-off distances. As an aircraft uses air masses to fly through, we get more of that air by flying into the wind, having Headwind. Therefore increasing our TAS and decreasing ground speed, resulting in needing less take-off distance.
Headwind -> less ground speed: Decreases take-off and landing distances
Tailwind -> more ground speed: Increases take-off and landing distances
To give an indication of the differences check out the picture below, altough with headwind we will be able to reach a much steeper climb:
Density altitude
The density of the air is also an important factor of the take-off and landing distance required. As we know, the density of the air is a factor in the lift formula:
Lift = 1/2 ρ V² CL S
1/2 ρ V²
CL
Surface
The dynamic pressure of the incoming airflow (TAS)
Lift Coefficient
The surface of the wing
The Rho (ρ) describes the density of the air. Altough the Rho and Airspeed are somewhat related as they both are in this formula:
If density (ρ) decreases, Airspeed (V) must increase
If density (ρ) increases, Airspeed (V) can decrease
Factors which influence the Density altitude and so our distances, which can obviously be a combined factor:
High temperatures, warm air expands having less room for air molecules per m³
Low air pressures due to high elevation or low pressure areas
In general aviation aircraft, the pressure altitude is enough as the tables and graphics in POH’s already contain this correction for temperature.
The approach speed is often referred as the stall-speed multiplied by 1,3. In some cases we need a higher approach speed than normal, like when having more weight, flapless landing or weather conditions like gusting winds.
Runway state
The state of the runway is also an important factor for our required distances. The state is determined by three parameters:
Runway material: Paved, Grass, Sand etc.
Runway contamination: Dry, Damp, Wet and Contaminated
Runway action: Number between 1 and 6 where pilots determine the brake-action score
As the surface of course is also a factor on our total needed distance for take-off and landing. A grass runway has a longer ground-roll than a asphalt runway for example.
Slope
A slope in the runway, especially in mountain-rich area’s is also a major factor in take-off and landing performance. This slope is described in a percentage. This percentage is based on the difference between elevation of the threshold and end, divided by the runway length multiplied by 100. If this is a difference of more than 2 percent, this will be mentioned on the airport-charts and AIP.
Taking off while going up on the slope results in a slower take-off needing more of the distance. Taking off downslope results in a shorter distance as gravity will help us gaining speed.
Flaperons (Flaps)
When performing short-field or soft field take-offs, flaps are recommended to use. Flaps increase lift, needing less runway for lifting off. This also decreases our ground roll, but increases some drag on our plane. This will result in a less steep climb-out and slower climb speed. We mostly retract them at around 200ft AGL.
Track and Crosswind components
Winds can be divided into two different components when flying an aircraft:
Track wind component: The wind directly on your track (wind is determined from the source)
Crosswind component: The wind that comes from the sides, setting you on a different track
Sine and Cosine
The sine and cosine are trigonometric functions to calculate a value of an angle.
Cosine (X) represents the horizontal side of the angle divided by the hypotenuse
Sine (Y) represents the vertical side of the angle divided by the hypotenuse
In aviation we mostly use the much easier version described above, but now you have seen the theory about these two functions.
Calculating Take-off and landing distances based on tables
To calculate and determine our take-off and landing distances, we need the numbers from the pilot operating handbook (POH) of the plane. Hiere all numbers are described in the two phases of take-offs and landings:
Ground roll
50ft off the runway before landing or while climbing
For all of those calculations the numbers in the POH are the base numbers, or minimum required in best conditions based on the actual pressure altitude according to ISA and a selected temperature. On top of those numbers we add factors like described, which can look like these:
Take-off
Penalty description
Increase basic required take‑off distance
Every 100 ft aerodrome elevation above AMSL
+1%
Every °C above OAT
+1%
Headwind (per knot)
−1%
Tailwind (per knot)
+20%
Runway slope (uphill, per 1%)
≥ 5%
Grass runway – dry
+25%
Grass runway – wet
+30%
Soft ground
≥ 25%
Snow
≥ 25%
Gravel
+7%
Flapless take-off
+60%
Generic take-off penalty (Always applies)
+25%
This prevents discovering at 45 knots that the runway is too short. Worst‑case thinking is essential.
Landing
Penalty description
Increase basic required landing distance
Every 100 ft aerodrome elevation above AMSL
+0.5%
Every °C above OAT
+0.5%
Headwind (per knot)
−1%
Tailwind (per knot)
+20%
Runway slope (downhill, per 1%)
≥ 5%
Grass runway – dry
+30%
Grass runway – wet
+38%
Soft ground
≥ 25%
Snow
≥ 25%
Gravel
+7%
Flapless landing
+60%
Generic landing penalty (Always applies)
+43%
As we can see, much factors can determine the distances and basic required is almost never possible. However, these are summed up easily and including all factors while POH’s will offer you tables like these:
Calculating take-off distances based on graphs
A skill we need to posess is calculating take-off distances using these graphs. An example can be found here:
The variables used are:
Runway temperature: 25°C
Airfield elevation: 2500 ft
Pressure altitude: 2041 ft
Density altitude: 3731 ft
QNH: 1030 hPa
Headwind: 5 KT
Take-off weight: 2150 lb
Flaps: 25 degrees
We start at the left, co-relating the temperature to the pressure altitude. This corrects the pressure altitude to the actual outside temperature (hey the Density altitude). Then we shift from there in a straight line to the weight coloumn. We pick the first line there and follow that to the actual weight. Then from that weight we set a straight line to the wind component. As we have 5 knots headwind, our take-off distance will be decreased so the line has to go down. We join the first downward line to take some margin into account, leaving us with a total take-off distance of 1640ft which is 500 meters.
You can also parralel the lines but this approach gives us some extra margin.
Performance during cruise (4)
During the cruise phase, which means we are flying horizontal and level flight with constant speed, all forces of flight are in balance:
Lift equals weight (L=W)
Thrust equals drag (T=D)
Added to these forces is the first law of Newton, stating that an item which contains no net force, will be still or in a one-pairing movement.
Lift and weight have different application points. Lift on the pressure point of the wings and weight on the center of gravity. However, lift and weight are a pair of forces, causing the plane to be nose-heavy. This pair is compensated by the tail-heavy pair thrust and drag. The sum of the force-pair must be 0, which results in a horizontal and level flight. However in practice, there is not a complete balance between the forces. The remaining pair is compensated by the horizontal stabilizer.
Flight performances
To determine flight performances we have multiple definitions available which all have their own meaning:
Endurance: The time which a plane can be in the air with the available fuel (duration), meaning we fly at the lowest fuel usage per hour and at low RPM
To fly for max endurance, fly V max endurance
Range: The distance which a plane can fly with the avialble fuel (distance), meaning we fly at the lowest fuel usage per kilometer/mile.
To fly for max range, fly V max range
Radius of action (Actieradius): The distance the plane can fly with the fuel and also return back to the starting point
Cruising performance factors
The cruising performance of an aircraft is determined by factors like:
Wind
Flaps
Weight and Balance
Altitude
Outside Air Temperature
Wind
The wind will only affect the range, not the duration of the flight. As we know the E6B flight computer by now, we now that when wind comes from behind, the wind helps us get to the destination faster and headwind will slow us down:
Ground speed = TAS + tailwind (lower Vmax range)
Ground speed = TAS - headwind (higher Vmax range)
If we want to fly max range, we must fly with tailwind. This brings us further on the chart. If flying both A–B and B–A routes, the negative effect of headwind is greater than the positive effect of tailwind.
Flaps
Flaps increase the parasite drag and require more engine RPM, decreasing the range and endurance. We mostly will not use flaps in cruising conditions.
Weight and Balance
The weight and balance will influence the endurance and range in their own ways:
More weight means needing more lift, also needing a higher AoA but this will also increase induced drag and ultimately needs more thrust to counter-act
A frontal center of gravity must be compensated by the horizontal stabilizer by a downward lift-force. This must be counter-acted by more lift on the wings, increasing drag, increasing thrust
A AFT center of gravity will result in less drag and needing less thrust
Air density
At higher altitudes, we have less air density. However, we need more engine RPM to fly with less air density. Less air density also means less air molecules hitting your wings and less lifting force. We must have more true airspeed (TAS) to compensate for this and this will cost more engine RPM.
Performance calculations
To make a navigation-plan we must calculate the needed fuel consumption including cruise speeds in TAS. In the POH of the aircraft you can find tables, telling you exactly the fuel consumption in different scenarios which you can use for the calculation.
The biggest factors are:
Density altitude (pressure altitude + temperature factor)
Engine RPM setting
Manifold pressure in constant speed propellor planes
Then we reference the tables in the POH for the actual numbers. Some general rules and guidelines to use these tables for your calculations:
Pick numbers between altitudes/temperatures if actual numbers are not available
Expect worse than needed
Round off to the worse side rather than to the best side
The BHP is the gross crank-shaft power
Fixed Pitch propellor
For Fixed-pitch propellor planes like the Cessna 172, this table looks like this:
Let’s dive deeper into how to use this table for your fuel caulculation:
We pick 7 USG/h according to the table, which is the in between for 2000ft 7,2 USG/h and 4000ft 6,8 USG/h. As the fuel cosumption gets less with higher temperatures, I stick with 15 degrees for ease and to calculate the worse numbers. Then we calculate the usage per minute to multiple it with the amount of minutes:
7 USG/h : 60 minutes/h x 130 minutes cruise time = 15,16 USG fuel usage in 2 hour and 10 minutes in these conditions.
Constant speed propellor
For Constant speed propellor planes like the Cessna 208 Grand Caravan, this table looks like this:
Let’s dive deeper into how to use this table for your fuel caulculation:
We pick 8,92 USG/h according to the table at the standard/ISA section The difference between ISA’s 8,8 and 20 degrees less is 0,3 USG/h, so let’s pick 0,3 and divide it with 20 to get the USG difference per degree. Then we multiply this with 8 for our actual temperature deviation, meaning we need to add 0,12 USG/h to our ISA hourly usage (8,8 + 0,12 = 8,92). Then we calculate the usage per minute to multiply it with the amount of minutes:
8,92 USG/h : 60 minutes/h x 110 minutes cruise time = 16,35 USG fuel usage in 1 hour and 50 minutes in these conditions.
You see, sometimes we must interpolate the numbers on the scale or pick the worse numbers for the overview.
Performance during climb and glide (5)
During a straight climbing flight with a constant speed, we have a balance in forces. The weight of the plane is always vertically pointed to the middle point of the earth. The lift-force always points perpendicular to the incoming air flow and up into the air. Higher pitch also means a tilted lift force.
In climbing flights we have a split into two weight components:
L=G1
T=D+G2
During climb the lift is smaller than the weight, because G1 is less than G. This lift shortage is compensated due to the thrust is slightly upward, adding a vertical component. This added upward component results in needing some less lift.
The thrust factor must not only compensate the drag but also a part of the weight. The weight also go a component on the longitudal axis in the same direction of the drag force.
Climb performance
The performance must be determined according to two criteria:
Climb angle: This is the angle in degrees of how steep the plane climbs (on digital cockpits like the Garmin G1000 this are the lines on the screen)
The climb speed in feet per minute (ft/min)
The climbing angle can be calculated with this formula:
sin = thrust - drag : weight
The climb angle is so the difference between thrust/drag and the weight. We also can determine the angle of climb in two different ways:
Climb angle : The angle of climb relative to the incoming airflow
Flight path angle : The angle relative to the ground
With no winds these two numbers are equal, but with a lot of headwind, the flight path angle becomes smaller meaning a steeper flight path. With tailwind, this angle will be more flattened.
The climb gradient is the transition of the climb seen over a certain distance, like over a nautical mile. If we climb 1000ft per nautical mile (6076ft), we climbed 16% of a nautical mile in a minute. (1000 ft / 6076 ft × 100 = 16,46%)
The climbing speed/rate of climb is the vertical speed of a plane. This means as this is 1000ft, we will be 1000ft higher if maintaining that vertical speed for a minute.
Green: Vx speedRed: Vy speed
Climb performance factors
The climb angle and rate of climb doesnt have static values but are determined by these factors:
Air density
Weight
Flaps
Extended/Retracted landing gear
Wind
Bank angle
Let’s describe them all.
Air density
The air density is determined by air pressure and temperature, as we already know by now.
High air density means high air pressure and good aircraft climb performance
Low air density means low air pressure and worse aircraft climb performance
The engine and propellor will perform worse with lower air pressure, as there are less air molecules to move and use to fly through. We also generate less lift, needing a higher AoA to maintain a certain amount of lift. Just enough to counteract our weight.
When climbing, we eventually hit a upper altitude limit of the plane. At that point, we climbed so much that the aircraft structure cannot generate more lift and thrust to get higher. For a Cessna 172 this is around 13.000ft. We know two certain limits:
Theoretical ceiling: 0ft per minute (0 ft/min) (fpm)
Practical ceiling: 100ft per minute (100 ft/min) (fpm)
These numbers are the result you can read on the vertical speed indicator when close to the limits. As we can almost never hit the actual ceiling, the practical ceiling is also the service ceiling described in the POH of the aircraft.
Weight
As we also already know, more weight means we need to generate more lift which therefore means more induced drag. This results in a lower rate of climb. When the plane becomes lighter after burning some fuel, the climb performance will be better.
Flaps and landing gear
Flaps and an extended landing gear will increase the parasite drag of the plane, which then will result in a slower rate of climb and a higher engine RPM.
Wind
Winds will influence the flight path angle and the climb gradient:
Headwind: Less groundspeed and higher climb gradient
Tailwind: More groundspeed and lower climb gradient
The wind only does change the speed opposing the ground, and as we can travel more or less distance to the ground, the gradient will be different.
Bank angle
As we bank, the lift vector will also tilt, needing more lift. In turns we will use some back pressure on the yoke to counteract this. In turns with a constant speed, you will notice a speed drop as result of extra drag. In climbing turns we use a limit of 15 degrees which is a nice compromise between climb speed, loss of some lift and turn speed.
Forces while descending
The forces of flight while descending are somewhat similar to climbing but then reversed. The gravity (G2) force gets a little thrust component and helping us to gain speed. This is why we descend with almost no power. During descends, the lift force ia slo a lot smaller because the negative AoA.
Forces while gliding
The forces while gliding, so with zero engine power, are slightly the same as descending, but we don’t have a small thrust power left. We have only some thrust left in the form of weight. This is why we sometimes call:
Altitude : Potential energy (more altitude can be converted into speed because of this)
Speed : Kinectic energy
Glide performace
During gliding flights, in most cases during an engine failure, we have two parameters to measure the gliding performance:
Glide angle
Glide gradient
In practice, we must immediately pitch to gain and maintain our best glide speed: Vbg. In a Cessna 172 this is around 65-68 knots. The point of minimum drag and most lift, the bottom part of the total drag curve. We want to keep as much options possible and therefore increasing the gliding distance is crucial for the options to land our aircraft. Maintaining the Vbg speed means that we have the smallest gliding angle opposing the ground.
Glide performance factors
The factors which can influence our glide flight are:
Indicated Airspeed (IAS)
Wind
Flaps/Landing Gear
Weight
Wind
Winds are very important when aiming for the highest gliding distance. We want to get tailwind, so we take advantage of the wind gaining more distance. When we actually want to land, then headwind is more favorable.
Headwind: Decreases glide distance
Tailwind: Increases glide distance
Flaps/Landing gear
Flaps and the landing gear will increase the parasite drag of the plane. Keeping those extended will therefore decrease our gliding distance significantly. We need to keep these retracted as long as possible.
Weight
The smallest gliding angle will be reached while maintaining one certain AoA, the one with the maximum L/D ratio. The angle however says nothing about the speed. More weight means an increase in the Vbg (best glide speed). A heavier plane therefore keeps a higher airspeed, meaning in reaching the surface faster.
End of the page 🎉
You have reached the end of the page. You can navigate through other blog posts as well, share this post on X, LinkedIn and Reddit or return to the blog posts collection page. Thank you for visiting this post.
This page contains my notes for the Principles of Flight (POF) exam. This contains various subjects like lift, aircraft performance and why an aircraft flies.
This page can contain a collection of personal notes, steps to remember, finished and unfinished content. Please excuse brevity.
Do not use specific information given like fuel flow, landing/take-off distances for your flights. Always refer to the POH of your exact plane for flight preparation. My information is just for references that I used.
The air is best described as “thin water”. We humanity live on the floor of the air-ocean.
The atmosphere (1)
The atmosphere is the layer around the earth, which is around 100 to 200km from the ground up. Worldwide, we use the International Standard Atmosphere which is a mean set of conditions which will be somewhat different depending on the weather conditions, location etc. This is a mean of the conditions at 45 degrees north latitude.
In the standard atmosphere, we use these characteristics:
0ft is at the mean sea level
The air density is 1,225 kilograms per cubical meter
The air pressure is 1013,25 hPa (millibar) or 29.92 inches of mercury (inHg)
The temperature at sea level is 15 degrees celsius
In the troposphere, the temperature decreases with 2 degrees celsius for every 1000ft up (2 degrees per 300 meters)
The tropopause is at 36.000ft (11km) and the temperature is -56,5 degrees celsius
The troposphere and stratosphere contains 78% carbon dioxide (co2) and 21% oxygen
This is a set of conditions, but some numbers can defer in the real world, due to the location or different seasons. Now, lets take a look at the different layers in our atmosphere:
Layer
Altitude
Characterstics
Temperaturegradient(ISA)
Thermosphere
280.000ft and up 85km and up
Thin air and high temperature due to solar radiation. Auroras happen in this layer
Increases with altitude
Mesosphere
160.000ft - 280.000ft 50km - 85km
Meteors burn up in this layer, coldest layer
0c to -90c
Stratosphere
36.000ft - 160.000ft 11km - 50km
Contains the ozone layer, stable air with some jet streams at the bottom
-56,5c to 0c
Troposphere
0 - 36.000ft 0 - 11km
Bottom layer at the ground of earth and where weather/clouds take place
15c to -56,5c
This is a repeat of the information already learned in the Meteorology course. For more information, check out
Air Pressure
Air pressure is a result of the mass/weight of the air. Because there is so much air above the earth which compresses close to the ground, areas with a lot of air molecues will be created. You can see this as a tower of jenga you played before. The weight of all the bricks pushes on the lower layers of bricks.
On earth we have several high pressure areas and low pressure areas which are an result of temperature differences. High pressure areas always wants to go to low pressure areas, just like when you pump up a tire and let go the vent. The air from the high pressure area inside the tyre will go to the outside, low pressure area.
In high pressure areas: cold air falls to earths surface, and cold air has more air molecules
In low pressure areas: warm air from the surface rises, and warm air has less air molecules
So air pressure actually indicates the volume of air molecules in the area. The higher the pressure, the higher the volume of air molecules.
High pressure (H) and low pressure (L) areas are not absolute numbers, but relative to each other. For example:
979hPa (L) vs. 1013hPa (H)
1013hPa (L) vs. 1035hPa (H)
Air Pressure when elevating
When going up into the air, the air pressure will decrease like seen in the graphic below:
For reference, we will use this numbers:
Every 30 feet up in the air represents an hPa loss in air pressure
Example: 1013 hPa on sea level (0ft AMSL) means a mean pressure of 1000 hPa at 390ft altitude
As this is an exponential relationship, this will guide you through the first 10.000ft (3,048km) in altitude, after that this trick does not longer work correctly of course. Some good rules of thumb:
Pressure altitude is the altitude corrected to the International Standard Atmosphere, namely 1013 hPa (which is also called QNE). For performing take-off calculations, we will want to know how our plane performs which can be different with different pressures. This is a live indicator of being above or below earth’s standard atmosphere.
In short:
Higher pressures (Low altitiudes): Better engine performance, better propellor performance and more lift
More oxygen and more air molecules
Lower pressures (High altitudes): Less engine performance, less propellor performance and less lift
Pressure altitude examples
In an airport which mostly is lower or higher than mean sea level, there will be a small correction needed. For example, our airport is at 17 feet above sea level, and the actual pressure is 1032 hPa on sea level at a day with nice weather, the pressure altitude is -489 ft. This means our take-off performance will be better as we have more air molecules which is better for our engine.
In the same example with a pressure of 968 hPa on sea level, we will have a pressure altitude of 1238ft. This means our aircraft will perform as it takes off at 1238ft above sea level, which will have some disadvantages. As there is less air, we will need a longer runway, our engine performance is less and our lift will be less as there is less air. However, flying in relative high pressure altitudes is good for having speed, as drag decreases in lower pressure.
As you can already see, this example gives two completely different scenario’s with around 1700ft difference. In countries like the USA where airstrips can be at 5000ft altitude, the pressure can be a huge difference which we must take into account.
Now we know the pressure altitude, we need to correct it for Density altitude, because warmer air is thinner than colder air. This is because warmer air expands, just take a look at a hot air balloon. This means that on 5000ft pressure altitude and on a hot day of 35 degrees, the density altitude (also known as “performance altitude”) will be almost 9000ft. So we can expect our plane to behave as it is on 9000ft in normal ISA conditions.
Thinner air means less oxygen and less air molecules, denser air means more air for lift for both propellor and the wings. Less oxygen also means less engine performance but a higher true airspeed due of less resistance from air molecules.
To calculate the density altitude from pressure altude, you can use the E6B or the tool below:
Tip: Use an E6B calculator for a quick and thorough calculation of Density altitude based on the outside air temperature (OAT) and pressure altitude.
Fundamentals of Lift (2)
Lift (draagkracht in Dutch) is a component that keeps a plane in the air. This is the upward force that fights the gravity/weight of the plane. It works basically as the wind flows over and under the wing. As the air over the wing goes faster and under goes slower, it will combine at the end of the wing. Lift is also the component that will compensate for the weight of an aircraft (gravity). This means, how more heavy the plane is, the more lift it needs to produce to fly.
The two primary causes of lift are:
Pressure differences: under the wings the air pressure increases, wanting to go to the low pressure area above the wing
After the trailing edge of the wing, the air goes down, under the wing the air goes up
We can explain the air pressure differences induced by lift because of 2 elementary laws:
Law
Definition
Formula
The continuity law
A conserved quantity cannot disappear or appear spontaneously; it can only move from one place to another.In fluid flow, this means the amount of mass entering a system must equal the amount leaving it, as long as nothing is added or removed inside. That is why a fluid flows faster when it passes through a narrower section.
V₁ × A₁ = v₂ × a₂
Bernoulli’s law
In a flowing fluid, an increase in speed is accompanied by a decrease in pressure, provided the flow is steady and friction losses are negligible.Bernoulli’s law explains how that increase in speed is related to a decrease in pressure. Compare this to pinching a garden hose.
Both laws describe that fluids (including air) in a narrow area will go faster and has a lower pressure. This helps us better understand how an aircraft flies.
How an airplane generates lift
Lift works basically with these 4 components:
Wind velocity: The more headwind (speed) you have, the more air and air molecules will hit your wing. This pushes the wing upward where the wind will then be directed to the ground and changes the velocity. Changing the direction and velocity of this wind has a reaction which is lift force.
Angle of Attack: The angle of attack is the angle of the wing hitting the wind. By default, planes have a little angle of attack of a few degrees but we can increase this with the yoke (steer) of the plane
Drag: The drag component is how much air resistance we have in a particular situation. The higher the angle of attack, the more drag and how harder the engine must work to compensate for it, which can evantually result in a stall
Lift force: The lift force is the resultant of the wind velocity, drag and the angle of attack and states how much the wing is pushed up
Let’s take these 4 components into a simple drawing:
The black line represents the chord of the wing. This is the same with the outline of a wing:
We also have the resulting air-force, which is a line 90 degrees of the wing profile, based on the oncoming wind.
Static and Dynamic pressure
For the example of Static and Dynamic pressure, I will stick to the example of a garden hose, pinched. This results in two things:
Static pressure (A): This is the air pressure in the hose which will decrease when narrow and will increase again after the narrow part is over
Dynamic pressure (B): This is the pressure of the water, the speed of the water, and this increases at the cost of static pressure
Take a look at this drawing, which makes more sense:
This basically works the same as the pitot-static system of an airplane, the static port measuring the static air pressure, as the pitot probe measures dynamic pressure. Inside of the measurement systems, there will be calculated the results which are Indicated Airspeed (IAS), Altitude and Vertical Speed (VS).
Dynamic pressure is measured with this formula:
“P = q = 1/2 ρ V²”
This means:
P: Total pressure
Q: Dynamic pressure
1/2 ρV²: Also dynamic pressure but explained granular
Bernoulli’s law states that for example water or air going into a narrow space at a certain speed, will also come out of that narrow space with that certain speed.
Air flow around a wing-profile
The air will flow around a wing-profile. Because of the leading edge of the wing, the incoming air will divert up and down, bringing the flow-lines closer together.
Just like the two laws already predicted, the airflow will increase and the static pressure will decrease. At the leading edge of the wing, the lines will be closer together. Here the pressure is relatively low. Near the trailing edge of the wing, the flow lines will be less close. The speed of the airflow decreases and the pressure increases.
Under the wing, the airflow will have to make a smaller angle and path, causing the air to move at a slower speed but at an higher pressure.
Upwash and Downwash
The upwash is an uplifting movement as result of the pressure differences. The leading edge of the wing needs to split the airflow. This point is called the “stagnation point”, the point of air coming to a small temporary stop and then leaded over or under the wing. In the picture below, you can see that the airspeed is 0 at the stagnation point.
The downwash is a descending movement of the airflow after it hit the wings. As Bernoulli’s law already stated, the dynamic pressure increases then the static pressure decreases, so the air above the wing goes at a faster speed.
Too see this all put into perspective, view this image:
Airspeeds are a reference
An wing profile described
A wing profile has various parts, which we will describe now:
Leading edge: The frontal part of the wing where the airflow first hit the wing
Trailing edge: The aft-part of the wing where the airflow leaves the wing
Chord: The imaginable line from leading edge to the trailing edge
Camber line: The camber line which is the skeleton-line, is a line which is in the middle of the top and bottom
Camber: The maximum distance between the camber line and the chord
Thickness: The maximum distance between top and bottom. This will sometimes be referred as the “thickness-to-chord” ratio
Angle of incidence and Angle of attack
The angle of incidence (AoI) (Instelhoek) is the angle between the longitudinal axis of the plane and the chord. This is how the aircraft is built and is by design, so the plane generates enough lift in straight and level flight.
The angle of attack (AoA) (Invalshoek) is the angle between incoming airflow and the chord. This is the pitch angle you can set with the yoke, which controls the elevator.
The angle of attack will often be reffered as “α”. It also is an result of sum angle of incidence, the pitch angle and the glide angle.
Glide angle
The glide angle (baanhoek in Dutch) is the angle between horizontal and the flight path. The flight path is the path the center of gravity flies through the air.
The lift formula
The lift formula is an outline of the resulting airforce on a wing profile. Lift is dependent on these 3 things:
Dynamic pressure of the incoming airflow
The lift co-efficient
Wing surface
The formula goes like this:
Lift = 1/2 ρ V² CL S
1/2 ρ V²
CL
Surface
The dynamic pressure of the incoming airflow (TAS)
Lift Coefficient
The surface of the wing
So all these components work somewhat together to produce lift. This means the result of all must be positive, where one value can be less or more than another at certain parts of a flight. We will take a deeper look into the Lift components.
Lift terminology
To better understand lift, we have some definitions to look at as these definitions will be used in more explainations later on.
Definition
Definition (Dutch)
Explaination
Center of Pressure (CoP)
Drukpunt
This is the resulting force of the lift of the wing, which we can also call the center of lift
Stagnation Point
Stuwpunt
The point at the leading edge of the wing where the airflow is being separated and comes to a stop
Upwash
Opwaartse beweging
The ascending airflow after it hits the wing’s leading edge
Downwash
Neerwaartse beweging
The descending airflow after it left the wing’s trailing edge
This picture does shows how these terms work in both cruise and high angle of attack situations.
Dynamic Pressure
The dynamic pressure is the pressure of the free airflow just before the wings. 1/2 ρ V² altogether is a sum of static and dynamic pressure, where V² means only the dynamic pressure. The V factor is equal to the True Airspeed. Headwind is also counted within this V factor, which means that the more headwind, the more lift.
Static pressure in this formula is also very important. This is directly dependent on the static air pressure in the air you fly in. The higher the static pressure, the more lift. This also means that if we climb with a plane to about 34.000ft where the air pressure is about 25% of the pressure on earths surface, you will need much more speed to retain a specific amount of lift.
Lift coefficient
The lift coefficient is a sum of the angle of attack, amount of lift and drag. In a graph, this looks like this:
A fun fact is that because of the angle of incidence of a Cessna 172, a plane wil always have a higher angle of attack than 0.
This graph outlines that the more angle of attack we have, the more lift. However, there is a bount that this stops which is called the critical angle of attack. In a Cessna 172, this is around 15-16 degrees nose up. Pulling even more on the yoke causes the plane to stall and dip from the sky. This can be very dangerous at lower altitudes.
A high angle of attack results in the air not gluing anymore to the wing but to transform into rotor flows. To get a better view of what exactly happens:
Wing Surface
The wing surface is a factor that directly influences the lift of a plane. In the formula, this will be in the value square meters (m²).
How bigger a wings’ surface is, the more lift it can deliver. We can also do some things with our wings to produce even more lift as they increase the wing surface area. Think about:
Flaperons (flaps)
Slats (on airliners)
We set flaps on take-off to produce more lift at a lower speed. This means we need less runway to take-off from. When landing, we use more flaps to create more drag and decrease the speed. Flaps help us in these parts of the flight to have more time, see the runway a lot better and to descend in a much steeper line.
Indicated Airspeed and Lift coefficient
Then in straight and level flight, there is a great connection between the speed and the lift coefficient. The lift equals the weight of the plane and the speed is higher than the amount of drag. However, if the angle of attack increases -> the lift coefficient will also increase. If preventing that the lift increases, the airspeed must be decreased.
A high speed needs a low angle of attack
A low speed needs a high angle of attack
Symmetric and asymmetric wing profiles
An Asymmetric wing profile is where the top of the wing has more camber, this is what most planes have
A symmetric wing profile is where the top and bottom of the wing are the same, mostly in aerobatic planes
This also means something for the lift coefficient and the angle of attack performances. For example, a symmetric wing profile will start with 0 lift coefficient. This gives it somewhat less lift than an asymmetric profile, as shown in this graph:
Red: Asymmetric
Green: Symmetric
Here an asymmetric wing profiles will eventually reach a lift coefficient at a negative angle of attack.
Three-dimensional airflow over a wing
The airflow over the wings looks like this in three-dimensional setting:
On the left, the airflow underneath and above the wing is illustrated and on the right we have the difference in pressure (Up = low and under = high). This difference in pressure will tend to flow to the wingtips. This movement actually causes the wake turbulence to happen. This movement however induces a decrease of lift and an increase of drag, induced drag, to be pronounced correctly.
Wake turbulence
Wake turbulence (zogturbulentie) is caused by lift, and will show as two opposing turning rotors behind the wingtips. This is an excellent example of Newtons third law in action, which states that for every action in the universe there is an opposing reaction. The force of the lift creates an reaction in the form of wake turbulence.
The reaction of two opposing wings will cause this wake turbulence. The strength of the wake turbulence is affected by the amount of lift the plane generates. A Boeing 777 will generate lots of lift to fight its huge mass compared to a Cessna 172 and so generates more wake turbulence.
A good advice is if taking of behind an airliner, to wait for at least 3 minutes for the wake turbulence to completely dissipate. Heavy wake turbulence can cause huge problems as the airflow for light planes will be disrupted.
The strength of the wingtip vortices are caused by the amount of ligt
The strength of the wingtip vortices are also caused by the angle of attach, where a higher angle of attack will generate more wingtip vortices
The wingtip vortices are the strongest during take-off and landing
An aircraft in clean configuration produces the most wingtip vortices
Wake turbulence will move the direction of the wind
The risks of wake turbulence
The greatest risks of wake-turbulence are:
Rapid roll-movements which will be so powerful steering against it will not be possible
Structural damage to the plane
Loss of height
Greatly reduced climb performance
Not enough lift at take-off (if taking of after a HEAVY aircraft)
Wing shapes
The shape of an wing from the top view is called the wing shape. We have mostly two types of wing shapes:
Straight wings
Tapered wing
These wings also have some more properties:
The wing-root is the part which is sticked to the fuselage
The end part of the wing is called the wingtip
The wing span is the total length of both wings from the wingtip of the left to the right wing
The distance of the wing leading edge to the trailing edge is called the chord as we already saw. Sometimes this chord is not a straight line. We then speak of a mean chord.
We can calculate the wing aspect-ratio using this formula:
Aspect ratio = Wingspan divided by (/) the mean chord.
Now the aspect ratio also helps producing lift. The higher this ratio, the more steep the lift-curve is. Take a look at this graph:
For reference, here a glider plane as a much steeper line than a fighter jet. This is like we already discussed, a result of the wingspan divided by the mean chord.
Wing surface
The wing surface is the total surface area of a wing. We calculate also the part above the fuselage, and is called the gross surface.
Drag (3)
Drag (weerstand) is the resistance of the air a plane flies through. Oncoming wind slams into the cockpit, leading edge wings and wheels and this partly slows us down. More information about this component will be discussed further in this module.
We can feel drag especially when on a bike and going really fast (25-30 km/h or higher). You feel alot of upcoming air which slows you down. This is the exact same on a plane.
To let an aircraft actually fly, the thrust component of the engine must be higher than the total drag at all times. In an horizontal flight, the amount of drag is equal to the amount of thrust, bringing you forward in a constant speed.
The drag formula
The drag formula is similar to the already discussed lift formula, and looks like this:
Drag = 1/2 ρ V² CD S
1/2 ρ V²
CD
Surface
The dynamic pressure of the incoming airflow (TAS)
Drag Coefficient
The surface of the wing
The only difference is that we replace the lift coefficient with the drag coefficient. This drag coefficient is also dependent on the angle of attack (AoA). More angle of attack means more drag, as the leading surface of the plane increases a bit.
The Drag co-efficient is the sum of Induced drag and Paraside drag combined, which we will discuss further:
Types of drag
We have two types of drag, which we can separate into two categories:
Induced drag (geinduceerde weerstand): Induced drag is caused by generating lift. When no lift is produced, no induced drag is produced either. We also can call this lift-dependent drag. This drag mostly happens at low speeds.
Parasite drag (schadelijke weerstand): Parasite drag (schadelijke weerstand) is another type of drag, which increases as the speed increases. We also call this speed-dependent drag. This drag mostly happens at high speeds.
Here again we see the third law of Newton into place; where a specific force is reacted with another opposing force.
Induced drag
So induced drag is produced and a reaction of generating lift. This is caused by the fact that the air over a wing has a lower pressure than under the wing. Because of this pressure difference and high pressure wants to flow to low pressure, some lift will leak away which causes some extra drag.
Induced angle of attack (AoA)
This air can also flow away to the wingtips, which causes some downwash behind the wings. This causes the incoming airflow to get a descending motion and causes the aerodynamic force to tilt somewhat. This also increases the drag component.
We can also have an induced angle of attack where the induced drag is counted from our effective drag.
Induced drag and speed
The induced drag is dependent on the lift as we already stated. The angle of attack also directly impacts this type of drag, where high angles of attack result in more induced drag. The induced drag also increases at low speeds and decreases at high speeds.
High TAS: low induced drag
Low TAS: High induced drag
Other factors for Induced drag
Some other factors that can influence the induced drag are:
Wing aspect ratio: The aspect ratio (ratio between wingspan and mean chord) has a great effect on the induced drag. A thin and long wing (glider) has a short tip and therefore less room for air leakage from under the wing to above the wing.
Wingtip construction: The construction of the wingtips are also influencing the amount of induced drag. An example is the Beech Bonanza V35 which has somewhat thicker wingtips where some fuel tanks are attached. This reduces the induced drag.
Ground effect: In the ground effect the aerodynamic properties of a wing will have a minor difference. As there is less air mass just above the ground (0 - 2 meters), there is less room for wing vortices and downwash. This has some profitable results for us: more lift and less drag.
Ground effect
Ground effect gives us more lift, and therefore also a steeper lift coefficient curve. Keep in mind that leaving the ground effect changes the profit back to normal. Ground effect is at its most at a half wingspan above the ground. At 10% of a wingspan, the induced drag will decrease with almost 50%.
We have to take this change in properties into account, especially with landing:
More lift means a slower descend or even some climbing
Because of the decreased drag the plane will glide for a longer distance
The decreased downwash will also decrease the angle of attach of the vertical stabilizer, making the nose descend a little
When taking off, keep this properties into account:
When climbing out of ground effect, drag increases and lift decreases making us dip a little
You can rotate with a slightly lower speed but you need ground effect to win speed to get to Vx
In soft field take-offs you can use the ground effect to eject early from the ground and then win speed in the ground effect
Parasite drag
Parasite drag (schadelijke weerstand) is another type of drag, which increases as the speed increases. This has nothing to do with producing lift.
Parasite drag can be divided into 3 categories:
Form drag
Friction-drag
Interference drag
Form drag
Form drag is caused by the shape/design of the aircraft. As the air flows upon the leading edge, the air will be separated and a pressure difference occurs. By this separation the airflow gets disrupted, building up a new pressure opposing the movement direction. This is called wake.
A brief description is; the more streamlined an aircraft part is, the better the air will follow that part. This will cause less separation and less wake.
A great illustration of this in action:
This is the reason planes like the Cessna 172 have wheel-fairings.
Friction drag
When air flows over a fixed surface, air molecules will be braked due to this friction. These slower molecules then will also be slowed down by the molecules farther away from that surface. The further the molecules are away, the less this slowing force is.
Even though air feels light, it sticks slightly to the skin of the aircraft. This creates a thin layer of slowed-down air called the boundary layer. The smoother and cleaner the aircraft surface, the lower the friction drag. Rough surfaces, dirt, ice, rivets, or exposed parts can increase it.
In the cruising phase of a flight, the most drag you feel is an result of the friction drag.
Interference drag
Interference drag is caused by the close placement of all airplane parts close together. All those different parts have their own airflow which can (partly) disrupt each others airflow. This often happens where parts join together, such as the wing and fuselage, struts and wings, or landing gear and body. The airflow becomes more turbulent in these junction areas, which increases drag.
To minimize interference drag, aircraft manufacturers apply fairings to different parts, like from wing to struts.
Total drag
The total drag of that we experience during flights is a sum of induced drag + parasite drag. We can see an example of this put into a graph:
Here we have in the middle a point where we have the least drag, this is where both amounts of drag are exactly the same. This is the V minimum drag (Vmd) speed. Often very similar to our best glide (Vg) speed, used to glide the most distance over a certain amount of distance.
Speed stability of the total drag
We have a graph to get a better understanding of the two parts of drag and your airspeed.
Red: Backside of the power curve, here is the plane not stable in terms of speed. A small decrease in speed means a increase in drag as the line is steeper. The speed will therefore decrease if not corrected with the throttle.
Blue: Normal operating area, here the plane is more stable in terms of speed. Light corrections will be applied automatically due to the higher speed.
Stall and spin flight (4)
A stall means exceeding the critical angle of attack. Stalling will occur when the plane has such a high pitch up momentum that the airflow is disrupted. The wing will instantly stop producing lift and the drag will increase substantionally.
Stalling does not neccesarily apply when flying at low speeds. When flying at a low speed, you need to pitch up to retain your altitude. There is a moment that the wings are so high up, causing a wing drop, nose drop or a heavy decrease of altitude occurs. This is a stall. But a plane can also stall when at its top speed, just because the airflow is disrupted.
In aerodynamic terms, we determine the cause of a stalling wing the behaviour of the boundary layer of the wing.
Boundary layer
The boundary layer (grenslaag) is the small layer of air which hits the wing surface. At the surface of the wing, the flow of air will be slowed down as result of resistance. At the surface, the air will even be completely still (no-slip). From the surface the boundary layer will span up to where the flow of air is not disrupted anymore.
A good picture of this happening in both laminar and turbulent air, check out this picture:
Laminar vs Turbulent
Laminar and Turbulent are each others complete opposites. Laminar beans that the air is very clean (organized) without movement, laminating the air over and under the wings. Turbulent means that this air is very unorganized which can happen by convection (rise of warm air), clean air turbulence or wake turbulence.
When the air is laminar, the following properties are:
All air molecules will move from left to right
Nice and orderly
In parralel lines from each other
Boundary layer separation
When flying at greater angles of attack, the boundary layer will eject from the wing. This separation will result in a loss of lift, and is caused by the pressure gradient from the leading edge of the wing over the top.
From the leading edge of the wing, the pressure drops to a minimum. The point where this minimum is reached is at the front of this wing. After the front the pressure will increase again where at the trailing edge of the wing, the pressure is equal to just before the wing.
After the point of minimum pressure, the boundary layer has to flow in the opposite way, which is not easy by nature. This will increase to happen if the angle of attack also is increases until the wing is in a complete stall. At this stalling point, the separation point has made all its way to the leading edge of the wing.
Info
A golf ball has some small dents in its skin. These have a very important cause, namely decreasing the size of the separation layer and so decreasing the total drag of the ball.
Effects of increasing AoA
The effects of increasing the Angle of Attack (AoA) are the following:
Stagnation point will change to the leading edge -> alerting the artificial stall warning of the Cessna 172
The static pressure on the top side of the wing decreases
At a asymmetric wing profile, the rpessure point will change forward to the leading edge at first but at hitting the critical angle back to the trailing edge
The lift coefficient increases and decreases rapidly after hitting the critical AoA
The drag coefficient increases slowly but very fast after hitting the critical AoA
The total drag decreases at a certain angle but increases at a higher AoA
Stall speed
When practicing stalls in a plane, we will close the throttle making the engine run stationary and keep our altitude. We do this because power-off stalls are less dangerous than power-on stalls. As we lose speed, we need to correct for it by increasing the angle of attack. All the way to the critical AoA. In the formula of lift coefficient, the lift-coefficient factor increases where the speed factor decreases.
Just for fun, here is the formula again:
Lift = 1/2 ρ V² CL S
1/2 ρ V²
CL
Surface
The dynamic pressure of the incoming airflow (TAS)
Lift Coefficient
The surface of the wing
You can find the stall speed (Vs) in the pilot operating handbook (POH) of the plane. V speeds are always referenced at the Indicated Airspeed (IAS), which is what you see on your speed meter in the cockpit.
For more information about stalls and my stalls lessons, visit this page:
There are some factors that influence the stall speed of the plane. Because the speed is not a hard value, especially in the atmosphere which can change from time to time, they are all calculated using the following properties and are worst case scenarios:
No flaps: Flaps help reducing the stall speed by around 5 knots on a Cessna 172
Straight and level horizontal flight
No engine power
Center of gravity is in the front position
The plane is at its maximum take-off weight (MTOW)
Weight
According to the lift formula, the lift factor must be equal to the weight factor to stay in the air. The lift factor must be higher if you want to climb. The POH always refers to the maximum take-off weight, so the worst case scenario here.
Womething which also is an option is to look at the ratio between weight and wing surface, which we call the wing loading:
Weight/Surface = 1/2 ρ V² CL
How more the wing loading factor is, the more the stall speed.
Load factor
The load factor is the ratio between lift and weight. We will pronounce this in simple numbers: in straight and level flight, this ratio is 1. When manoeuvering, like turns or climbing this ratio will increase. At an angle of 60 degrees while climbing the load factor will be 2.
We can make this load factor visible with a little addition to the lift formula:
Load factor x Weight = Lift = 1/2 ρ V² CL S
Here is described that the lift must not only be equal to the weight, but on the weight multiplied by the load factor. This makes clear that a change to the load factor has the same effect as on weight increase of difference.
For reference, here we have some numbers where we describe the load factor and increase of stall speeds in different turns:
Load factor
1
1,15
1,4
2
3,9
Increase in stall speed
0%
7,5%
19%
41%
97%
Info
Fun fact, the load factor is equal to the G-force.
Thrust
The thrust is the forward power the engine(s) and propellor(s) generates and will influence the stall speed in two ways:
Thrust increases the vertical power/component
Thrust increases the airspeed over the wings
At higher angles of attack, the thrust gets a upward component. The thrust reduces somewhat of the weight, where the lift decreases without stalling. The stall speed will get somewhat lower because of this when having full engine power.
Extra thrust on the propellor will also increase the flow of air over the inside - parts of the wings. The inside parts of the wings will get more air decreasing the stall factor there. This is great, as we keep control over the ailerons. However, when stalling, you must only steer with the rudder to avoid a spiral dive/spin.
Center of gravity
Another factor on the stall speed is the center of gravity. Ever tried to balance a straw on your finger? The point where the straw stays into plane without tilting to one of the sides is called the center of gravity.
In a plane we have also a center of gravity as we must be in balance. If the center of gravity is at the front section of the fuselage, the stall speed will increase. This is due to the extra correction the horizontal stabilizer needs to make to keep the plane level and this increases the stall speed. The POH refers to the most forward center of gravity possible while still inside of the Mass and Balance envelope as worst case scenario.
Turbulence
Turbulence is also a factor which can influence the stall speed. In turbulent weather, the wind speed and direction will constantly change. This results in a angle of attack which also changes in small differences. At low speeds with high angles of attack, a upward wind can pull the plane into the critical angle of attack, resulting in a stall.
Stalls in climbing or descending turns
When climbing or descending, the wings have both a different angle of attack. This difference occurs because the outside wing has a longer distance than the inside wing. Because both wings are vertically making the same distance, the flight path of the outside wing has a flattened curve.
In a climbing turn, the angle of attack of the outside wing is the highest. If the speed decreases, the outside wing will stall first. At a descending turn, the inside will stall first. This is the reason the turn from base to final in the circuit is the most dangerous turn, which is commonly flown with somewhat more speed and a less steep turn (around 20 degrees in a Cessna 172).
While climbing:
Outside wing stalls first
While descending:
Inside wing stalls first
Stall warning
When an aircraft is in a stall, the plane will lose altitude very fast and the plane can become uncontrollable. A stall warning is therefore very important, as this can (re)gain your attention. The stall warning sounds just before a real stall happens, giving you enough time to remediate the risk instead of fixing the stall.
We call it an approach to stall when a stall is around the corner but not fully developed. You can see this as the point in the lift coefficient curve where the line stops to increase.
Sympthoms of an approach to stall are:
Stall warning horn rings
Buffeting, this is an aerodynamic clue that the plane is about to stall where the drag of the separation layer takes over the lift making the aircraft shake somewhat
This effect is not that audible on a Cessna 172
It does on low-wing aircraft like Piper, Diamond Aircraft or Cirrus types
Airspeed too low
Controls becoming sloppy -> lower airspeed means lower air and less “grip”
We have two types of stall warnings on general aviation aircraft:
Electrical flapper
Underpressure horn
Both systems relatively work the same, where both will sound an alarm if the stagnation point will shift more to the underside of the leading edge because of the critical AoA. The electrical flapper works on electricity and is more or less a button which must be pressed up. Is the button pressed, then the alarm will sound. The underpressure horn is mechanical and works at all times, by sounding the alarm if air is sucked through it.
These alarms will sound in normal conditions, at around 5 to 10 knots prior to hitting the critical AoA. However, if dealing with ice build up on the wing, the wing will already stall before the alarm is sounded which makes this situation very dangerous. For more information about ice build-up, check out: the meteorology page.
Flight properties at a stall
A nearing stall has some downsides to the controls of the plane. If one of the wings will stall prior to the other, then this will result in a wing dip and also in a spral dive if not corrected. To help pilots with controlling a plane that is about to stall, aircraft manufacturers have some design improvements done to the wings.
Washout: Sometimes a wing is somewhat twisted by design, where the angle of incidation at the root is bigger than on the tip. This causes the root to stall first leaving enough air to still control the aileron at the tip. This difference is mostly some degrees. This also creates that buffet effect on the stabilo where a pilot is alerted about a nearing stall without any electrical or mechincal parts working
Stall strip: This is a metal strip on the leading edge of the wing which also causes the wing root to stall earlier than the tip.
Stall prevention and recovery
As we already discussed, a stall is caused by exceeding the critical AoA. To recover the stall, we need to minimize the AoA and so need to push the yoke forward.
An aircraft has also some features to recover itself aerodynamically:
Backward movement of the pressure point
Decreasing the AoA of the stabilo
The stabilo always has a smaller AoA than the wings. This is by design, so the pilot has elevator authority even at a stall of the wings. If the plane stops pitching up, the downwash of the wings will reduce also resulting in the stabilo to decrease its AoA.
Ice build up
Ice can build up on the plane on the ground and during flight, when the air is saturated enough and also under the freezing point. If having ice on the wings and you are still on the ground, do not take-off.
Ice will build up on mostly the leading edges of the wings, horizontal and vertical stabilizer and on smaller parts like the pitot tube and antennas. Even a small layer of ice can reduce lift by up to 50% and increasing drag by up to 100%. This because the friction drag is increases and this will influence the boundary layer.
In short, no flights if having ice on the plane.
Spins
During a stall the plane can roll. This roll movement can have different causes like propellor slipstream, turbulence or minor differences in the wings or plane shape.
Because of the roll movements the AoA of the descending wing will increase. As the wing is already stalled the lift will decrease with the result the roll movement will be enhanced and another decrease of lift. When in a stall, roll movements will not be silenced like in normal flight. This roll momement is called a wing dip.
A plane has some side-effects when controlling. If steering with the yoke to roll, some yaw is a side effect. If controlling the rudder to yaw, then rolling is a side effect because of the differences in drag and lift.
In a spin these movements will stay and this situation is called autorotation. The result of this is a downward spin flight or in short a spin.
Phases of a spin
The spin can be divided into three phases:
Wing dip: One of the wings dip because of a stall
Incipient spin: This is the first 1 to 3 rotations where the nose also dips and a spin is imminent if not corrected by the pilot
Developed spin: Here the plane has all its momentum to keep spinning, the airspeed looks low that this phase but the descending speed is very high
Spin recovery procedures
We can recover from spins safely if we have the altitude:
Recovery from wing dip
Opposite rudder to level off the plane
Unload the wings by pushing the yoke forward
Level off using the yoke
Recovery from fully developed spin
Close the throttle to not be sucked into the spin, this decreases aerodynamic forces on the plane
Ailerons neutral, keep them level
Full opposite rudder as your spin direction
Steer level
If the spin has stopped stop rudder input and pull out of the dive
As we already saw in the flight lessons of stalls, we must never use ailerons to get out of a stall. This makes a difference in the AoA of the ailerons making the situation even worse.
Spiral dive
A spiral dive looks similar to a spin but in a spiral dive there is no stall active. In a spiral dive the AoA is small at a high and increasing speed.
The spiral dive can occur when making a steep turn of 45 degrees or more to correct for a low pitch by pulling on the yoke. The nose will hardly rise and the turn will be tighter causing the nose to drop even more. The speed will increase in this situation.
To recover from a spiral dive:
Close the throttle to not be sucked into the spin, this decreases aerodynamic forces on the plane
Level the plane with the ailerons -> because of the high airspeed you have a lot of aileron authority because of the loads of air
Pull up from the dive
Aircraft Controls (5)
The movements of an aircraft can be defined using these three imaginary axis':
All these axis’ come together at the center of gravity of the plane. To put all effects and controls in a table including the dutch translations:
Axis
Axis (dutch)
Effects
Effects (dutch)
Longitudinal axis
Langsas
Roll
Rollen
Vertical axis
Topas
Yaw
Gieren
Lateral axis
Dwarsas
Pitch
Stampen
Primary Flight Controls
These effects and axis’ are primarily controlled by the primary flight controls:
Roll: Ailerons
Yaw: Rudder
Pitch: Elevator
All of these controls work similar. They change the camber (welving) of the wing or elevator. One of those controls in downward position means an increase of lift, where a upward position means a decrease of lift. It just changes how the air flows around.
If we look at the ailerons, we can see that they also change the wing’s angle of attack. As a result, the chord line tilts slightly, causing the aircraft to roll. On most aircraft, the ailerons are located near the tips of the wings. This is related to the moment arm: the farther they are from the fuselage, the less control force is needed to produce the rolling motion.
Side effects
Rolling is yawing
Yawing is rolling
These controls are not completely separated from each other. For example, if we only steer with the rudder, the plane will also roll. This is because the outside wing will produce more lift as result of the higher speed. A rolling effect will be felt and seen.
The other way around, if we only steer using the ailerons, then we can feel also a yawing motion. This is an result of the lift which now works from an angle. The incoming airflow hits the horizontal stabilizer under an angle getting a side-aerodynamic force resulting in a yaw towards the low wing.
The plane wants to get the nose into the wind. This is what we call the weathercock effect.
Hook effect
During a rolling movement the aileron of the upward wing will move down to create more lift. This also results in more drag. This extra drag results in the plane to yaw in that direction which is called the hook effect.
To help reduce this hook effect, aircraft manufacturers apply these design-additions to the ailerons:
Differential ailerons: Here the movements of the ailerons are not in sync. The upward aileron had a bigger movement than the downward aileron. This gives both wings an equal amount of drag suppressing this effect greatly.
Frise ailerons: These are constructed so the leading edge of the aileron will get some incoming air under the wing. This also gives both wings an equal amount of drag suppressing this effect greatly.
The remaining effect can be adjusted by steering with your rudder. This is what we do in the cockpits.
Effects on controls and airspeed
When the control surfaces (roeren) have more airspeed, the effectiveness (which we call authority) increases. As more air passes by over the control surfaces, it has more to make their movements. This is the same reason as why on lower speeds you need to do bigger steering actions.
The elevator and rudders exist in the slipstream of the propellor, so the effectiveness of these tail controls are also dependent on the engine RPM. Not only the airspeed, as on higher RPMs the propellor rotates a lot faster.
Influence of Engine RPM on pitch
The engine RPM also has influence on the effectiveness of the stabilizer controls. More RPM means a faster slipstream and a increase in downwash behind the horizontal stabilizer. If you increase RPM, the horizontal stabilizer will be pushed downward which increases the nose pitch. Decreasing RPM does the complete opposite, lowering the nose and increasing the horizontal stabilizer.
This is a design requirement for all planes; the nose must be going down after decreasing engine RPM to hold a specific speed. This prevents a unpredicted stall.
Mass balancing
The construction of an aircraft has a good flexibility and can deflect some during aerodynamic forces. If a wing bends downward because of turbulence, the aileron will be somewhat behind because of mass slowness and results in the wing pushed even further downward.
In the process of mass balancing, sometimes there are placed some small parts of metal in various places on the plane to ensure both sites are of equal weight. This decreases things like flutter which is an aerodynamic unbalance and can break an aircraft in seconds. This is always done in the section before the Vne speed, which is the Never Exceed Speed (160+ knots on a Cessna 172).
Aerodynamic balancing
Any of the control surfaces will pick an attitude which is level with the incoming airflow. To actually steer an aircraft, the pilot must win this incoming airflow by putting more force into the controls. In the factory, aircraft manufacturers apply some tricks on the airplanes to keep the controls into balance. One of the things on a Cessna 172 to achieve this aerodynamic balance in the controls is a horn balance. This is this part of the elevator:
Aerodynamic balance can be seen as powered steering in cars. They make the steering process a bit better, decreasing the change of flutter.
Trim surfaces
A plane also has some trim surfaces which are mostly controlled using a trim wheel in the cockpit The movements of this wheel corresponds with the movement of the yoke.
These are two types of adjustable parts of control surfaces to further enhance flights:
Adjustable trimming surfaces: These can be adjusted during flight to keep a plane straight and level
Balancing trimming surfaces: These can only be adjusted on the ground and mostly by the aircraft manufacturer
Trimming surfaces are so small parts of moveable control surfaces at the end of that surface. These can be set in a specific way, so the pilot doesnt need to apply forces on the yoke at all times.
For example, the Cessna 172 has a adjustable trim surface on the elevator. With this surface, we have a small part of the big elevator which can be controlled to stay in a desired position. This only controls the pitch axis.
This small part changes the camber of the elevator, where the elevator surface controls the camber of the horizontal stabilizer itself. By setting the trim there will be some camber at the backside of the elevator. This small setting is enough to keep the elevator in a fixed position. All of this is done using aerodynamic forces, so that is the reason the position of this trim is completely the opposite of the elevator itself. At take-off we set this small surface level with the elevator.
This trim in a Cessna 172 is controlled using a trim wheel in the cockpit.
Ground adjustable trims
A plane sometimes also has some ground adjustable trims, like the bottom corner of the rudder. If the plane has a few grams offset, these can be bent to make them aerodynamically stable.
Some planes also have balance-surfaces which reduce the force needed to steer the aircraft. This is the complete opposite of the trim, where the balance surface does exactly what the elevator itself does, sometimes even with a bigger steering effect.
Flaps
Flaperons (kleppen) are meant to alter the flying properties at lower speeds. These are surfaces at the trailing edge of the wings. They work basically by changing the camber of the wing somewhat, where they increase lift and drag. This makes flying at lower speeds possible during take-offs and landings.
Flaps are often mechanically or electrically and are measured in how much degrees difference they offset from the angle of incidation of the wing.
Flaps have some pro’s in using them:
The lift coefficient shift up and somewhat to the left, making the stall speed lower
The critical AoA increases a little with flaps extended, this is because of the extra drag
Flaps increase drag, and slows the aircraft down
Flaps help to see the runway much better during landings as the AoA is lower
The stagnation point of the wing shifts somewhat backwards
Types of flaps
Historically multiple types of flaps has been tested and the most used types are these:
Plain flaps : Mostly used on weight reduced planes like bush planes and is a plain part that pushes downwards
Split flaps : Old technique where the trailing edge of the wing actually splits. The legendary DC-3 has them for example
Slotted flaps : Similar to a plain flap but incorporates a gap between the flap and the wing to force high pressure air from below the wing over the upper surface of the flap. Used on most general aviation aircraft like Cessna 172
Fowler flaps : Extended out of the wing and pushed downward. Used the most on traffic jets (A320/A330/A350, B737, B777, B787)
Operational use of flaps
We generally use flaps in the take-off and landing phases of flight where these have advantages.
During take-offs
Decrease of ground roll
Increase in lift, slight increase of drag
After taking off, we set them very fast to 0 as because of the increased drag, we will achieve lower speeds.
During landings
Decrease of stall speed
Lower pitch attitude
Steeper approach and better obstacle clearance
Higher drag means a better round out above the runway
Leading edge flaps (Slats)
Slats have the exact same purpose as flaps, increasing the lift coefficient making lower speeds possible. They are installed on the leading edge of the wings instead of on the trailing edge. They are always combined with flaps settings to prevent any assymmetry from happening.
Slats also help increasing the critical AoA where flaps only decrease them but help to fly at lower speeds. Slats are mostly used on bigger commercial jets and bigger general aviation aircraft.
Turning
According to Newton’s first law, an object without any forces will move in a straight line with a certain speed. Making a turn thus needs a net force. The net force on an object is the sum of all forces acting on it.
“An object at rest stays at rest, and an object in motion stays in motion at a constant velocity, unless acted upon by a net external force.”
This force will work right onto the movement direction of an airplane and because every turn will be part of a circular movement, the required force will point to the middle of the circle. This force is called the centripetal force (middelpuntzoekende kracht).
This centripetal force is a result of the horizontal component of the lift which occurs when the plane banks into a turn.
Balance of force in turns
If a plane turns in an incorrect manner, there will occur a situation where there is no balance between the vertical forces. The gravity will stay in a straight line to the earths surface but the vertical component of the lift is tilted (to the turning side) because of the turn. This vertical lift component is now smaller than the gravity, making the plane go down. This is why a plane needs some back pressure on the yoke in turns, which increases some lift to compensate and recover the balance between lift and weight.
To get a better view of this occurence:
Rate of turns
The speed of how we fly a turn is called the “rate-of-turn”. This is measured in the amount of degrees change per second. The most important one is a Rate one turn which is 3 degrees per second and costs 2 minutes for a full circle. You can calculate the amount of degrees needed to bank with this formula:
Bank angle for rate one = TAS in knots : 10 + 5
As we can see, the airspeed is a dependency on the bank angle. Let’s say, we fly at 135 knots and want to make a rate one turn:
135 : 10 + 5 = 18,5 degrees bank angle
Some other examples:
Cessna 172: 95 : 10 + 5 = 14,5 degrees bank angle
Airbus A320: 235 : 10 + 5 = 28,5 degrees bank angle
The fun fact is, the only two dependencies are the airspeed and the bank angle. If you want to fly a turn slower, decrease your airspeed. If you want to complete a full circle faster or in a more narrow area, increase the bank angle.
Turn coordination
During a turn there will be some yawing motion. The nose will also turn in the direction of bank. If the yaw-speed is correctly and in sync with the bank angle we speak of a coordinated turn. A situation where the incoming airflow is coming straight from the front, seen from the cockpit.
If this is not the case, we have two other options:
Slipping turn: The nose falls behind when not enough rudder input is given
Skidding turn: The nose is in front when giving too much rudder input
In the cockpit we have the turn coordinator which works with a gyro, telling us exactly how much rudder input the plane needs. The keyword here is: “Step on the ball”, meaning to press the pedal at the side of the ball just to keep it in the middle.
Load factor during maneuvers (6)
The construction of an aircraft needs to be solid enough to catch all forces, both on the ground and in the air. The aircraft parts need to be strong enough to carry its weight on the ground, especially at harder landings. In the air, the plane also needs to be strong enough to withstand some maneuvers like:
Turns
Turbulence
Dive flights (aerobatics)
During the design of an aircraft, manufacturers takes the expected load factors into account. The load that an aerobatic plane gets is of course much higher than a Cessna 172. Under static strength of an aircraft we think of the force or load the construction can have once without breaking. If an aircraft is under load for multiple times there can happen some metal fatigue, permanently weaken the construction. During the walk around, this is one of the visually things to check on an aircraft:
Cracks
Wrinkled paint job
The maximum load factor which the plane must withstand is called the limit load. This possible load factor number is the force a plane with an undamaged construction can have. Under this number, some part smay temporarily bend like the wings but the flight properties may not be influenced.
Load factor numbers
The static strength of an aircraft is measured in G-force, where a plane on the ground is always 1G, or 1x the mass.
Again, here we have some numbers where we describe the load factor and increase of stall speeds in different turns:
Load factor
1
1,15
1,4
2
3,9
Increase in stall speed
0%
7,5%
19%
41%
97%
Now we have some extra numbers for different category airplanes:
Category
Positive load
Negative load
Normal
+ 3,8 G
- 1,52 G
Utility
+ 4,4 G
- 1,76 G
Aerobatic
+ 6,0 G
- 3,00 G
Always refer to your planes POH for the actual numbers, the numbers above are generally for aircraft categories. Different planes are certified for different amount of forces.
G force factors
Planes are mostly designed to carry positive lift, so the positive G force numbers are higher than the negative numbers. During negative G forces, all parts are loaded downward but planes are actually designed to fly upward.
The Load factor diagram
The load factor diagram shows at which speeds a specific aerodynamic load is pushed on the plane. The load factor as we already know is a ration between lift and weight so these numbers influence the load factor. To be careful enough we need to take both numbers into account.
At higher speeds we can produce more lift, so the lift number goes up at higher speeds. The Va speed is the maneuvering speed of an aircraft, which is around 103 knots in a Cessna 172. This is the speed where full inputs can be given to the plane without overstressing the plane. The Vne speed is the Never Exceed speed and is the red line on the airspeed indicator.
The non colored parts of the graph are outside the stall limits no are aerodynamically not reachable. As you can see is the most change of overloading the aircraft at higher speeds.
When a plane flies at 87 knots for example, a pull on the yoke will result in the plane first loaded to 2G and then in a stall as it comes outside of the green area. At an speed of 120 knots and higher with a Cessna 172 its possible to reach the limit load factor. But this can be reached earlier in the envelope if the plane has more weight. This is described by the second law of Newton: “The acceleration of an object depends on the net force acting on it and the mass of the object.”
Aerodynamics of propellors (7)
Obviously the job of the propellor is to convert engine power into thrust. Thrust is forward power of the plane which also can be helpful turing climbs. The propellor of the plane is directly connected to the crank-shaft (krukas) or indirectly with a gearbox.
Most planes in general aviation have 2 to 4 propellor blades and can contain up to 7 in some cases, but 2 to 4 are the most generic options. The blades are often made of aluminum or carbon fiber and meet each other at the hub, where the propellor is connected to the crank-shaft. The part on top of the propellor is called the spinner, which makes the propellor aerodynamically streamlined.
Propellors of a fixed pitch propellor plane are often twisted at the center. This is done to make the AoA of the propellor in the incoming air the same for the whole blade. The center part gets less air, so get a higher AoA. Exactly the same principle as the wing and the flaps as we already know. This is called propellor wrong.
The spinner is streamlined for better aerodynamic performance but also is used to steer air into the air-inlets to cool the engine. Very clever designing.
How a propellor works
The propellor works almost the same as a wing. They also have incoming air and the blades making an AoA relative to the incoming airflow. The propellor then causes a resulting air force. This force can be divided into:
Thrust: Straight and forward power
Drag: Drag of the propellor
Resultant aerodynamic force: The two forces of forward and drag means a resulting force that is somewhere between those two axis, totally dependent on the pitch of the nose
Propellor blade angle
The blade angle of a propellor is the angle between rotation-axis and the chord of the blade. The pitch of the propellor (spoed in Dutch) is the theoretical distance the propellor covers in one rotation:
Small blade angle: Fine pitch -> Optimal for climbing
Big blade angle: Coarse pitch -> Optimal for cruise
The blade angle of a propellor is similar to the angle of incidence on a wing.
Propellor Angle of attack
The angle of attach of a propellor blade is the angle between chord and incoming air. Just like a wing. A plane who is standing still on the ground, the AoA is equal to the blade angle as there is not that much incoming air. If the plane moves forward, more air will come in from the front. The angle of attack decreases in this case.
At an increasing forward movement speed the AoA will be 0 or even negative. The propellor doesn’t produce thrust anymore.
Propellor Wrong
The propellors of fixed pitch propellor planes like the Cessna 172 are slightly wronged. This means the root of the propellor has a bigger AoA than the tips. As the whole propellor rotates, the tip will cover a much bigger distance than the root of the propellor. This results in less air picked up. To compensate for that effect, the AoA is higher at the root of the propellor to span the thrust over the whole blade. If these are not wronged then the propellor will be working very inefficiently.
Fixed pitch propellor RPM
In fixed pitch propellor planes like the Cessna 172, the RPM of the engine is equal to the RPM of the propellor. The AoA of an propellor is the highest when standing still on the ground. At a high AoA, the drag is also much bigger making full throttle exercises not very dangerous for the engine.
When flying the propellor produces forward motion (thrust) the AoA will decrease. This also results in a lower drag making the propellor spin slightly higher. Theoretically you can’t exceed the engine rpm limits on the ground, only in the air because of this. This phenomenon is also to be seen during flights. When the pitch attitude is higher, the engine RPM will decrease. When descending, the RPM will decrease. During descends we also draw the power back. The much lower drag and the extra downward thrust you otherwise get can reach high speeds in seconds.
Propellor windmilling
When the forward speed increases, the AoA of the propellor will decrease. At a certain rotating speed the AoA becomes zero and no thrust will be produced by the propellor at that point. If the speed increases even more than that, the propellor AoA will be negative; the propellor produces drag instead of thrust.
The propellor stays rotating because of the incoming airflow, making it a flying windmill. At an engine failure, the propellor will also continue to rotate. This windmilling effect causes some more drag. This extra windmilling decreases the glide angle and so gives you less gliding distance.
Engine power to thrust conversion
The power a propellor gives is dependent of the forward speed. Power x speed. If a plane is standing still with a rotating propellor, trust is produced but the power is 0. At an increasing forward speed the power is also increasing, till the limit is reached. As we just learned that the AoA decreases at higher speeds, the thrust will eventually also be decreased.
If we make a relational graph with the power and speed, the curve will be increasing till the point where the AoA is zero. The power will then just like the lift coefficient drop very vast.
This is the case for a fixed pitch propellor which only produces optimal thrust during a certain speed, dependent on the construction of the propellor. It works good during or climb or cruising but never both.
Small blade angle: Fine pitch -> Optimal for climbing
Big blade angle: Coarse pitch -> Optimal for cruise
Constant speed propellor planes
Aircraft manufactures thought of a clever idea to make propellors where the pilot can set the blade angle based on the flight phase, where they can decrease the AoA in climbing phases and increase the AoA during cruise to get the most out of the engine at all times. These planes are called constant speed propellors -> the propellors always rotate at a constant speed.
This gives the pilot 3 handles instead of two. Next to a throttle and mixture they alsy get a blue for this cause. With that handle you can set a desired propellor RPM where you still control the fuel inlet pressure (manifold pressure) with the black throttle.
The graph shows that the line of a constant speed propellor is more flat and spanning the whole range. This means it can convert as much engine power to thrust as possible, and not only during climb or only during cruise.
You can see the constant speed propellor just like switching gears in a car. You can switch gears at all times to make the fuel efficiency better but also get higher speeds when you most need them.
Propellor side effects
The propellor is a great tool to produce straight forward motion called thrust. But the propellor also causes some aerodynamic side effects:
Slipstream effect: The effect that turns around the plane and pushes against the rudder
P-factor (assymmetric blade-effect): The assymmetric power the prop delivers at high angles of attack
Torque effect: The effect of the plane wanting to counteract the propellor movement
Let’s dive deeper into these three effects and how to take them into account as pilot and ultimately counteract them.
Slipstream-effect
The slipstream effect on single engine planes is caused by the right-rotating prop (seen from the cockpit). This slipstream rotates around the longtitudinal axis of the plane and hits the vertical stabilizer and rudder. During climbing situations, this results in a yawing motion to the left as the right-turning air hits the vertical stabilizer on the left side.
Aircrafts are designed to somewhat suppress this effect by assymmetric stabilizers, setting this under a small angle or a small ground adjustable trim surface on the rudder.
If we set a lower RPM, the slipstream becomes way less and then aircraft designs tend to yaw right. This is why we learn in single engine planes to counteract this effect as following:
High RPM: Right rudder
Low RPM: Left rudder
Think of: Low is Left or Left is Low.
P-factor
The P-factor or assymmetric blade-effect with right rotating prop as seen from the cockpit is caused when a propellor that rotates is not perpendicular (loodrecht) to the flying direction. The downward blade produces more thrust than the upward blade. At high angles of attack, the downward blade moves in the flying direction but the upward blade moves opposite to the flying direction. The downward blade gets a higher AoA where the upward blade AoA decreases, and as we just learned that a higher AoA procudes more trust, we get asymmetrical thrust. The actual result is the nose of the plane wanting to go left.
This is the somewhat strange cause of why we need to give some right rudder in a left climbing turn.
Torque effect
The torque effect is exactly how it sounds, a rotating propellor produces a torque/rotating effect. We have to agree with mr. Newton again because this is an effect of his 3rd law; “For every action (force) in nature, there is an equal and opposite reaction”
The action is the propellor turning and the reaction is the fuselage of the plane wanting to roll left. This is mostly noticable during the take-off phase. The plane wants to roll left, resulting in more drag and force on the left wheel. The torque effect is therefore the same direction as the slipstream effect and increases the tendancy of the plane to go left.
During take-offs or touch and go’s, counteract by steering somewhat right with the rudder.
Source: Boldmethod.com
Stability (8)
An aircraft is continiously exposed to different attitude changes as result of wind, turbulence, convection or smaal yoke inputs. After being exposed to such change the forces and moments on the plane wordt not be balanced causing a huge workload for the pilot. Flying must be fun and easy to do, the easier it is, the safer.
An aircraft has great control-properties if its stabilityis good. With stability we mean that the plane must restore itself to the balance state after a small change, apart from if this change is intentional or not. Stability also has some downsides, when turning or maneuvering we are changing the attitude of the plane and makes this somewhat harder. Aircraft manufacturers seek to find the perfect balance between stability and maneuvering.
Types of stability
We can have three types of stability:
Statically unstable
Neutral (indifferential)
Statically stable
Some examples of how this looks:
As we can think of the mass of the ball and the gravity working against themselves, in the statically stable situation, the ball would move around somewhat and then return to the before point when moving. This makes it statically stable.
The ball on the left would after moving never reach its stability point. The middle ball will constantly pick a new balancing point, but will need continuous corrections.
Dynamic stability
The dynamic stability describes the flow of the three situations above into the speed of returning to the balancing point and thus being stable. When a plane’s attitude is changed during cruise flight where all 4 flying forces are balanced, the plane must return to that balancing point as soon as possible. We can only achieve dynamic stability if the plane is statically stable.
Aircraft stability and axis
Axis
Axis (Dutch)
Stability
Stability (Dutch)
Movement
Longitudinal axis
Langsas
Lateral stability
Dwarsstabiliteit
Pitch
Vertical axis
Topas
Directional axis
Richtingsstabiliteit
Yaw
Lateral axis
Dwarsas
Longitudinal stability
Langsstabiliteit
Roll
Longitudinal stability
The longitudinal stability is the stability of the lateral axis, the pitch movement. An aircraft is longitudinal stable if the it restores the pitch (AoA) to the state before interruption like minor inputs, wind or turbulence. Planes are designed that the center of gravity (CG) lies in front of the Center of Lift (Center of Pressure). This is by design to make the plane making a nose up movement when throttle is full and a nose down movement when throttle is closed. The slipstream air of the propellor flows over the elevator making it very effective.
To compensate for this moment and to make the plane longitudinal stable, we have the horizontal stabilizer at the tail of the plane. This is basically an upside down wing at the tail of the plane, and is an extra lift factor which makes the plane more stable on the longitudinal axis (langsas).
When the center of gravity (CG) is in front of the Center of Lift, (pressure point), the horizontal stabilizer must do a negative force. Because of the distance between CG and horizontal stabilizer is much longer than between CG and pressure point, a small horizontal stabilizer moment is needed. This distance defines operationally how stable the plane is on the longitudinal axis, the more the CG is up front, the more stable the plane is. If this CG shifts backward, then the stability decreases.
Canard
A canard is a set of small wings at the nose of the plane. Some planes counteract the longitudinal stability by shifting the wings somewhat to the back. This creates a more frontal CG in combination with this added set of small wings. These canards always produce positive lift as the AoA is positive.
Center of Gravity boundaries
As the CG has a big impact on the stability of the plane, the allowed position of the center of gravity is strictly limited. This CG must be within a limited frontal and after CG. Exceeding this values can dramatically decrease stability and flight performances.
Too Frontal CG : This makes the plane stable but requires bigger steering forces. This can also lead to being unable to perform a roundout during landing.
Too Aft CG: If the CG is more to the tail of the plane, the longitudinal stability is relatively small. The pilot must continuously correct the pitch resulting in uncontrolled pitch up movements.
The most aft limit of the center of gravitity is still in front of the Center of Lift by design, but mind to do your Mass and Balance calculations the right way to prevent those crazy things from happening.
Horizontal Stabilizer AoA
To get enough longitudinal stability, the horizontal stabilizer has a smaller angle of incidence and so AoA. This is done so every pitch change has a bigger effect on the horizontal stabilizer than on the wings. This angle of AoA of the wings and the horizontal stabilizer is called the long-V angle.
This difference in AoA also causes the wings to stall first in high nose up situations, making the elevator still controllable to recover.
Directional stability
The directional stability is the stability around the vertical axis (yaw). If during a flight the air comes straight head-on, the flight will be coordinated. If because of a small yaw imput the air will not come front, a slip occurs. We call the angle between the incoming air and the longitudinal axis the slipping angle.
An aircraft is directionally stable if during a slip it wants to recover itself to be aligned with the incoming air again. This is mostly achieved by the use of the vertical stabilizer. This also gets a different angle during slips, which result in an aerodynamic force from the side making the slip undone.
Effect of Center of Gravity
The distance between the vertical stabilizer and the CG (the arm) determines the directional stability. A more aft-CG will decrease the arm of the vertical stabilizer and making it less effective and so less stable. A more frontal CG does the opposite, increasing the effectivity and stability.
Lateral stability
The lateral stability is the rolling-axis stability. An aircraft is roll-stable when it returns to wings-level state after rolling. Just as the directional stability, is the roll stability a result of a slipping movement. Because of this movement another force occurs which restores the balance.
At lighter planes, this stability is reached by placing the wings under an angle of the longitudinal axis like a Piper plane. This is called a dihedral. If the wingtips are lower than the wing-root, then it would be called anhedral.
Such dihedral is dependent of a slipping movement where the airflow comes at an angle. This can happen when a plane rolls, the AoA of the lower wing will increased and the higher wing decreased resulting in a recovery to wings level.
Dihedral effect
A high-winger like a Cessna 172 has a better rolling stability than a low-winger like a Piper. The cause of this is in the behaviour of the crosswind-flow when a rolling motion.
The crosswind-flow will be bent off by the fuselage. At a high-winger this results in a bigger AoA of the low wing. This results in more life, pushing the low wing up and be balanced again.
Center of gravity details
A plane is behaving different when loaded differently. As we have an object that is flying through the air, it needs to be balanced which we do in the mass and balance sheet. It cannot exceed the forward or after limits, but based on how the plane is loaded, it will behave differently.
Topic
Forward CG
Aft CG
Aircraft balance
Nose-heavy
Tail-heavy
Longitudinal stability
More stable
Less stable
Pitch control
Heavier control forces
Lighter control forces
Elevator authority
More elevator force needed
Less elevator force needed
Stall speed
Higher stall speed
Lower stall speed
Take-off/landing distance
Longer
Shorter
Landing flare
More difficult to flare
Easier to over-flare or balloon
Stall behaviour
Nose tends to drop more naturally
Nose may not drop as readily
Stall recovery
Easier recovery
More difficult recovery
Spin tendency
Less likely to enter a spin
More likely to enter a spin
Spin recovery
Generally easier
May be difficult or impossible
Drag
More drag, greater tail-down force
Less drag
Cruise performance
Worse cruise performance
Better cruise performance
Fuel consumption
Higher fuel consumption
Lower fuel consumption
Trim
More nose-up trim usually required
Less nose-up trim usually required
Main risk
Aircraft may not rotate or flare properly
Aircraft may become unstable or unrecoverable
Summary
Stable but heavy on controls
Efficient but unstable
End of the page 🎉
You have reached the end of the page. You can navigate through other blog posts as well, share this post on X, LinkedIn and Reddit or return to the blog posts collection page. Thank you for visiting this post.
This page can contain a collection of personal notes, steps to remember, finished and unfinished content. Please excuse brevity.
Do not use specific information given like fuel flow, landing/take-off distances for your flights. Always refer to the POH of your exact plane for flight preparation. My information is just for references that I used.
The airframe (1)
The frame of a plane consists of several parts, which all make flying and steering in the air possible by various actions. I will describe all parts in English and Dutch:
Wing - Vleugel -> The horizontal part which makes flying an aircraft possible in the first place by generating lift
Aileron - Rolroer -> These are the parts at the end of the wings, making roll-turns (banking) possible. They are at the end of the wing due to force x moment
Elevator - Hoogteroer -> This part controls the pitch attitude of the aircraft, making the nose move up or down.
Rudder - Richtingsroer -> This part at the end of the tail controls yaw and is used to keep the aircraft coordinated and make directional corrections.
Flaps - Landingskleppen -> These are parts on the wing which can be used in take-off and landings to fly at lower speeds nearby the ground. They extend to induce more drag, which equals a lower speed and they generate some lift
Vertical stabilizer - Kielvlak -> This is the standing part of the tail of an airplane, giving directional stability around the yaw axis.
Horizontal stabilizer - Stabilo -> This is the horizontal part of the tail of an airplane, giving stability around the pitch axis.
Aircraft construction
The aircraft itself can be constructed in several different ways. The most important thing here is the type of aircraft. Bush planes are very light and will be less likely to use heavy stainless steel.
Monocoque: A construction method where the external skin of the aircraft carries almost all of the loads. There is little or no internal framework. It’s lightweight but can be less tolerant to damage, since the skin itself is the main structure.
Outside supports all forces
Comparable with a can of coke
Semi-monocoque: A more common design in modern aircraft. The external skin still carries loads, but it’s reinforced by an internal structure (frames, stringers, bulkheads). This makes the structure stronger, more damage-tolerant, and easier to repair than pure monocoque.
Inside supports half of the forces and outside half of the forces
Truss contruction: This method will support all forces on the inside of the plane. Here the outside could be any material, like leather or vinyl.
Inside supports all of the forces
The wings
We could have two types of wings:
Cessna 172 has the wings above the cockpit: high-wing (hoogdekker)
The Cessna 172 uses strut-braced wings.
Piper PA-28 has the wings below the cockpit: low-wing (laagdekker)
The Piper PA-28 has cantilever wings, meaning there is no external strut support.
These wings are often set in a V shape, called dihedral
Both of this types of planes have their pro’s and cons. In many Cessna 172 versions, the high-wing fuel tanks allow fuel to flow by gravity. Some aircraft versions and fuel systems can still have fuel pumps, so always check the POH of the exact aircraft. Als we cannot see traffic above us very good in a Cessna, but not very good under us with a cantilever wing.
There are also planes which have a V shaped tail with a rudder and elevator combined. These types of tails are called a ruddervator.
Tires
We can have 2 types of tyres on arplanes:
Tube-type: This type has an inner tube and an outer tyre, comparable with a bicycle tyre.
Can be sensitive to tube damage if the tyre slips on the rim.
Often has a slip mark to detect movement between tyre and rim.
Tubeless: This type has no separate inner tube.
Tyres can slip over the rim during landings, this is the reason maintenance does a little slipmarker on the tyre and rim. This is mostly red. The purpose of this marker is to see within seconds if the tyre has been slipped over the rim during earlier landingd, which comes with possible unclear damage.
Nose wheel construction
The shockdamper of the nose wheel construction works with gas and oil, which have both a unique task:
Gas for suspension (vering)
Oil for damping
The gas, usually nitrogen, provides the spring effect because it can be compressed. The oil provides damping because it is forced through small openings or chambers. Oil itself cannot be compressed, but it can control the speed of the movement.
The nose wheel also has:
Shimmy damper: which is a device that helps preventing the nose wheel from vibrating very aggressively during high speeds on the ground. If a shimmy happens, the wheel can shake like a bike where you let go of the steer
Torque link: The torque link (torsieschaar) is a device that prevents the nose wheel from rotating outside of its steering range, so keeps it aligned with the planes’ heading
Hydraulic systems
Hydraulic means transferring pressure by using an incompressible fluid. In aircraft this is hydraulic fluid, not water which properties are that it can be hardly compressed, as a low viscocity and is dangerous for human people to touch with hands and eyes. This fluid is pumped around like a circuit, where the circuit is leveraging the least resistance at the action, like a brake so if you press on the brake pedal, this force is transferred to the brake at the wheel en from there the fluid is pumped pack to the reservoir and the brake pedal.
We can transfer different forces using liquids hydraulically using this formula:
Force = Pressure × Area (F = P × A)
This means that, at the same pressure, a larger surface area gives a larger force. Liquids are a great way to transfer force, as fluids can hardly be compressed compared with air.
Hydraulic liquids properties are:
Unhealthy then touched
Thin and low viscocity
Much systems in an airplane works with hydraulic systems, like:
Brakes
Landing Gear
Propellor blade angle
Brakes
Brakes are systems built on the axes of the airplane to brake it, to lose power. This process converts the kinetic energy of the plane into energy in the brakes, which is warmth. Brakes are mostly powered using hydraulics.
Icing
As we don’t want ice on our plane or in parts of the plane, we have ice-preventing systems as we know two different categories:
Anti-icing (prevent): Systems that prevent ice from happening like windshield anti ice, engine anti-ice, carb heat or the pitot heat
De-icing (revive): Systems that remove ice that has already built up, like pneumatic boots on the leading edge of the wings or stabilizers.
Both systems are being used to battle ice during flights.
Fire and smoke in the plane
There are situations that fire and smoke can happen in the cockpit. Let’s dive into the different scenarios.
Engine fire during start
During starting the engine, engine fire can happen. This is mostly because of overpriming the engine, having way too much excess fuel that ignites instantly. Also priming with the throttle which pumps fuel into the carburetor, increases the chance of engine fire.
The actual procedure to follow during this situation is specific to your aircraft but the base is something like this:
Continue cranking for 5–10 seconds to try to suck the flames into the engine
If engine starts:
Parking brake set
1700 RPM
Prepare seatbelts, doors, fire extinguisher
Wait max. 2 minutes/120 seconds
If fire continues:
Mixture cut‑off
Throttle full open
Fuel selector OFF
Ignition OFF
Master switch OFF
If engine does not start:
Mixture cut‑off
Throttle full open
Continue cranking briefly
Ignition OFF
Master switch OFF
Fuel selector OFF (if possible)
Extinguish fire using any possible method
Smoke in the cockpit
Smoke can happen in the cockpit due to several causes:
Short-circuit in the electrical system
Disable the complete electrical system and turn off electrical components one by one with the circuit breakers till you found the problem
Engine fire
Follow the POH/checklist of the exact aircraft. In general, the goal is to stop the fuel supply, reduce the chance of fire entering the cockpit, and prepare for an emergency landing.
Other parts on fire
To correctly battle these situations, we must first know what to do exactly in each situation. These are described in the POH of your aircraft. For fires in flight, a CO2 extinguisher is the best option.
Fire types and extinguishers
Maintaining a fire is done by having these three components:
Fuel (flammable material)
Oxygen
High temperature
By taking away only one of these three components, the fire will extinguish. We have four types of fire with possible extinguish methods:
A = Solid materials like wood, paper, textile and some plastics
Often water, foam or dry powder
B = Flammable liquids like gasoline or oil
Foam, dry powder, CO2 or Halon/Halon replacement, depending on the situation
C = Gas fires
Stop the gas supply if possible, then use a suitable extinguisher
D = Metal fires, like magnesium or aluminium powder fires
Special dry powder extinguisher for metal fires
F = Fat or cooking oil fires
Wet chemical extinguisher
Water based extinguishers are not that practical for electrical and type B fires. Water is heavier than fuel. Also, Halon extinguishers are very poisonous so good ventilation is needed when using these. This also counts for CO2 type extinguishers, which are generally not for closed environments.
The piston engine (2)
In planes, the most used engine type is a four-stroke (viertakt) gasoline engine. Four strokes means that the engine uses 4 strokes to complete the fuel burn process. The engine is obviously the most important part of getting the propellor to turn.
The engine has the following parts:
Dutch term
English term
Explanation
Carburateur
Carburetor
A part of the engine that mixes fuel and air to create the correct fuel-air mixture for combustion.
Inlaat
Intake
The part of the engine where the fuel-air mixture enters the cylinder.
Inlaatklep
Intake valve
A valve that opens and closes at the correct moment to let the fuel-air mixture flow from the intake into the combustion chamber.
Uitlaat
Exhaust
The part of the engine where the burnt gases leave the cylinder and are guided toward the main exhaust system.
Uitlaatklep
Exhaust valve
A valve that opens and closes at the correct moment to let the burnt gases leave the combustion chamber through the exhaust.
Bougie
Spark plug
The part that ignites the fuel-air mixture by producing an electrical spark.
Nokkenas
Camshaft
This part is connected to the crankshaft by gears or a timing system. It controls when the intake valve and exhaust valve open and close. In a four-stroke engine, the camshaft rotates at half the speed of the crankshaft.
Cilinder
Cylinder
The cylinder is the main chamber in which the piston moves up and down. Combustion takes place in the upper part of the cylinder.
Verbrandingsruimte
Combustion chamber
The area where the fuel-air mixture is compressed and ignited. This is where combustion takes place.
Zuigerveren
Piston rings
Rings attached around the piston. Their purpose is to seal the combustion chamber from the rest of the cylinder and to help control oil.
Zuiger
Piston
A moving part inside the cylinder. It is connected to the crankshaft through the connecting rod and transfers the force from combustion into mechanical movement.
Drijfstang
Connecting rod
The part that connects the piston to the crankshaft. It transfers the up-and-down movement of the piston to the crankshaft.
Krukas
Crankshaft
The crankshaft converts the up-and-down movement of the piston into rotating movement. In an aircraft engine, the propeller is connected to the crankshaft. In a car, the crankshaft ultimately drives the wheels through the drivetrain.
Carter
Oil sump / oil pan
The lower part of the engine that contains engine oil. It stores oil that is used to lubricate the moving parts of the engine. This can be a wet sump or a dry sump system.
Krukkast
Crankcase
The central housing of the engine. It contains and supports the crankshaft and often also parts of the camshaft system. At the bottom of the crankcase there is usually an oil sump or oil pan, which contains engine oil.
Burning fuel in a 4 stroke engine is completed in 4 different phases:
Inlaatslag (Intake)
Compressieslag (Compression
Arbeidsslag (Power)
Uitlaatslag (Exhaust)
Engine shapes
There are multiple types of motorshapes. In planes, the most used shapes are:
Line engines
Horizontally opposed engines, often called boxer engines
Engine power units
The units which can be used to measure engine power are mostly indicated in Horse Power (HP/pk). This is a worldwide standard, but sometimes the actual measurement method is described. Sometimes BHP % is used in the POHs of the aircraft. The method to measure is a special installation connected to the crankshaft, and measuring the force needed.
We also have an indication of how long you may use full engine power. The indicator for maximum continious power is the maximum power you can use unlimited. In fixed-pitch propeller aircraft, RPM gives an indirect indication of engine power. In constant-speed propeller aircraft, power is normally managed using manifold pressure and RPM together.
At bigger heights, like from 3000ft, we need to pull somewhat on the mixture handle to reduce the amount of fuel going into the engine. At bigger altitude, the process is more inefficient when putting too much fuel into the engine.
Manifold pressure: The absolute pressure in the intake manifold, usually measured downstream of the throttle valve.
Brake horsepower (BHP): The actual power delivered at the engine output shaft, measured with a dynamometer or brake system.
The power of a piston engine depends on the air density. This is depending on the pressure, temperature and humidity. At a low air density
Turbo-engines can be described in different ways:
Turbo-normalized: This type helps the engine maintain about sea-level manifold pressure at higher altitude.
Turbocharged: This type can increase manifold pressure above normal sea-level pressure, depending on the engine design and POH limits. This works till the critical altitude.
How a turbo system works
A turbo system is basically a turbine and a compressor. The turbine is driven by the exhaust gasses and is connected through an axis with the compressor which is placed in the air inlet system. The compressor will increase the pressure of the intake air, resulting in a higher manifold pressure. This increases the motor-power. Turbine compressors rotate at a very high RPM, around 80.000 RPM to 100.000 RPM in some cases.
The schematic drawing of a turbine-compressor combination.
As a result of the compressed intake and the flow of hot exhaust gasses, the temperatures of a turbo will increase very high. Turbo’s can even be glowing red. Turbo engines therefore often have a intercooler, which cools the compressed intake air before it enters the engine. This is similar to a radiator. Turbo engines also need some minutes of stationary running before shutting down to completely cool down.
A waste gate is a valve in the exhaust system where part of the exhaust gases can bypass the turbine to control turbocharger speed and manifold pressure. Some engines have a automatic waste gate function, in these type planes you can use full power on sea level.
Multi engine planes
There are also planes with multiple engines. They have engines which have separate systems to power and provide fuel to those engines. This is by design to minimize the chance of having both engines to be in error at the same time.
Multi-engine airplanes have rudder trim to compensate for single engine failures
If a multi engine plane has one engine failure, they set the propellor to “feather” (vaanstand) to reduce the drag of the propellor
Fuel System (3)
The fuel system and parts of aircraft are categorized into two categories:
The fuel tanks with the fuel lines to the engine
The induction system to merge the fuel with air where two types are possible
The fuel system can consist of the following possible parts:
One or more fuel tanks conistsing tap-points with air vents amd cross-lines
A fuel selector valve to select a specfiic tank or to open both or close both
Fuel pumps
Primer system
Fuel tanks are very often located in the wings, but can also be in the wingtips or fuselage parts.
The goal of the fuelsystem is to drive fuel to the carburetor, where the fuel and air mixture is created before being ignited in the cylinders. If fuel tanks are located above the carburetor, like in many carbureted Cessna 172 aircraft, fuel can flow due to gravity feed. Some aircraft versions, especially fuel-injected versions, can still have fuel pumps, so always check the POH.
On planes where the fuel tanks are on the same level or lower than the carburetor, the fuel needs a pump to do the work. This pump is mostly driven mechanically by the engine. For backup purposes, in most cases we also have a electronic fuel pump which is often called a stand-by pump or auxillary fuel pump.
The fuel output point in the fuel tank is in most cases at the lowest point of the tank. However, we lose some part of the fuel making the difference between all fuel and unusable fuel. On the Cessna 172, we lose around 1,5 USG because of this. The pro of this is that possible dirt and other contamination is sinking to the bottom and not injected into the fuel system.
Fuel venting system
Fuel tanks have a venting system to maintain atmospheric pressure in the tank as fuel is used and as pressure or temperature changes. This is very critical at high-wing planes to ensure fuel always flows to the engine due to gravity. If the vent becomes blocked, a vacuum can form in the tank and fuel flow to the engine can be restricted or stopped. Types of venting are:
Venting pipes in the tank itself
Special tank caps
Fuel tanks also have a drain at the bottom side, which can be used if any contamination or water is in the fuel and the color can be checked. Here we also have a strainer where water and contamination can be removed from the tank.
Vapour lock
Vapour lock is a phenomenon where fuel vapour bubbles occur in the fuel lines, making the fuel flow very hard or sometimes even impossible. It can be caused by high temperatures, low pressure in the fuel system, or fuel with a higher vapour pressure. To solve vapour lock, turn on the electrical fuel pump and/or enhance engine cooling, according to the POH. Using Mogas fuel can increase the chance of vapour lock compared with AVGAS. The chance of this happening is therefore higher on hot summer days.
Fuel selectors
Fuel selector valves are being used to select where the fuel comes from. By setting this switch, you actually turn a mechanical valve to decide the flow of fuel. In most cases, we set this on both (if applicable) but in some cases to check or to balance the fuel in both tanks we select one of the two tanks only.
Fuel filters
In a piston engine, the fuel filter is placed between the tank and the fuel pump/primer so the fuel is cleaned before it reaches sensitive parts.This protects the fuel pump and primer from dirt, rust, water, or debris coming from the tank. If the filter were placed only after the pump, contaminated fuel could already damage or block the pump. Clean fuel also helps prevent blocked primer lines, poor starting, rough running, or fuel starvation. So the main reason is protection and reliable fuel flow to the engine.
Carburation
To let a piston engine work, the mixture of fuel and air must be optimal before being delivered to the cylinders. This mixture can be made using two different systems:
Carburetor system
Injection system
In the carburetor, air and fuel are mixed into a optimal ratio and then will be delivered to the engine cylinders. The carburetor consists of a pipe with a narrowing, the venturi, and a throttle valve which you control with the throttle handle in the cockpit. In the venturi is a sprinkler which is connected to the float-chamber. This system is also called a updraft carburetor
Fuel to air ratio
Chemically, combustion is a reaction of a particle with oxygen. To start a combustion, fuel must be combined with air in a specific ratio. When one of both is too less, no combustion can happen, so the combustion area of an engine is within a certain area.
For gasoline, the chemically ideal mixture is about 1 part fuel to 14,7 parts air by mass. This is called the stoichiometric ratio and is about 6,4% fuel by mass.
Rich mixture: 1:8 or 11,1% fuel
Lean mixture: 1:20 or 4,8% fuel
In engine descriptions, the version with the ratio is almost always used as where the percentage does make more sense. We need to control the mixture because we can fly in air with a lot of air molecules close to the ground but also in air high up with way less molecules. In real engine operation, the mixture is not always kept exactly at 1:14,7. For high power settings, a richer mixture is often used for power and cooling. In cruise, the mixture can be leaned according to the POH and engine limitations.
Additional carburetor parts
The carburetor contains some additional parts to make it work as expected:
Idle sprinkler (nullastsproeier): This part ensures enough fuel is sprinkled during idle power, otherwise the engine will stop working
Acceleration pump : When the throttle value is opened up quickly during acceleration, the sprinkler will start somewhat slower making the engine not run optimal. Some carburetors are equipped with a accelerationpump, pumping extra fuel into the carburetor, solving this problem
Mixture-handle: The mixture handle itself controls the amount of fuel that is mixed with the air. As you push it forward towards Rich, you get a rich mixture, meaning much fuel per air molecule. By pulling the mixture, this amount will be decreased
Idle cut-off valve: The plane also has a mixture handle that can be fully pulled to idle cut-off. This means the idle spinkler and carburetor are both disconnected from the fuel, and the engine to lose fuel resulting in a shutdown of the engine. This is the common way to turn off a planes’ engine in general aviation
Power enrichment system: This system ensures in throttle full-scenario’s, the fuel is somewhat more rich to help the engine cool more efficiently. Excess fuel is used to cool the cylinders
Air inlet system
Air normally reaches the carburetor through the engine air inlet system. This inlet is located at the front of the aircraft, just below the propeller. Before the air reaches the carburetor, it passes through an air filter. This inlet or filter can become blocked by debris, grass, snow, ice, or other contamination, which is why inspecting the air inlet and filter area is part of the preflight inspection.
On carbureted Cessna 172 models, an alternate source of air is provided through the carburetor heat system. When the carb heat control is pulled in the cockpit, a valve in the carburetor air box changes position. Instead of using the normal filtered outside air, the engine draws warmer, unfiltered air from around the exhaust heat muff.
This warm alternate air helps prevent or remove carburetor ice. It can also allow the engine to keep running if the normal air inlet or air filter becomes blocked. However, because the air is warmer and less dense, using carb heat usually causes a drop (~10%) in engine power and RPM. Therefore, carb heat should be used according to the aircraft checklist and operating procedures.
Carb heat off: Filtered air from outside
Carb heat on: unfiltered air from the exhaust
Icing in carburetors
The moisture in the air can freeze in the carburetor if the temperature there is below 0 degrees. The temperature in the carburetor is always lower than the outside air temperature, because of the following reasons:
Vaporizing of fuel: Vaporizing fuel costs energy and this is picked from the air, causing the temperature of the air to drop
Lower pressure in the venturi: Lower pressure means a decrease in temperature
This is the reason we use carburetor heat according to the POH/checklist. In my flight lessons, the practical rule is to use carb heat when reducing power below 2000 RPM, except on the ground:
In the full circuit
During landing
During descending
During gliding
Carb icing can happen at any outside air temperature, even on hot and sweaty days:
High humidity: The more moist in the air, the more can be frozen
Low engine RPM: less heat is more ice
We check carb heat during the before take-off checklist by setting the RPM as specified in the POH, often around 1700 RPM, and then selecting carb heat ON.
If there is no carb ice, RPM normally drops because the engine receives warmer and less dense air.
If carb ice is present, RPM may first drop and then increase again as the ice melts.
When carb heat is selected OFF again, RPM should normally return to the original value.
During the flight, we can recognize carb icing due to these causes:
Reduce in Engine RPM
Reduce in manifold pressure (constant speed propellor planes only)
Very inconsistent running engine
Other rules about the Carb heating system are:
Disable it (OFF) mostly on the ground, due to unfiltered air
Disable it during climbs and go-arounds to get the best engine performance
Enable or disable Carb Heat, no in between settings
Carb Heat on means higher fuel usage
Carb heat on means a higher fuel-air mixture, as less air comes in, the ratio has more fuel
Fuel injection
Carburetors have two important downsides:
Icing in the venturi, possibly causing dangerous situations if not handled properly
Fuel/air mixture distribution over cylinders is not equal
These problems can be solved by using fuel injection. This system, which is available in modern aircrafts, has an injection in every cylinder controlled by a fuel control unit in between.
Just like the older carburation system we have a throttle valve, controlling the airflow into the engine. The fuel control unit meters the correct amount of fuel and sends it to the fuel divider and injectors. Most gasoline-based engine will inject the fuel continuously, not only when busy in the intake stage.
Fuel injection systems are always equipped with two possible ways of pumping fuel, which can be mechanical, using gravity or electrical. In the fuel manifold the fuel flow is measured, just like described in the disgram above.
Fuel injection systems are more complex and more expensive than carburetor systems, and they remove the risk of carburetor icing. However, induction icing or intake blockage can still be a risk, so some aircraft still have an alternate air system.
Aircraft fuel types
In aviation we know three types of fuel, each for their own cause.
Fuel type
Description
Used for aircraft type
Mogas
Automotive gasoline, only usable in aircraft if approved by the engine/aircraft manufacturer or by STC
Some approved piston aircraft
AVGAS 100LL
Leaded aviation gasoline, blue in color
Many gasoline piston aircraft
AVGAS 91UL
Unleaded aviation gasoline with a lower octane rating than 100LL
Approved gasoline piston aircraft
Jet-A1
Kerosene-type turbine fuel
Jet aircraft, turboprops and some diesel piston aircraft
An important parameter of fuel for planes is the knock resistance (klopvastheid). Fuel with a low knock resistance can burn under high pressure and normal operating temperature, leading to detonation. This is called detonation and results in a rough running engine.
Most planes can, some with some revisions, run on both AVGAS and MOGAS. The primary reason to use one of the two is the price. At this moment, the prices in the Netherlands are around:
AVGAS: 3,94 per liter
Mogas: 2,63 per liter
Fluids themselve cannot burn. They first have to vaporize and the vapor needs to have a specific mixture with air to actually burn.
Static electricity and Fuel
Resistance of two substances can produce a separation of electrical load. If the contact is broken, the two substances keep their electrical load. A plane can be loaded statically by precipitation, dust or sand in the air. This can also happen due to the flow of fuel in the tank installation. A passing thunderstorm can also cause a plane to be statically loaded.
Static energy can also cause interference in radio or navigation systems. To unload the plane from static energy, the plane has some static wicks, paths of low resistance with the air to unload itself which are mostly attached to the elevator and ailerons.
When the plane and tank installation have a different static load, a spark can transfer electrical load between the two objects when they are connected. To prevent this from happening and to send the electrical load directly into the ground, we always connect a plane using the ground wire during tanking operations. This is a wire we connect to a conductive part of the plane, like the nose wheel axis.
Fuel contamination
Aircraft fuel must be free of dust, water and other particles. When fuel is in the tanks, fuel can be contaminated. This is the main reson to check the fuel for any contamination with a dip stick and the drain. Water is the most occuring contamination and can leak in due to vapor, leakage and during rain. Water and fuel will not merge, and water is more heavy that fuel, so water will drop down and fuel will float on top of that.
Diesel engines
Diesel engines are very similar to gasoline engines. An important difference is that the diesel engine doesn’t use spark ignition like gasoline engines. They compress air to a high pressure and temperature, and fuel is injected into this hot compressed air, causing ignition. Diesel engines need a better and stronger construction because of this.
Diesel engines also don’t have a throttle valve in the same way as gasoline engines. Power is mainly controlled by the amount of fuel injected, often electronically by FADEC in modern aircraft diesel engines.
Diesel engines have two engine-driven fuel pumps:
Low pressure pump: Pumps fuel to the high pressure pump
High pressure pump: Pumps fuel to the injection system with an overflow system, which excess diesel will flow back to the fuel tank
Diesel engines also don’t have mixture handles, but are electronically controlled using FADEC.
The ignition system (4)
After we have discussed the carburetion and injection system of engines, we will now take a closer look at the ignition system of general aviation aircraft. Ignition of the fuel/air mixture is what our propellor causing to turn and giving us thrust.
With gasoline engines, fuel/air mixture is ignited using a spark which is produced by a spark plug using high voltage. This voltage is around 20.000 volts and this voltage is produced by the magneto’s. The goal of the ignition system is to generate high voltage so the spark plugs will spark at the right moment to ignite the fuel/air mixture.
Parts of the ignition system are:
Magneto’s
Voltage distribution system to distribute the voltage over the spark plugs
Spark plug cables : to conduct the voltage from the distributor to the spark plugs
Spark plugs which generates a spark and ultimately ignites the fuel/air mixture in the ignition phase of the cylinder
Magneto ignition
In many general aviation aircraft, the ignition system uses magnetos. A magneto is a self-contained ignition generator that produces high voltage for the spark plugs as long as the engine is turning. This makes the ignition system independent from the aircraft battery, alternator and master switch during normal running. Also we have some redundancy in if there is a problem in the L magneto circuit, we can run on R and still land the aircraft safe and sound. However, using one of two magnetos will result in a ~10% performance loss.
The magnetos are connected with gears to the crank shaft, the main shaft of the engine that rotates and is connected to the propellor, and they rotate within a coil. A rotating or moving magnet inside a coil produces electrical current, which is delivered to the spark plugs.
The produced voltage is dependent of the turning speed of the magnet. How faster the engine runs, the more voltage is produced. When starting, the magneto turns slowly and would normally produce a weaker spark. An impulse coupling, often installed on the left magneto, stores spring energy and releases it suddenly. This makes the magneto rotate faster for a moment and retards the spark timing, helping the engine start more smoothly.
Warning
A plane which has its contact not set to off runs in standby, and a minor movement in the propellor can result in the engine running. This is called hot prop. Always set the contact to OFF and the mixture to Idle cut-off when parking a plane.
Start vibration
An alternative solution to the impulse coupling is an electrical starting vibrator or shower-of-sparks system. This uses battery power to provide a series of sparks during engine start, but it depends on sufficient battery power.
Ignition moment
The ignition must happen on the right moment to be effective. If the fuel/air mixture is not ignited at the right moment, this will work against you instead of helping you further.
Pre ignition: This is when the mixture is ignited before the normal spark timing, often by a hot spot in the cylinder. In Dutch called: “Voorontsteking.”
Detonation: This is abnormal combustion where part of the mixture explodes instead of burning smoothly after the normal spark. This causes very high pressures and temperatures and can lead to serious engine damage.
Some causes of detonation are:
High engine temperature and too less cooling
Too lean mixture
Hot spots in the engine, like a hot spark plug
Fuel with too low knock resistance or too low octane number
Pre ignition
Spark plug contamination
A spark plug that has the right working temperature, will clean itself and will be free of carbon or lead. With running stationary for a long time, the optimal temperature will not be reached and can result in the engine running too rough. This is the reason we set the engine for around 1000 rpm during taxi and stationary, which is higher than the complete idle RPM, which is around 600-650RPM.
Diesel engines and ignition
Diesel engines doesn’t have spark plugs. Diesel engines will suck air and compress this. At the end of the compression stage the diesel will be injected into the cylinder, causing it to ignite due to the high pressure and temperature. Mostly similar to gasoline-driven engines but doesn’t have spark plugs.
Ignition switch
General aviation planes have a ignition switch where we control the ignition system with. This mostly have 5 different modes:
OFF : Here the magnets are connected to the ground of the plane and disconnected from any source of power. Actually connecting the primary coil of the magneto’s to the ground (-). No sparks will be produced in this setting, during normal situations
R : Only the right magneto works in this setting
L : Only the left magneto works in this setting
Both : Both magnetos are working in this setting
Start : The starting engine is powered in this setting and only the left magneto as impulse
During the before take-off checklist, we test the magneto’s on working and stability. If one of the two is not working properly, we will confronted with this at this moment. If the engine is running on one of the two magnetos, we should get a ~10% RPM drop. If one magneto is defective, selecting that magneto can cause a large RPM drop or the engine may stop. If there is no RPM drop at all when selecting one magneto, this can indicate a grounding problem, meaning one magneto may still be live when it should be switched off.
A magneto can also be defective due to a grounding problem. During the run up, we will not see an RPM drop on one of the two separate settings. This can make the plane dangerous, and we may not park this plane without a good indication mark, as the magneto’s will be still powered. Rotating the prop even a bit can result in a possible engine start which a person will not survive. This will be minimized by disabling the engine using the mixture to idle, where no fuel is left in the cylinders and nothing to burn. This is the standard accepted way to turn off an airplanes’ engine.
Engine cooling (5)
When burning fuel, a huge amount of heat is produced. As this will increase at higher RPMs and higher throttle settings, the engine needs to be cooled. Proper engine cooling extends the lifetime of an engine. At the best working temperature, the engine runs optimally which we want. We then get the most out of the engine. Other cons of high engine temperatures are thin or burnt oil, defective pistons, spark plugs and such.
In general aviation aircraft, these types of engine cooling is being used:
Air cooling
Liquid cooling
Most aircraft use air cooling or a combination of both. Liquid cooling is often used for cylinder heads and with diesel engines.
Apart from the cooling system, excess warmth is also dispatched through oil and oil coolers. A richer mixture can help cool the engine because some excess fuel evaporates and absorbs heat. This is mainly relevant at high power settings, but mixture use must always follow the POH.
Air cooling
The cooling with air is very easy on airplanes. As air will flow through the openings at the front when flying this already has a major impact. The propellor also blows some air into the inlets at the front. Inside, most parts are equipped with big metal parts which pickup most of this air to cool and conduct the heat out. Most parts have cooling fins, making the contact-surface bigger and better cooling. Inside the engine compartment, some baffles (leiplaten) are added to redirect the airflow for optimal cooling.
Optimal cooling of the engine is reached during the cruise phase, as this redirects the most air at the highest speed into the air intakes. During climbs or running stationary the cooling will be worse.
Cowl flaps
Cowl flaps control the airflow through the engine cowling by changing the outlet area. Open cowl flaps increase cooling airflow but also increase drag. These are often used in turbo-compressor engines. These are mostly open during taxi, take-off and climb and closed on cruise. Then re-opened at landing. If a plane has any problems with cooling in cruise, they can be re-opened.
Liquid cooling
An engine can also be cooled with liquid. Liquid can reach places with tubing where air cannot flow through. However, this is another extra reservoir, radiator and pump which can be defective. Liquid cooling is also more stable, and the radiator will only be opened when the cooling liquid reaches around 80-85 degrees celcius. Also the liquid will expand when being warm and contract when its cold, so an expansion reservoir is also installed.
Engine lubrication (6)
An engine needs to be lubricated using oil. The oil has these primary functions:
Decreasing friction between parts
Decreasing temperature and wear
Cooling by conducting due to friction and burning which is called internal cooling
Transporting small parts of wear and burnt carbon particles
Securing metal surfaces from corrosion and from burnt fuel
Closing the gap between cylinder wall and piston
We can use oil in two separate ways to get oil at the right places where engines can use both simultaneously:
Pressure lubrication: Primary way, uses pressure built up by a pump to flow the oil around the circuit, reaching the crank shaft, bearings and camshaft.
Splash lubrication: Uses splashing to cool and lubricate the bottom of the pistons and cylinders and bottom of the crank shaft
Oil circulation systems
In airplane engines, we can use two different oil circulation systems:
Wet sump : In a wet sump system, oil is stored in the oil cump (carterpan), installed at the bottom side of the engine. The oil pump will pump this oil from the sump to the oil filter and then through the systems. From the engine, every droplet of oil that leaks is redirected back to this sump. This system is cheap and light and therefore used in much smaller airplanes
Dry sump : In a dry sump system, oil is stored in a separate tank. The engine has a small carter to catch oil which drops back from the engine after doing its job. A separate scavenge pump will pump the oil which reached the carter to the oil reservoir. A dry sump system needs therefore two pumps, one for the system and one to pump oil back to the reservoir. This system is mostly used in aerobatic planes, where the engine is inverted so you can fly at inverted positions without an engine that turns off.
Oil cooling
To cool the oil and regulate the temperature of the oil we have a oil cooling system, equipped after the oil pump, before the oil is pumped into the engine. This cooler is a thermostatic temperature regulator which is cooled by the cooling air which flows in the engine compartment. This also works with a bypass system, redirecting directly or via the cooling compartment. If the oil pressure is high, this will also open to always have oil in the engine.
The oil filter is a paper filter in a metal case, around the size of a can of soda and is replaced according to the aircraft or engine maintenance schedule. In many training aircraft this can be around 50 flight hours, but the exact interval must be checked in the maintenance manual.
Engine oil types
Oil consists of hydrocarbons and needs additives to lubricate the engine in a broad working temperature range. A cold engine needs to have the same lubrication as a warm engine. Oil has the following properties:
Viscocity : The viscocity of the oil states how syrupy the oil is. The higher the number, the thicker, and the more resistance of flowing, also dependent of the temperature of the oil
In plane engines, we use both single grade and multigrade oil types. Single grade has big difference in temperature ranges and multigrade is “graded” for multiple temperature ranges. In warmer conditions, an oil grade suitable for higher operating temperatures is often required. In colder conditions, thinner or multigrade oil can help during cold starts.
The indication is:
Single grade oil : oil 80 or 100
Multi grade oil : 15W50
Multigrade has the gradation in the name. During cold operations, the first number with the W describes the cold-temperature viscosity behaviour. At normal engine operating temperature, the second number describes the viscosity behaviour. In this number, the W stands for “Winter”, so Viscocity 15 during Winter (cold start) and 50 during engine operating temperature.
Oil pressure
In the oil system, the oil pressure is regulated by the oil pump which is directly driven by the engine. The oil pump delivers pressure at a very low temperature. To prevent the pressure exceeds the limits during high RPM situations, the engine contains a pressure relief valve. Via the pressure relief valve the oil will be pumped back to the carter. This flap will open at a certain pressure and stabilizes the oil pressure.
The most important indicator of the oil system is the oil pressure meter. A minimum pressure is needed to take care of having enough oil in the engine and enough cooling and lubrication.
Low oil pressures: Lead to bigger wear, high temperatures and in worst case engine failure
High oil pressures: Lead to leakage, damaged oil filter or damaged oil cooler
The normal and allowed ranges and limits are described in the POH. On the indicator, we get a good view of what is normal, too high or too low.
Too low and too high oil pressure can have similar causes, so let’s sum them up in a table:
Cause
Too low pressure
Too high pressure
Wrong oil
Too thin
Too thick
Too low oil value
Yes
No
Oil temperature
Too high
Too low
Blockage in the oil system
Yes
Yes
Defective oil pump
Yes
Yes
Defective indicator
Yes
Yes
Defective oil pressure relief valve
Yes
Yes
A high oil pressure can happen if the engine is just started and cold. The oil is too thick and will be pumped hardly into the engine. When the engine has warmed up the viscocity will lower and the oil pressure will be within normal operating ranges. An engine takes around 10-20 minutes to fully warm up every component.
Oil temperature
Next to the oil pressure, the second most important indicator of the engine health is the temperature. The temperature will decide the viscocity and the lubricating properties of the oil. High engine temperatures can be caused by:
Too much heat production in the engine, high environmental temperature
Flying at high RPM too long
Lean mixture
Too less cooling in the engine, possibly during climb
Too low engine oil-value
Defective or dirty oil cooler
Defective indicator
The oil temperature is dependent of the operating temperature in the engine. If this temperature is too high, then we can take some steps to try and resolve this high temperature by picking less RPM, flying faster for more and better airflow, riching the mixture or to open the cowl flaps.
High oil temperatures often happen with low pressure. By the high pressure, the pressure drops as the oil gets thinner. If the engine cooling is enhanced, the temperature and pressure will be normalized.
Oil usage
Every engine will use oil but the amount of oil is dependent on several factors. The oil usage will be dependent on:
Type of oil
Condition of cylinders
Condition of pistons
Condition of piston rings
A new engine which doesnt have already lubricated piston rings uses more oil. The same counts for older engines with much wear to the piston rings.
Constant Speed Propellors (7)
Constant Speed Propellors or variable pitch propellors are propellors where the angle of the propellor blades can be adjusted based on the phase of flight. Planes with this feature are equipped with a blue Prop RPM handle in the cockpit, next to the black throttle and red mixture. Pro’s of planes with this feature is that they are much more efficient, generating more thrust with less engine RPM. With the black handle, we control throttle/manifold pressure, and with the blue handle we select the propellor RPM. The governor then changes the blade angle to maintain the selected RPM within the operating limits.
Planes equipped with constant speed propellors are also equipped with a governor. This is a part in the plane that actually sets the correct propellor blade based on the handle setting.
When taking off and climbing: blades are set to full fine ( High RPM )
When cruising : blades are set to coarse blade angle ( Low RPM )
As the propellor governor tries to maintain the selected RPM, the angle of attack and drag can reduce when in horizontal flight as we go at a faster airspeed. This makes the plane setting a more coarse blade angle to increase this, making the engine run on lower RPMs than with fixed pitch propellors and having more control + efficient use of engine power.
Most blade-change systems are hydraulic, but some are also powered electrically. Hydraulic systems make use of the oil pressure to control the mechanism, so this also uses engine oil.
How this system works:
When setting the handle to Low RPM which is fully backward, the spring on the governor (the vertical pipe and part of the constant speed unit) will push on the fly weights which are those two balloons, making them fly outwards. They rotate at the crank shaft speed as a gear connects the governor to this crank shaft
The fly weights are engine RPM sensitive, making them fly outwards due to high RPM and fly inwards at low RPM due to centrifugal force
The fly weights are connected to the pilot valve, which is a valve that can complete the oil circuit to the propellor, in Low RPM settings this valve will open, at High RPM the valve will close
The propellor hub is hydraulically powered by the high pressure oil pump pushing the blade to a bigger angle.
Overloading the engine
When a high manifold pressure is combined with a low engine RPM the engine can fill up the cylinders too much, causing extreme pressure and temperature in the ignition space and can overload the pistons and crank shaft. This also increases the chance of detonation. Refer to the POH of the plane for recommended setting combinations. A simple comparison is driving a car in a high gear at low speed and pressing the accelerator hard. The engine has to work very hard at low revs.
To increase power: increase RPM first, then increase manifold pressure
To reduce power: reduce manifold pressure first, then reduce RPM
Pre-flight check
During the pre-flight check, we will check the governor operation. This can be done when the engine is running and when it is in normal operation temperature. We will set the handle over the full range for a few times and check if the RPM changes value. Doing this multiple times helps warm engine oil reach the propellor governor system and confirms that the RPM changes as expected.
Single acting variable pitch propellor
Smaller planes are often equipped with single acting variable pitch propellors, where the blade angle is controlled one-way with oil pressure. The oil pressure ensures a coarse blade angle where centrifugal forces will ensure a fine pitch angle.
Loss of oil pressure
As we already discussed, when powered hydraulically, the system uses the engine oil to function. The pitch of the blades is mechanically limited to help us in failures. In many single-engine, non-feathering constant-speed propellors, loss of oil pressure drives the blades toward fine pitch/high RPM, making it behave more like a fixed pitch propellor and keeping us able to land safely. This also needs a limited airspeed and limited engine RPM setting as the engine RPM can now be exceeded by the low propellor drag.
Leaning the engine in a Constant Speed Propellor plane
In an aircraft with a constant-speed propeller, engine RPM is controlled by the propeller governor, so RPM is not a reliable guide for leaning the mixture. Instead, the Exhaust Gas Temperature (EGT) indicator shows how hot the combustion is, which helps you find the correct fuel/air mixture. As you lean the mixture, EGT rises until it reaches peak EGT, then starts to fall. Pilots use this indication to set the mixture either near peak EGT or slightly rich/lean of peak, depending on the engine manual and operating conditions. The main reason is to get efficient combustion while avoiding an incorrect mixture setting.
Climbing with a Constant Speed Propellor plane
When climbing, and we don’t change anything to the configuration of the throttle, RPM and Mixture, the Manifold Pressure (MAP) will decrease slowly due to the lower outside air pressure.
Engine Instruments (8)
The engine is of course one of the most important systems in our aircraft. Without the engine we were not able to produce enough thrust to produce lift, and being able to fly. As we have several instruments in the cockpit that tells something about the current state of the engine at any time, we will dive into the properties of each indicator and system.
Let’s take a look at the types of engine instruments we have in our cockpit:
Pressure-indicators
Temperature indicators
Revolutions per minute (RPM) indicator
Fuel indicators
We will dive deeper into the various indication systems and what we can expect from our plane.
Color markings
All of the indicators in an aircraft are marked with colors to tells us easily if units are within limits or not. Here we can take these into account:
Green area: Normal operating range, everything healthy
Yellow area : Operating area with possible precaution but indicators can reach this in situations like take-off
Red line : Minimal and maximum value for safe use
Red area : Non-normal area and will indicate possible failures if not reacting to them
Pressure indicators
The engine indicators measuring and showing pressure are:
Oil pressure : this shows the pressure in PSI and the rate of circulation
Fuel pressure
Manifold Pressure: This shows the absolute pressure in the intake manifold after the throttle valve. It is expressed in inches of mercury (inHg) and is used together with RPM to manage power in constant-speed propellor aircraft.
Static and Dynamic pressure
Hydraulic pressure
We can indicate pressure primairily with the Pascal unit. One pascal is equal to one Newton per square meter (1 N/m²). In most cases, some older or American units are used in aircrafts:
Unit
Pascal (1 hPa = 100 Pa)
Bar
1 millibar
1 hPa
Inches of mercury
1 inHg
34 hPa
Pound-force per square inch
1 psi
69 hPa
Pressure is mostly measured by flexible metal boxes or pipes. We have two types which are mostly used:
Aneroid: This is a method where a diaphragm is used. This diaphragm is placed in a box with the pressure connected to the static pressure system with a determined amount of pressure inside the diaphragm. This diaphragm expands and contrapts based on the static pressure in the box, giving an indication by a grear connected indicator needle.
Bourdon-pipe: A bourdon pipe is a mechanical solution of measuring high amounts of pressure. This is a flexible pipe which will stretch when the pressure inside increases. This stretching movement is then transferred using a gear to the indicator needle, showing the actual state of the pipe behind.
Temperature indicators
Temperature in aviation is often measured in these three units:
Celcius (C) : This is the primary method around the world to measure temperature, which has a simple and logical scale:
0 degrees: freezing
100 degrees: cooking
Kelvin (K) : This is the temperature scale where 0 K is absolute zero, equal to -273,15 degrees Celsius.
Kelvin = Celsius + 273,15
Fahrenheit (F) : This is an American scale, where 0 degrees celcius is 32 degrees Fahrenheit
Fahrenheit = Celcius × 1,8 + 32
We get some indications about temperatures in our aircraft, telling us different things:
Cylinder Head Temperature (CHT): Measuring the temperature of the cylinder head metal. This is important because the cylinder head is one of the hottest and most stressed parts of an air-cooled piston engine and too hit CHT can lead to a rough running engine. High temperatures can be resolved by
More rich mixture
Decrease of engine RPM
Enhancing cooling, open cowl flaps or fly at a higher speed
Exhaust Gas Temperature (EGT): EGT shows the temperature of the exhaust gases leaving the cylinder. It helps the pilot monitor combustion and is especially useful when leaning the mixture. During leaning, EGT normally rises to a peak and then decreases if the mixture is leaned further. Pilots use EGT, together with the aircraft’s POH and engine limitations, to set the correct mixture
Oil Temperature: The temperature of the engine oil and so the mean engine temperature, giving us indications of possible overheating
Coolant Temperature: The temperature of the coolant fluid, giving us indications of possible overheating
Outside air temperature: This indicator measures the temperature outside of the aircraft, enables us to make TAS calculations or assess risk of ice deposits
Revolutions per minute (RPM) indicator
We have one RPM indicator per engine. In a single-engine aircraft we monitor one RPM indicator; in a multi-engine aircraft each engine has its own RPM indication.
RPM indicators show the amount of rotations the propellor makes in a minute. In planes where the propellor is mounted directly on the crank shaft, we also get the RPM of the crank shaft with this indication. With fixed-pitch propellor planes, this means engine RPM equals propellor RPM. More RPM is more power (thrust).
Some engines like Rotax have a gearbox between the crank shaft and the propellor which allows the propellor to rotate at a lower RPM than the engine. Depending on the installation, the cockpit RPM indication may show engine RPM rather than actual propellor RPM.
Propellor RPMs are often limited to around 2700 RPM in many light aircraft engines. The exact limit depends on propellor diameter, tip speed, noise, efficiency and structural limits.
RPM indicators are very often mechanically powered. A flexible cable is connected to the engine on one end. The other end is connected to the RPM indicator in the cockpit. This other end has a magnet connected to it which rotates in a copper tube. This will produce eddy currents, resulting in the copper tube rotating in the same direction. The rotation of this tube is then somewhat limited by a spiral spring.
Info
Eddy currents are electrical currents induced in a conducting material when it is exposed to a changing magnetic field, for example by a rotating magnet.
Some planes are equipped with a torque indicator as indicator for the amount of engine power. A torque meter is often used when the crank shaft and propellor are separated by a gearbox and is determined by performing oil pressure measurements in the gearbox.
Torque (Nm) = force (N) × arm (M)
Power (Watt) = torque (Nm) × angular velocity (rad/s)
If using revolutions per second: Power = torque × 2π × revolutions per second
_Nm = Newtonmeter, unit of rotation power where we multiply the amount of newton against the amount of meters (_10 N × 0,5 m = 5 Nm)
Some planes also show a percentage of the maximum power or the engine power rating (EPR), but this is mostly used on Jet airliners.
Fuel indicators
The engine indicators measuring and showing properties about the fuel are:
Fuel pressure: This shows the pressure of the fuel in the tubes to the carburetor. This is required when the plane has a fuel pump as primary circulation force, where a low fuel pressure can indicate a low tank or a defective fuel pump
Fuel quantity indicators: This logically shows how much fuel there is in a certain tank using a floating object, connected to a metal arm which is electronically powered. This is by far the most inaccurate instrument in a plane, so always do a physical inspection with a dipstick. Its also unaware of the attitude of the plane.
Fuel temperature: This indicates the temperature of our fuel and is mostly equipped in diesel aircraft. Diesel can partly freeze (waxcrystals) when under -20 degrees celcuis
Fuel flow: This measures how much fuel travels through the fuel injection system every hour. This can be used to determine our fuel calculations, and is often measured at the injector or a specfic measurement-wheel in the tubes
The electrical system in planes is being used to power the electronic devices and instruments. The electrical system and the engine are connected through several systems, such as:
Starting engine
Alternator/generator
Electrical fuel pump if equipped
Engine sensors/instruments
FADEC if equipped
All the primary components of the electrical system are (and fail in case of electrical failures):
The alternator (dynamo): The propellor to power delivery device and is the primary source of power if the engine runs
The battery : provides power when the engine is not running
Busses : One or more electrical busses where power from the alternator or battery is distributed over multiple electrical devices
Circuit breakers : Each part of the electrical system have a circuit breaker, a poppable weak link of the circuit to prevent overloading and as result damage to devices
Wires : to connect each part to each other and to deliver power
Ammeter : This indicator will show the actual power-usage/delivery
Master switch : To provide the complete electrical system power from the battery and/or alternator. This is mostly a double switch, where we can also select only the battery or only the alternator in case of failures
Avionics master switch : To provide all navigation and communication devices power from the battery/alternator
All devices which we often use are powered by this electrical circuit:
Radio’s
Navigation systems
Transponder
Turn coordinator (only electrical primary flight indicator for fallback scenarios)
Flight displays
Fuel quantity indicators
Inside lights
Outside lights (Beacon, Strobe, Nav, Taxi and Landing lights)
Pitot heat
Clock
Hobbsmeter (hour-counter on the RPM indicator, just like KM’s in a older carr)
Electrical trim
Starting engine
FADEC
Flaps
Voltage and current
Some definitions we must know when talking about the electrical system:
Current : Current is the flow of electrical charge, indicated in Ampere (A). It measures how much charge flows through a circuit per second.
Voltage : Voltage is the electrical potential difference, indicated in Volts (V). It can be compared with electrical pressure that pushes current through a circuit.
Types of power
We can have two different types of power, namely:
Direct current (DC) : In DC, the current flows in one direction. Conventional current is described as flowing from positive (+) to negative (-), while electron flow is from negative (-) to positive (+).
Alternating current (AC) : Here the electrons will switch direction periodically, which is indicated in Hertz. 400Hz means 400 switches of direction per second. In airliners, the alternating current flow hertz is 400Hz, but at your power outlet at home, 50Hz or 60Hz is being used, depending on your country.
We use both of these type of power, mostly depending on the king of application. A battery for example always delivers DC power and an alternator can deliver both. However, alternators that deliver AC power are much cheaper so we can convert that power to DC. General Aviation aircraft mostly have a DC power system of 14 or 28 volts.
Electrical circuits
An electrical circuit conststs of a source of power, like a battery or alternator and one or more users of power, connected by copper wires. Power can only flow if the circuit is closed.
In planes and cars, the negative pole of the battery is often connected to the frame, functioning as common earth. This saves a lot of wire as only the positive pole needs to be connected from the battery to the device and the negative can be picked elsewhere.
The alternator
The alternator is the primary source of power in an aircraft while the engine is running. The alternator is powered by the engine using the V-string. The battery is used to charge and to power the devices when the engine is not running and to provide power to the starting engine to start the engine and make the alternator work.
Info
I use the word Dynamo here a lot, as this is the Dutch translation and because an generator and alternator are different things. I mean with a dynamo a device that produces power.
Generator: DC dynamo
Alternator: AC dynamo
A dynamo works by a rotating magnet between static magnets. This causes the rotating magnet to spin at a very high speed, providing power using magnetic induction in a coil.
DC generator
A DC generator is a dynamo that generates DC power. This works with a stator and rotor, where the stator is a permanent magnet with a rotating coil with a lot of wires. One of the wires is shown in the diagram below:
The rotor is connected via the V-string with the engine causing it to rotate as the engine runs. This produces an induction-power which then is picked up at A.
The downsides of this construction are:
Brushes are maintenance-intensive
Low RPM is low power generation
Expensive
Most planes are because of these reasons equipped with an alternator (a AC dynamo).
AC alternator
An AC alternator works similar to the DC generator, by using magnetic induction. But the construction is somewhat different, so AC power is being produced instead of DC power. The construction is completely reversed, the magnet rotates instead of the coil. The magnet is then very often a electromagnet. The power is then picked from the stator which doesn’t rotate, making this solution more robust and less prone for failures.
Because the alternator uses an electromagnet, a small amount of power is needed to power the device. Without power no magnet can rotate. This power is called excitation current.
After the AC alternator, a rectifier unit is placed to convert these alternating current into direct current, usabe by the rest of the plane and charging the battery.
Alternator control unit
The power the alternator is producing is dependent on the RPM of the engine. To prevent damage or outages due to peaks and lows, the electrical system has a alternator control unit which is basically a voltage regulator. A device which keeps the power steady within the correct range. In many light aircraft this is around 14 volts for a 12V battery system, or around 28 volts for a 24V battery system.
The battery
The battery has the following primary functions:
Delivering power when the engine is off
Delivering excitation current to the alternator
Delivering power to the starter engine
Delivering power if alternator fails (back-up power)
Power in a battery is produced by a chemical reaction. There are different types of batteries which are indicated:
Nickle-cadnium (NiCd): Lighter with the same capacity and better resistant to low temperatures
Lithium
Sometimes we have multiple batteries to have back-up batteries or a separate excitation battery.
In most planes a lead-acid battery is used, just like in cars. This contains plates of lead submerged in sulfuric acid. This reaction between those two materials produces power, which is reversable. This means we can charge and discharge the battery, or pick power from the battery or charge it back. The battery is placed in a battery box which contains a drain for air ventilation.
Voltage and battery capacity
Batteries always deliver 12 volts or 24 volts. Because the battery must be charged by the dynamo, the voltage of the battery is always lower than the device that charges it.
The capacity of a battery is indicated as ampere-hours (Ah). A battery with a capacity of 50Ah can provide 50 Amps over 1 hour. When you halve the amps, the duration doubles (25 amps for 2 hours, 12,5 amps for 4 hours etc.)
The battery has a specific rating for this Ampere-hour, but this is the theoretical amount. The actual amount is often lower where these conditions lower the capacity:
Age
Temperature (cold = less Ah)
Ampere meter
The Ampere meter is a indication in the cockpit which shows the condition of the electrical system. This measures the amount of amps flowing through the wires. We know two different variants of this indicator:
Zero-centered : This type is often in Cessna and Cirrus planes. This measures the power from and to the battery. In the center we have the 0, and on the left -30 amps and on the left +30 amps. This must be slightly to the right to be in a healthy condition, the battery is slightly charged and the whole electrical system is powered.
Location: Between battery and bus
Load meter: This type is the total amount of power in the electrical system. The lowest amount is 0 and the highest amount is 60. When less devices are turned on, the meter shows a low value and with much devices the meter goes up.
Location: Between alternator and bus
Busses
A bus is a distribution strip, which basically is a static collection of power outlets where all devices get their power from. From the bus the power goes to the circuit breakers and then to the actual devices.
Mostly we have these busses:
Main bus
Avionics bus
Essential bus
Non essential bus
Circuit breakers and fuses
Fuses are weak links in the circuit which have the goal to break the circuit if a high power is detected. We have two types of these fuses:
Smelting fuses (right): Smelting fuses have a thin wire which can only withstand the rated power. If more power is connected, the wire will smelt breaking the link. The fuse then needs to be replaced before working again.
Cirbuit breakers (left): Circuit breakers do the same as smelt fuces but pop if a high power is detected. We can easily re-pop them back into position to make the connection again. These are often called automatic fuses
Circuit breakers have a contact with a multi-metal strip. If the power (amps) will exceed the rated limit, the metal will warm up, bending the metal and causing the circuit to break. Circuit breakers that pop must first be cooled down to connect them again. If a circuit breaker pops during flight, EASA recommends to let it disabled when its not needed for a safe resumation of the flight. For example, we can land without flaps or lights or even radio. Altough it would be nice to have them.
Relay
A relay is a electromagnetic switch. An example is a starting relay. To power the starting engine, a huge amount of power/current is needed. Turning the key to START causes a small power to the starting relay, powering an electromagnet which results in a closing of the ignition and causing the starting engine to rotate.
Electrical system disruptions
In the electrical system, two types of disruptions or failures can occur:
Disruptions where the alternator does not provide power
Short circuit where something in the system causes a short circuit with possible fire, smoke or electrical smell. This can also lead to a circuit breaker/fuse failure
The general guidelines and sympthoms for both types of disruptions are:
Low ammeter indication -> alternator error
Low voltage annuciator -> alternator error
Electrical smoke -> short circuit
Ozone-smell -> short circuit
In a case of a alternator error its recommended to land the plane at the nearest airfield as an alternator error will cause the plane to pick power from the battery. The remaining time depends on battery condition, battery capacity and electrical load. Power down unnessesary devices where possible.
The alternator can sometimes be reset by switching the master switch to off and back on.
Pitot-static instruments (10)
The pitot-static system is a system with three indicators from the cockpit connected:
Speed indicator
Altitude indicator
Vertical Speed indicator
Before looking at the instruments and probes, let’s first take a look at the different airspeeds.
Airspeeds
Airspeed in aviation can be measured in 4 different terms which sound ridiculous but this has their specific reasons.
Speed
Abbreviation
Definition
Indicated Airspeed
IAS
The airspeed shown on the airspeed indicator, based on the difference between pitot pressure and static pressure
Calibrated Airspeed
CAS
IAS corrected for instrument and position errors
True Airspeed
TAS
The actual speed of the aircraft through the surrounding air mass
Ground Speed
GS
The speed of the aircraft relative to the ground
Pitot-static instruments
The Pitot and the static port are 2 openings on a plane which measures a different type of pressure:
Pitot: Measures dynamic pressure -> Speed
Static port: Measures static pressure -> Altitude
These two components are connected to 3 of the basic 6 instruments we must have in a cockpit:
Airspeed (Ports/Analogue)
Artificial horizon (Gyro)
Altitude (Ports/Analogue)
Turn coordinator (Gyro/Electrical)
Heading/Compass (Gyro)
Vertical speed (Ports/Analogue)
Static port
The static port is an opening (mostly on the left side) that measures the static air pressure while in the air. The pressure it measures is displayed on your altitude indicator.
This opening is placed in a position where it is not directly facing the incoming airflow, so it can measure static pressure as accurately as possible. In some planes, this is integrated in the pitot-probe.
When having problems with altitude or vertical speed (like in the winter), we have a second option of static air, the alternate static port/alternate air. This takes air from the cabin. Cabin pressure is often slightly lower than outside static pressure, so the altimeter can indicate higher than the true altitude. The exact correction must be found in the POH.
In some emergency situations, if no alternate static source is available, the POH or training material may describe breaking the VSI glass to provide a static source. This makes the VSI unusable and should only be considered as an emergency measure according to training and procedures.
Position error
The static port cannot always be at the right spot on an airplane. It must measure the static pressure so it must be on the side, but speed, AoA and flaps can influence the airflow around the static port and also the static pressure. This im-perfect placement causes an error in the measurement, called the position error. This has a small influence on the measured altitude, speed and vertical speed. Also some errors caused by manoeuvres can happen. Some planes have multiple static ports to minimize these errors.
This same also applies on the pitot probe, although this only measures dynamic pressure.
Alternate static air/port
Some planes have an extra alternate static port in case the normal port is broken or something. This can be opened in the cockpit, so the air pressure of the cockpit can be used to measure the altitude, speed and vertical speed. The pressure in the cockpit is often somewhat lower than the outside air pressure, so the altitude meter can indicate too much. In the POH you can find a altitude correction table.
Pitot probe
The pitot probe measures total pressure, which is used together with static pressure to determine the aircraft’s airspeed. The airspeed shown to the pilot is called Indicated Airspeed (IAS). It basically converts the amount of air molecules going into the probe and gives this information to the Indicated Airspeed instrument in the cockpit. There it is being corrected for the static pressure to display the correct amount of knots in every situation.
When shutting down the aircraft, a red cover is placed over the pitot probe. This helps prevent insects, dirt, moisture, or ice from blocking the probe, which could cause the airspeed indicator to give incorrect readings or stop working during flight.
Airspeed is measured using both the pitot probe and the static port. The airspeed indicator compares the total pressure from the pitot probe with the static pressure. The difference between these pressures is used to display the aircraft’s airspeed. An increase of the True Airspeed also means more “thrust pressure” (stuwdruk) in the pitot probe as more air passes through it.
Pitot probe errors during blockage
The pitot probe can be blocked by ice, insects, vapor or dumbly enough by forgetting to take the cover off. The exact indication depends on which opening is blocked. If the pitot opening is blocked but the drain hole remains open, the airspeed indicator can drop to zero. If the pitot pressure is trapped, the airspeed indicator can act like an altimeter: too high in a climb and too low in a descent. When this happens, we can expect the following effects:
Airspeed Indicator
Altitude Indicator
Vertical Speed Indicator
Pitot probe - climbing
Indicates too high
Stays working normal
Stays working normal
Pitot probe - descending
Indicates too low
Stays working normal
Stays working normal
Static probe - climbing
Indicates too low
Keeps indicating a specific altitude
Keeps indicating 0
Static probe - descending
Indicates too high
Keeps indicating a specific altitude
Keeps indicating 0
Both - climbing
Keeps indicating the blockage speed
Keeps indicating a specific altitude
Keeps indicating 0
Both - descending
Keeps indicating the blockage speed
Keeps indicating a specific altitude
Keeps indicating 0
During take-off, we say the phrase “Airspeed alive” because of this check. If the airspeed is not working before rotation speed, we shouldn’t take-off either as the plane is then categorized as “unsafe to fly”.
Pitot Heat
The pitot has a heating element as this part is sensitive for ice-deposition. To prevent that the ice blocks this instrument, we have a switch in our cockpit called the Pitot heat. This enables a heating device in the pitot probe which prevents ice. This is a part which can take a lot of electrical energy, so do not use it too much when not running the engine. Pitot heat should be used according to the POH/checklist, especially in visible moisture or possible icing conditions.
Airspeed Indicator
Measuring the speed of a plane is based on measuring air pressure differences. Air has a certain pressure which is called the static pressure. As we fly through the air with speeds over 100 km/h, we also have some air flowing into the pitot probe. This is called the total pressure (static + dynamic). As the pitot-static system also knows the static pressure, it can make an easy calculation of what the dynamic pressure is, what then is converted to a readable airspeed indication on the Airspeed indicator in the cockpit.
The calculation that is made:
Total pressure - static pressure = dynamic pressure
(P total - P static = P dynamic)
As the pitot probe and the static port are both connected to the airspeed indicator-room in the instrument, here is where the actual calculation is being done. Here is a diaphragm connected to the pitot probe is being filled with the total pressure. In the house where the diaphragm is mounted is connected to the static port.
Speed needs to be corrected for the actual pressure, as dynamic pressure is dependent on the air density. This means that in air with a lower density, without correction, the indicator will be way too low. Airspeed indicators are calibrated on ISA air density, meaning 1,225 kg/m³. This means the indication is only 100% correct in cases where this air density is active.
The airspeed indicator has a minor “deviation”, due to minor incorrections in the mechanical parts and differences in air flow. These are called the instrument-errors and we can convert an indicated airspeed to the calibrated airspeed, which differences are very often about 1 to 3 knots. The calibrated airspeed is called the CAS.
So if we want to convert our indicated airspeed to true airspeed, we must go from IAS to CAS and then to TAS. Use the E6B calculator for this.
Airspeed indicator colors
The airspeed indicator has some color codings on the edge, telling you different things very easily:
Vs0: This is the speed where you get a full stall when extending full flaps
Vs1: This is the speed where you get a full stall without flaps
Vfe: This is the maximum speed where flaps may be extended
Vno: This is the maximum speed where you may fly in normal operations (low winds/laminar air)
Vne: This is the maximum speed you can fly with the plane before inducing structural damage
Some planes also can have a Statute mile indicator or even km/h meter instead of knots.
The altimeter
Altitude is expressed in feet or meters in aviation. Most planes and pilots use feet, as this is internationally accepted but some smaller aircraft also use meters.
1 ft is 0,3048 meter
1 meter is 3,28 feet
The altitude indicator is basically a pressure-meter. Air pressure decreases as we go higher, and by setting a reference, it knows exactly how far awar we are from that reference point. We have multiple reference points which we can use. The earth’s surface is not perfectly flat, and every piece of land has a different elevation (height above sea level). This is where we use different references, based on the air pressure:
Q-code
Meaning
When to use
Indication name
QNH
The pressure measured on the ground, and then converted to mean sea level
To measure the altitude above mean sea level
Altitude
QFE
The actual pressure on the ground
To measure the altitude above the ground
Height
QNE (SAS*)
The ISA pressure altitude, namely 1013 hPa or 29.92 InHg
Above the transition altitude, in the Netherlands 3500 feet
Flight Level
SAS* means Standard Altimeter Setting, 1013 hPa
In most cases, we use QNH. When QNH is set, the altimeter indicates altitude above mean sea level. On the ground at the aerodrome, it should indicate the aerodrome elevation. When QFE is set, the altimeter indicates height above the selected aerodrome reference and should read approximately zero on that aerodrome. When 1013 hPa is set, the altimeter indicates pressure altitude, used for flight levels above the transition altitude.
In flight regions we often use a “regional QNH”, which prevents us from 2 problems:
Different planes having different references, possibly leading to collisions
The need to set the QNH every several minuts if flying from low to high or high to low pressure areas
How the altimeter works
The altimeter is as said basically a pressure meter (barometer), converting a pressure difference between your reference point and the static pressure measured by the static port to an altitude number in feet. The static port is connected to the instrument-chamber where a diaphragm(s) is placed. This diaphragm(s) has a certain pressure in it and the outside pressure pushes on the diaphragm(s). As you increase in altitude, the static pressure decreases, which causes the diaphragms to expand. This is then mechanically contected to the indicator needles and showing the pilot the altitude from their reference point. The diaphragm is also known as aneroid.
You can set the reference point with the dial in the cockpit.
The altitude indicator mostly has 3 indicator needles, and works like a clock:
Big needle: Showing 100 ft scale (1000ft per rotation)
Small needle: Showing 1000ft scale (10.000ft per rotation)
Triangle needle: Showing 10.000ft scale (100.000ft per rotation)
Why does the altimeter works like this?
In modern times like 2026 it would be much easier to use proximity sensors or GPS to calculate your altitude. This doesnt work with sensors at the bottom of the airplane, as we would have a different altitude every nanosecond and as other traffic in the vicinity which we want to avoid. Also, based on knowledge and earlier incidents the aviation world agreed on the pressure-based version as pressure is always there. Even when having a engine fire, electrical error and all sorts of problems at once.
Altitude indicator errors
The altitude indicator can also have some minor errors, where the indication is not 100% correct to the actual altitude:
Instrument errors : These errors come from that every instrument has some minor deviations from actual scales. Mechanical components are dependent on friction, temperature differences and such.
Atmospheric deviations : As the atmosphere is never 100% according to ISA, we can expect the altitude indicator to not be 100% like that, the true altitude is somewhat different to the indicated altitude.
Generic instrument errors
No measuring instrument is 100% perfect, and some minor instrument errors can affect the indication:
Room and friction : The mechanism can have some room and some friction, by using high quality parts this can be minimized but is never zero.
Temperature-influence : Parts expand and contract based on the environmental temperature.
Position error : Error in the position of the probe can also affect the indication. This is especially the case with instruments measuring the pressure like the pitot probe and the static port.
Indication-delay : At fast altitude changes, the altitude indicator for example will be behind of the actual altitude. With rapid descends, the indication will be too high and with rapid climbs too low.
Pressure deviations and Altitude
According to ISA the pressure on sea level is 1013,25 hPa. If the actual pressure deviates from this pressure, an uncorrected altitude indicator will indicate a wrong altitude. This is why we have a dial and reference points.
A rule of thumb is that every decrease of 1 hPa is a 30ft difference.
This is also applicable to situations where you fly from country A with a QNH pressure of 1022 hPa to contry B with QNH pressure 1007 hPa. This causes the true altitude to decrease where your indicated altitude will still show 1500ft.
Temperature deviations and altitude
A pressure altitude meter will indicate the true altitude only in ISA conditions. If the temperature increases above ISA, the coloumn of air will expand and the true altitude will become higher than the indicated altitude. Warm air expands and causes the air pressure to drop, and as the altitude indicator is a pressure-meter, this is c=exactly the cause.
High temperature (than ISA) = higher true altitude
Low temperature (than ISA) = lower true altitude
Vertical Speed Indicator (VSI)
The vertical speed indicator will indicate if the plane is ascending, descending or in straight and level flight. This does it by indicating how much feet you descend or climb in one minute. The instrument is always zero-centered and goes up when climbing and goes down when descending. Basically following the flight path of the plane. The VSI measures the rate of change of static pressure and has a short delay from pressure change to indication in the cockpit, as it relies on measuring pressure difference with the pressure from some seconds before.
This works almost the same as the altitude indicator, by connecting the static port to the instrument, but in this instrument, the static port is connected to both the diaphragm/aneroid and the instrument-case. The air into the instrument case is filled up with a calibrated opening and delayed, so the instrument measures the pressure difference of the air according to the pressure of some seconds ago. This calibrated opening is also called the capilair.
This is also the cause of why this indication has some delay/lag, as the instrument-case is slowly filled with the air.
Instrument errors
Because the VSI is connected to the static port, and this can have errors when maneuvering and position errors, this can cause some instrument errors to this indicator. Temperature also have a minor deviation on the indication. Lower temperature cause the needle to give lower indications than with high temperatures.
The VSI also has some delay/lag as already described. This delay increases with the size of the climbd/descends you make.
Gyroscopic instruments (11)
Some aircraft instruments rely on the properties of a gyroscope. This is an efficient way to have the indicators working. In many older or traditional light aircraft, the attitude indicator and heading indicator are powered by an engine-driven vacuum system, while the turn coordinator is electrically powered. Modern aircraft can use electrical gyros or digital AHRS systems instead. This is done for redunancy, so if one system fails you still have all types of indications.
The indicators which uses gyro’s to function:
Artificial horizon (ADI)
Heading indicator (non magnetic)
Turn coordinator
We can use the Turn coordinator and magnetic compass in situations the pneumatic gyro’s are not working, and we can use the attitude indicator when the electrical gyro is not working. Clever built-in fallback.
Gyroscope properties
A gyroscope is a very fast rotating disc at speeds between 20.000 to 25.000 revolutions per minute and is used in some cockpit indicators because it has some physical properties:
Rigidity in space ( standvastigheid ) means that a spinning gyroscope wants to stay in the same position or attitude while it is rotating. Because the gyro keeps its position, it is an excellent application in an artificial horizon. In the instrument, the gyro is set level with the real horizon. As the aircraft climbs, descends, or turns, the aircraft moves around the gyro, but the gyro itself tries to stay upright. This allows the pilot to see the aircraft’s attitude compared to the horizon, even when flying in clouds or when the real horizon cannot be seen.
Precession is another important property of a gyroscope. It means that when a force is applied to a spinning gyro, the reaction does not happen at the same point where the force is applied. Instead, the reaction appears about 90 degrees later in the direction of rotation. In simple words: if you try to push a spinning gyro in one direction, it reacts in a different direction. This effect is important in aircraft instruments because it can cause small errors in gyro instruments over time. Because of this, some gyroscopic instruments need correction systems to keep them accurate.
So in short:
Rigidity in space means the gyro wants to stay where it is.
Precession means the gyro reacts in a different direction when a force is applied.
The gyroscopes are powered very often in two different ways for redundancy:
Pneumatic : This means the gyro is powered by an engine driven vacuum-pump. This pump produces a very powerful flow of air, causing the gyro disc to rotate. This is done in smaller aircraft like the Cessna 172 for the Artificial Horizon and Heading gyro’s.
Electrical : This means the gyro itself has a electrical engine to rotate the gyro disc. This is done in smaller aircraft like the Cessna 172 for the turn coordinator only.
In the cockpit we have a “Suction”/Vacuum indicator, which is this vacuum pump. This tells us more on how much we trust our vacuum-powered gyro’s.
The pump itself is driven by the engine, so the pressure itself is dependent on engine rpm. To prevent the pressure from being too low, we have a pressure regulator called the cacuum regulator to keep the pressure at a constant value. To also secure this pump, this is also equipped with a filter. The suction gauge is the pressure difference before and after the instruments and is indicated in inches of mercury (InHg) which is often around 5 InHg. Higher values give more under-pressure and a lower total pressure.
Errors in the vacuumsystem
As the vacuum-pump is driven by the engine, it can have errors:
Low indication: This can be caused by an inoperative vacuumpump, a blocked inlet filter or a defect indicator
Flying at low RPM or high altitude can also give a too low indication as the vacuumpump cannot build up enough pressure
High indication: This can be caused by an inoperative pressure regulator or blockage in the filter/regulator
When flying VFR, these errors are not that huge problems. We still have an engine pushing us forward, we still know our altitude and speed and we can continue with our magnetic compass. However, flying IFR makes a difference, as we cannot see the horizon so we don’t know our roll axis. We can use the turn coordinator as backup for banks but this is much harder as the indication is not as precise as the artificial horizon.
Gyro drift
A gyro-disc which can move freely will keep a fixed attitude in the space. In real life, some drift or wander can happen. We have three types of gyro drift:
True drift: The cause of true drift is the construction of the instrument. Due to friction in the lowers, imperfections in the construction and imbalance in the gyro and temperature-effects can cause the gyro to slowly drift from its fixed position.
Apparent drift: The gyro has a fixed attitude in the space, but this does not equal to a fixed attitude to the earth. The earth rotates and doesnt have a fixed attitude. This causes the gyro to slowly changes it attitude, which is called apparent drift, and can be maximum 15 degrees every hour, as this is also Earths rotation speed (360 degrees per 24 hours is 15 degrees per hour).
Transport-drift: The plane flies over the earths surface and also influences the apparent drift due to its movements. The size of this drift component is dependent on the speed and direction you fly to.
Attitude indicator (artificial horizon)
The attitude indicator shows the attitude of the plane based on the natural horizon. With this instrument, we know the attitude without looking outside. We can see the following parameters on this instrument:
Rolling angle
Pitch attitude
Horizon and the roll-angle of the plane
In the attitude indicator, a horizontal placed disk spins in a vertical axis.
In this way, the attitude indicator is set to a earth bound gyro. A copy of the visible horizon.
Indication errors
Pneumatic attitude indicators can have some errors while accelerating and while turning. When holding this attitude for a short while, the instrument will correct itself so it can indicate too much roll and acceleration.
During the taxi checks on the ground, we will steer left and right to check if every instrument is working correctly, but the attitude indicator must be stable and level. If this indicator moves during this check, the indicator is defective and a choice must be made to fly with it or not. When not expecting clear weather and perfect visibility, great chance its not a great idea to fly with this defective indicator. Also, we can only trust these pneumatic indicator if the suction pressure is within accepted limits.
Directional Compass/Gyro
Just like the attitude indicator, the directional gyro which we use as a copy of your magnetic compass is relying on the rigidity in space. This has a vertical disc spinning in a horizontal axis.
We have to set this compass every several minutes to the same heading as the magnetic compass to make the directional compass show the compass heading. This does not represent the true (chart) heading.
The gyro compass is much more reliable in turns and has a overall more stable indication. Magnetic compasses have turning errors and do not indicate the right heading in turns. It also doesn’t work that great in turbulent air. The gyro compass does not have the same magnetic turning and acceleration errors, but it can drift over time and must be regularly checked and aligned with the magnetic compass.
Turn coordinator
The turn coordinator gives us information about the direction and speed we make our turns. The rate of turn (ROT) is the amount of degrees per minute we change direction. We also have a “water-level” like indication if we make coordinated turns, or how to make them based on your current flight actions. The turn coordinator is sensitive to rolling and yawing movements, so the instruments does indicate turns while on the ground. This is one of the checks we do on the ground during taxi.
This instrument is the only electrical powered gyro instrument in most planes and is used as fallback when the pneumatic instruments are not indicating correctly. It also has a electrical switch/power indicator, as the instrument is powered the red block will disappear but when the power is broken, a red indication will show, telling you to not use the instrument.
The rate of turn is indicated in rates. A rate-one turn is 180 degrees in one minute, 360 degrees in 2 minutes etc.
How to use the turn coordinator
The turn coordinator shows the rate of turn, not the actual bank angle. The bank angle needed for a rate-one turn depends on airspeed. It also has a ball to show if you make a coordinated flight. A rule of thumb for this is “step on the ball”, meaning to press the pedal on the side where the ball is to get it in the middle.
When making coordinated turns, you fly with less unnecessary drag and better passenger comfort. Slipping or skidding in turns increases drag and can be unsafe, especially close to stall speed. Air will then not come from straight forward.
Slipping (slippende bocht):Too less rudder input
Skidding (schuivende bocht): Too much rudder input
Remember this sentence: Step on the ball
Summary of gyroscopic indicators
To summarize all indicators and information described above, I have made this table:
Instrument
Main purpose
Powered by
Properties
Mounted
Axis of rotation
Attitude Indicator (ADI)
Shows pitch and bank attitude
Pneumatic
Rigidity and Precession
Horizontally
Vertical axis
Heading Indicator
Shows aircraft heading
Pneumatic
Rigidity
Vertically
Horizontal axis
Turn Coordinator
Shows rate of turn and helps identify slip or skid
Electrical
Precession
Vertically/tilted
Horizontal/tilted axis
Integrated Avionics (12)
In modern aircraft, we can see more and more indicators being replaced by glass cockpits, where all of the instruments we know are being replaced by screens displaying all the needed data. The advantages of screens are pretty much that you can display anything you want and switch through different menus.
We know two types of screens:
Primary Flight Display (PFD): This shows the primary flight information, such as airspeed, attitude, altitude, heading, vertical speed and turn/slip information. It can also display things like radio frequencies, navigation information and transponder information, depending on the system.
Multifunction Flight Display (MFD): This shows mostly a digital map and all the engine instruments like RPM, ammeter, fuel flow, oil temperature and pressure. In most cases you have buttons to switch through various menus and overviews.
Under the screens we also have some fallback instruments which still work like the how older planes dit it, this is in cases the electrical system or screens fail. We then still know our speed, attitude and heading to land the plane safely.
Air Data Computer
The Air Data Computer (ADC) receives data from the pitot-static system and often outside air temperature. It converts this data into digital information such as airspeed, altitude, vertical speed and true airspeed. Engine data such as RPM, oil temperature and oil pressure normally comes from engine sensors and an engine indication system. We also have a magnetometer which senses the earth’s magnetic field and helps provide magnetic heading information. This is then converted into digital data by the AHRS, which is the Attitude and Heading Reference System.
A magnetic compass is working on the sensitiviness of earths magnetic field. With using compasses we have three different references of “north”:
True north : This is the uppermost part of the globe on our charts and mini-globes and is where the icebears live
Magnetic north : This is the northern magnetic pole where compasses point to, which is close to true north but at this moment in 2026 there is a 450+km distance between true north and magnetic north
Compass north : This is the north the compass indicates, but compasses can indicate a small error caused by imperfections and electromagnetic fields called the " deviation “.
Earth has a magnetic field around it, mainly caused by movement of electrically conducting molten iron in the outer core. This causes compasses to align with the earth’s magnetic field and point toward magnetic north. However, the magnetic north pole is somewhat different and is moving from time to time.
Magnetic north
Magnetic north is the direction a compass points to when no local interference is present. Because this magnetic field is mainly caused by movement of electrically conducting molten iron in the outer core, this point changes from year to year. At this moment in 2026 the magnetic north pole is around several hundred kilometers away from the true north pole. The angle between true north and magnetic north at a specific location is called magnetic variation or magnetic declination.
As this variation is different all over the world, we can find this in the AD information in the AIP or in apps like SkyDemon and Aeroweather. On our chart we have isogonic lines which connect different places with the same variation.
Why this is so important, is that on most places the variation will be a few degrees of, but in other places like close to the poles you can get a theoretical difference of 180 degrees between magnetic north and true north, which means you could fly to the complete opposite side if not taken everything into account.
Inclination
Inclination, also called magnetic dip, is the angle at which the earth’s magnetic field points into the earth. Near the magnetic poles, the magnetic field points much more vertically. This makes a magnetic compass less reliable, because the compass card wants to dip instead of only rotate horizontally. We can say that above 60 degrees north or below 60 degrees south, we are close to the poles and the magnetic compass becomes less trustworthy.
Compass construction
The magnetic compass which we have in our airplane is constructed with some magnets in a rotatable case. This case contains dampingfluid which helps the compass to move slowly and better move factor in turns.
This compass can have some errors due to electromagnetic fields. Also when a plane is parked in the same direction for a long time the compass can give false indications. The aircraft maintenance companies can recalibrate the compass.
Compass errors
A compass wants to line up into the magnetic field lines. Because of the inclination for example in the Netherlands, the magnet also wants to point 67 degrees down. A magnetic compass is constructed so the compass can only move horizontally. But it can have some errors:
Turning error : During a turn the magnetic compass will not indicate the correct heading
Acceleration error : During acceleration and slowing down the compass will change heading while this is actually not the case
The magnetic compass is a simple but limited device and should mainly be used in straight, level and unaccelerated flight, or in situations our gyro-based compass, avionics and other devices are not working.
Turning from north will result in a wrong but then corrected turn
Turning from south will result in a inverted turn
Turning error
The turning error will be induced by turns we make in a plane. On the northern hemisphere, this can be remembered with UNOS:
Undershoot North : when turning to a northerly heading, roll out before the compass reaches north.
Overshoot South : when turning to a southerly heading, roll out after the compass passes south.
This is because the compass lags or leads during turns, especially on northerly and southerly headings.
Acceleration errors
On the northern hemisphere, acceleration errors are most noticeable on east or west headings and can be remembered with ANDS: Accelerate North, Decelerate South. During acceleration, the compass indicates a turn toward north. During deceleration, the compass indicates a turn toward south. After the acceleration or deceleration stops, the compass indication will settle again.
End of the page 🎉
You have reached the end of the page. You can navigate through other blog posts as well, share this post on X, LinkedIn and Reddit or return to the blog posts collection page. Thank you for visiting this post.
The atmosphere is the layer around the earth, which is around 100 to 200km from the ground up. Worldwide, we use the International Standard Atmosphere which is a mean set of conditions which will be somewhat different depending on the weather conditions, location etc. This is a mean of the conditions at 45 degrees north latitude.
This page can contain a collection of personal notes, steps to remember, finished and unfinished content. Please excuse brevity.
Do not use specific information given like fuel flow, landing/take-off distances for your flights. Always refer to the POH of your exact plane for flight preparation. My information is just for references that I used.
The atmosphere (1)
The atmosphere is the layer around the earth, which is around 100 to 200km from the ground up. Worldwide, we use the International Standard Atmosphere which is a mean set of conditions which will be somewhat different depending on the weather conditions, location etc. This is a mean of the conditions at 45 degrees north latitude.
In the standard atmosphere, we use these characteristics:
0ft is at the mean sea level
The air density is 1,225 kilograms per cubical meter
The air pressure is 1013,25 hPa (millibar) or 29.92 inches of mercury (inHg)
The temperature at sea level is 15 degrees celsius
In the troposphere, the temperature decreases with 2 degrees celsius for every 1000ft up (2 degrees per 300 meters)
The tropopause is at 36.000ft (11km) and the temperature is -56,5 degrees celsius
The troposphere and stratosphere contains 78% carbon dioxide (co2) and 21% oxygen
This is a set of conditions, but some numbers can defer in the real world, due to the location or different seasons. Now, lets take a look at the different layers in our atmosphere:
Layer
Altitude
Characterstics
Temperaturegradient(ISA)
Thermosphere
280.000ft and up 85km and up
Thin air and high temperature due to solar radiation. Auroras happen in this layer
Increases with altitude
Mesosphere
160.000ft - 280.000ft 50km - 85km
Meteors burn up in this layer, coldest layer
0c to -90c
Stratosphere
36.000ft - 160.000ft 11km - 50km
Contains the ozone layer, stable air with some jet streams at the bottom
-56,5c to 0c
Troposphere
0 - 36.000ft 0 - 11km
Bottom layer at the ground of earth and where weather/clouds take place
15c to -56,5c
Let’s take a further look into every layer in depth:
Thermosphere
The thermosphere is the first layer of the atmosphere and the one with the hisgest temperatures due to solar radiation. This layer also contains aurora’s and are the best visible from the (magnetic) north pole and south pole.
Mesosphere
The mesosphere is the layer above the Stratosphere and is the layer where the ozone layer resides. This layer is the part of the atmosphere where most meteors will burn up heated from the thermosphere, the layer above the Mesosphere.
Stratosphere
The stratosphere is the layer above the troposphere and starts very cold, but at the height it is around 0 degrees celcius. This is also the layer where the Concorde used to fly to achieve supersonic speeds, due to the low air density. The layer contains some jet streams.
Troposphere
In the troposphere, the lowest layer that spans from ground to around 36.000ft up is where all weather takes place. Here are the most winds, clouds and storms. When going from the ground up into the air in the troposphere layer, the temperature will decrease by 2 degrees celsius for every 1000ft you ascend. At around 36.000ft, the temperature is around -56,5 degrees celcius.
The temperature loss happens because of the loss of radiation coming from the earth. The sun warms up the earth, and earth radiates that heat back up into the air.
Ionosphere
We also have an additional layer called the Ionosphere. This is a layer where gasses will be ionized by the high level of solar radiation. The result of this is a somewhat conductive layer of electrons and ions where HF frequencies profit from. These will follow the curvature of the earth because of this Ionosphere, where normal frequencies follow a straight line colliding to the earth after around 300km. Also GPS can get some propagation errors because of the radiation in the Ionosphere.
This collective layer lays over the upper part of the mesosphere and thermosphere, residing between 60km and 500km altitude. However, its not classified as layer in our atmosphere but one with an important goal.
The balloon in the stratosphere is obviously an AI error. :)
Air Pressure
Air pressure is a result of the mass/weight of the air. Because there is so much air above the earth which compresses close to the ground, areas with a lot of air molecues will be created. You can see this as a tower of jenga you played before. The weight of all the bricks pushes on the lower layers of bricks.
On earth we have several high pressure areas and low pressure areas which are an result of temperature differences. High pressure areas always wants to go to low pressure areas, just like when you pump up a tire and let go the vent. The air from the high pressure area inside the tyre will go to the outside, low pressure area.
In high pressure areas: cold air falls to earths surface, and cold air has more air molecules
In low pressure areas: warm air from the surface rises, and warm air has less air molecules
So air pressure actually indicates the volume of air molecules in the area. The higher the pressure, the higher the volume of air molecules.
High pressure (H) and low pressure (L) areas are not absolute numbers, but relative to each other. For example:
979hPa (L) vs. 1013hPa (H)
1013hPa (L) vs. 1035hPa (H)
Air Pressure when elevating
When going up into the air, the air pressure will decrease like seen in the graphic below:
For reference, we will use this numbers:
Every 30 feet up in the air represents an hPa loss in air pressure
Example: 1013 hPa on sea level (0ft AMSL) means a mean pressure of 1000 hPa at 390ft altitude
As this is an exponential relationship, this will guide you through the first 10.000ft (3,048km) in altitude, after that this trick does not longer work correctly of course. Some good rules of thumb:
The sun is the engine of Earth’s weather systems. Because the sun radiates its heat onto the Eart, we have nice temperatures. Without the sun, we would live in a mean temperature of around -200 degrees celsius.
The sun radiates its warmth to the earths surface and that will warm up the air above it. This is the main reason why temperature decreases with an altitude increase (going up is going cooler).
For transport of warmth in Earths atmosphere we have different terms:
Radiation
Convection
Turbulence
Advection
Conduction
Let’s take a look at them all:
Radiation
Radiation is the transport of warmth using electromagnetic waves. This is mostly sunlight that reaches the earths and uses infrared and UV radiation. Objects and air which absorb radiation will increase in temperature.
Convection
Convection is the vertical transport of warm air caused by the differences in air density. An result of convection is (thermal) updraft, the component of how gliders can stay in the sky.
Convection happens when the layer of air above the earths surface warms up greatly, and this warmer air will rise because of the lower density. Hot air balloons fly because of the principle of convection.
Turbulence
Turbulence contains unorganized horizontal and vertical airmass movements. These are caused by several inconsistences:
The wind blowing at a certain speed while hitting non-flat objects like buildings and mountains
Windshears
Thermal instability
Fronts
Jetstreams
Also warm air can move around the atmosphere by turbulence, but the main difference is that in this case, the air density is not the main reason of transport.
Advection
Advection sounds really like turbulence, but then organized and on great scale. Advection is a result of horizontal movement of air by the wind and air pressure differences. Wind and air mass is advection.
Conduction
Conduction is the transport of warmth by using physical contact. A warm object will conduct its warmth to a colder object using conduction. Because air is not a great warmth conductor, this happens the least of all transports but in combination with Convection its measurable.
To summarize all these forms of transport:
Form of transport
Definition
Memory aid
Dutch translation
Radiation
Transport by electromagnetic waves
The sun
Zonnestraling
Convection
Transport of vertical warm air
Hot air balloon
Convectie
Turbulence
Unorganized movements of air masses
Bumpy airplane ride
Turbulentie
Advection
Organized movements of air masses
Clean airplane ride
Advectie
Conduction
Transport by physical contact
Wires
Geleiding
Greenhouse effect (Broeikas effect)
The greenhouse effect is an effect caused by sunlight going through the ozonelayer, which is a layer in the Stratosphere containing water vapor, and heating up the ozone layer.
Moisture in the Atmosphere (4)
In the atmosphere, there is a very small percentage of moisture. This is around 0 to 5% of all the air, mostly a result of water vapor of surface water. The moisture in the atmosphere is the cause of all weather types, like clouds, thunder, fog, mist and thunderstorms.
Water exists in the atmosphere in 3 types:
Ice
Water
Water Vapor
The picture below shows all the phase transitions from ice, to water and or to steam:
These terms will mean:
Freezing: a simple one, water (liquid) going to ice (solid) is called freezing
Dutch translation: Bevriezen
Melting: another simple one, ice (solid) going to water (liquid) is called melting
Dutch translation: Smelten
Condendation: Gas (steam) going to water (liquid) is called condensation. An example is a cold beer just from the fridge which becomes wet at the outside of the bottle
Dutch translation: Condenseren
Evaporation: Water (liquid) going to Gas (steam) is called evaporation. An example is a wet t-shirt on a line in sunlight. The water will use the energy of the sun to evaporate.
Dutch translation: Verdampen
Sublimation: Ice (solid) going directly to Gas (steam) is called sublimation. An example is a brick of (dry) ice where smoke (steam) will appear from
Dutch translation: Sublimeren
Deposition: Gas directly going from its steam form to ice (solid). Examples are ice on your car or plane or the white layer on grass and trees in winter days (rijp)
Dutch translation: Verrijpen
Easy to remember the terms:
Freezing happens below 0°C
Melting happens above 0°C
Condensation happens when air temperature equals dew point
Deposition happens below 0°C when air is saturated
Sublimation happens below 0°C in dry air
Evaporation happens at any temperature when air is not saturated
Relative Humidity and Dew Point
Warmer air can hold more amounts of moisture. This is because the warmer air expands and is less dense, so more room for moisture. To measure the amount of moisture in the air, we can use 2 methods:
Relative humidity
Dew point
Relative humidity
The relative humidity is a percentage that states how much percentage moisture is in the air based on the air temperature. While this is a percentage, it doesnt tell us something clear. This is because:
75% relative humidity at 30 degrees celsius will feel very humid and wet
75% relative humidity at 3 degrees celsius will feel very dry
This is because the mass of air is filled with 75% of moisture, but a higher temperature means a bigger storage of moisture. A low temperature will hold much less because its more dense. As we actually want to have numbers that tells us everything about the state outside, we have invented the Dew point.
The relative humidity is mostly the highest at night/early morning and lowest at 4 o’clock at noon.
Dew point
The dew point is an second temperature that is determined at the temperature and humidity. IIt tells us the amount of moisture in the air, by a sort of calculation from the actual temperature with an humidity percentage calculated up to 100% where the air is fully saturated by moisture. For example:
Air temperature 25 degrees celcius
Humidity is 50%
At those conditions, the relative humidity is 100% at about 13 to 14 degrees celcius
13 to 14 degrees celcius is your dew point
So the dew point tells us much more about the current air condition, and can be used to predict the height of cloud layers. Here I have a table that tells more about air temperatures and humidity and how it will actually feel:
Vapor pressure (dampspanning)
Vapor pressure is the pressure by vapor created by molecules in the air when evaporated. This is indicated in hPa. This is also one of the conditions used to calculate the relative humidity.
Vapor pressure is calculated from air temperature and relative humidity. For example:
Air temperature: 20 °C
At this temperature the saturated vapor pressure is about 23 hPa.
The actual vapor pressure is 16 hPa.
To calculate the relative humidity: (16/23)×100= ~70%
Relative humidity = ~70%
Rule of thumb cloud base with Dew Point
We have a rough rule of thumb used in aviation to estimate the cloud base:
Temperature - dewpoint / 2.5 = answer ×1.000 is the cloud base in ft above ground level (AGL)
For example, the air temperature is 25 degrees and the dew point is 7 degrees.
25 - 7= 18 / 2.5 = 7,2 x 1.000 = 7200ft AGL
Vertical balance in the atmosphere (5)
So we have horizontal movements of air masses called the wind, but we also have vertical movements. Vertical movements have also a great impact on the weather. The stability of the atmosphere decides if vertical movements happen or they are suppressed.
Stability
Stability means how the atmosphere reacts when air is pushed up or down vertically. We can have an unstable or stable atmosphere:
Unstable atmosphere: Air that is lifted keeps rising on its own, which can lead to clouds, showers, or thunderstorms. As long as the air is warmer than its surrounding air, the warm air will rise
Cloud types: Cumuliform
Stable atmosphere: Air that is lifted tends to sink back to its original level. Vertical motion is suppressed, so clouds and storms are less likely.
Cloud types: Stratiform
Adiabatic processes
When a package of air rises, it will flow to an environment with a lower air pressure. The package of air will then expand, which costs a little energy. This energy source is the temperature. Cooling using temperature is called adiabatic cooling.
An adiabatic process is a change in the temperature of air without any heat exchange with the surrounding environment. You can see this as a temperature change within this air package:
Air that sinks → is compressed → warms (adiabatic warming)
This will cause the molecules to move faster and results in a temperature rise
Air that rises → expands → cools (adiabatic cooling)
This will cause the molecules to move slower and results in a temperature decrease
As long as the air will not be saturated by water vapor, then this will be called a dry-adiabatic cooling. When the air is saturated by moisture, then this will be logically called wet-adiabatic cooling.
When dry the temperature decrease for every 1000ft in the air will be around 3 degrees celcius.
When wet the temperature decrease for every 1000ft in the air will be around 1,8 degrees celcius
At the moment the air hits the dew point, the air becomes saturated with moist, condenses and a cloud has been born. The cooling rate will also decrease because of the condensing process releases warmth. Check out this moist lifecycle. You can calculate the dew point height with this formula.
Temperature gradient
The temperature gradient is a bit different as ISA describes, because of these adiabatic processes. It can also be that the temperature rises a bit and then decreases every X ft up. This is why we always speak about mean decreases.
To visualize this exactly, we have something called the “State curve”, the graph of the actual representation of the temperature gradient.
This state curve can present 4 types of stability in the air:
Absolute instability
Absolute stability
Conditional instability
Indifferential
Absolute instability
When we speak of absolute instability, then the temperature decrease is faster than a dry-adiabatic process. This is as we discussed earlier, more than 3 degrees celcius per 1000ft (1c per 100m). In this situation, the rising air package is warmer than its surroundings, so will continuously rise because of its lighter mass.
This is also a recipe for thunderstorms if the air is saturated enough. Air will continue to rise all the way to the Stratosphere creating cumulonimbus clouds.
Absolute stability
When we speak of stability, the temperature of the atmosphere will cool down slower than a wet-adiabatic process. Here the atmosphere is stable and there is not much air rising. A possible rising package of air will cool down to its environment and will stay in its vicinity.
Conditional instability
In a conditional instable atmosphere, the temperature gradient is between wet and dry adiabatic. Here the air is stable to call it a stable atmosphere but instable enough for a wet-adiabatic process. In the real world, this is the most happening situation.
Processes that influence stability of the atmosphere
We have some processes in the atmosphere that influence the stability, mostly processes that cause warming and cooling.
Radiation inversions
The radiation inversion is when the sun heats up earths surface and the directly layered air. In the evening, the air cools down at earths surface but the air above the surface stays a bit warmer. This causes instability and is the reason fog starts at the ground in the winter/spring mornings. Basically a temperature increase in the temperature gradient, after the inversion, the temperature will decrease per ISA conditions.
Right above an inversion, the wind speeds can drastically change, as the atmosphere is a bit more unstable above the inversion.
Advection
Advection, which is horizontal transport of air, alters the stability of the atmosphere. This will do it in these ways:
Stability
Cold surface and warm air
Instability
Warm surface and cold air
The main causes of this are that a cold surface will cool the air above it. With a warm surface, the air in the lower areas will warm up, and warm air will tend to rise. This creates convection and if the air contains enough moist, clouds and precipitation.
General circulation and pressure systems (6)
The movements in the atmosphere are primarily caused by pressure differences, which are caused by temperaturedifferences. In the tropical region, there is a lot of sun during the year and gets a lot more sun than the artic regions. This creates a static pattern of air movements which is called the general circulation.
At the equator, the strong sun radiation will cause rising air, and the pressure at the ground decreases. In this ring of low pressure, called the intertropical convergention zone (ITCZ), warm moist air will rise and flows at great altitude to the north and south. After cooling and becoming dry, this dry air falls back to earth at the subtropicals, which are around 30 degrees north and south latitude. This is the line of the Saharas, canaries.
On every half of the glode, there are 3 vertical cells as seen in the picture above. We also call them circulation patterns. These patterns are there all the time, all year.
Air pressure systems
The air pressure at all places around the world is measured by weather stations. Some offices will link all those fields to each other to create a pressure map of the world. Because all weather stations have a different elevation to the mean sea level (in ISA 1013 hPa), this pressure will be calculated to this mean sea level, based on the current conditions. This gives us a new Q-code, the QFF.
QFF: Actual atmospheric pressure calculated back from ground to sea level
QNH: Sea level pressure using ISA, where on sea level the altitude should be “0”.
QNE: QNE is when we set 1013 on our altimeter. Basically the pressure altitude, which we use to fly Flight Levels
QFE: Actual pressure on the field, being 1000ft above ground level means actually 1000ft in the air
As we can see on the map, the world contains a lot of low and high pressure areas. The “H” or “L” is pointed at the center, or the highest or lowest pressure point of the area.
The curved lines you see are Isobars, which are lines with matching air pressure. The dutch KNMI will use an interval of 5hPa for these lines.
High pressure area outline
A High pressure area always have a ridge (rug) which is a extension of the high pressure area and looks like this:
Low pressure area outline
A low pressure area has a trough (trog) and means the extension of the low pressure area, again where the center of the areas at the “L” represents the area of lowest pressure:
Cols
A col (zadelgebied) is an area that is surrounded by multiple high or low pressure area’s. In this area’s the pressure differences are small. In the chart below, we could see some cols :
Argentina
Around Los Angeles
South Africa
Japan
Being in a col, you can expect light and variable winds, as the air of the pressure area’s want to go to the lowest pressure area.
Low pressure areas defined
A low pressure area is an area with closed isobars where at the center is the area of the lowest air pressure. A low pressure area can occur where in the higher atmospheric layers divergence takes place. This means that the air compensates and starts a vertical airflow from the ground up to the tropopause. This will cause the pressure at the ground to lower as the air molecules rise up. The rising air cools down and condensation will happen what causes clouds and precipitation.
A result of the lower air pressure is, because high pressure areas will always flow to low pressure (bicycle tire), that at the ground the air will move to the center of the low pressure area. This process is called convergence.
Other words for low pressure area’s are:
L
Depression
Cyclone
Minimum
At the globe, the movement of air in a low pressure area can defer:
At the Northern Hemisphere (0 to 90 degrees north latitude), the air will move counter clockwise
At the Southern Hemisphere (0 to 90 degrees south latitude), the air will move clockwise
This circulation is called cyclonal, as it rotates the same way of a cyclone (which rotates counter clockwise at the northern hemiphere)
The cause of this difference is the Corioliseffect, a result of the globe which rotates. Air wants to go in a straight line from H to L, but as the earth rotates, these paths are curved. This is also visible at the chart above.
High pressure areas defined
In an high pressure area the pressure at ground level is higher than in the direct area. High pressure areas occur in the general circulation like the Azores islands (West to Spain). High pressure areas can also occur above a cold ground mass. This is called a thermal high pressure area. As the atmosphere cools down, the colomn of air will shrink and air will converge at high altitude. This makes the mass of air heavier and the result of this is the mass of air falling down (subsidence) to the ground. A high pressure area is now born.
During subsidence, the falling air will heat up and will clear out clouds. Generally there is better weather in a high pressure area than there is in a low pressure area, but this is no warranty.
Subsidence can also cause an inversion, which happens a lot. The inversion will stabalize the atmosphere, stopping the vertical movement of air. The result is that water vapor, dust, sand or other air-pollution can not go anywhere and hangs at low altitude. A great example is haze or smog in big cities with warm weather during a high pressure area:
At the globe, the movement of air in a high pressure area can defer:
At the Northern Hemisphere (0 to 90 degrees north latitude), the air will move clockwise
At the Southern Hemisphere (0 to 90 degrees south latitude), the air will move counter clockwise
This circulation is called anti-cyclonal, as it rotates the opposite way of a cyclone (which rotates counter clockwise at the northern hemiphere)
Winds (7)
Wind is the horizontal movement of air, caused by air pressure differences around the globe. We get air pressure differences because of temperature differences, where warm air expands and cold air contracts. Warm air causes the air pressure to become less as there are less air molecules per cubical meter and cold air causes the air pressure to become higher as more molecules will be there.
The wind is always measured in the direction where the wind comes from. In aviation we use a degrees measurement, where the number is always rounded to the closest interval of 10.
A northern wind means the wind blows from north to south, and the wind will come from 360 degrees (we don’t count “0”.)
A south western wind means the wind blows from the south west to the north east and wind will come from 230 degrees
The windspeed is measured in knots which represents the amount of nautical mile per hour. The wind measured is a mean wind direction over a period of 10 minutes. With small winds, 3 knots or even lower, this could be indicated as “variable”. Gusts are momentary and more powerful forces of the wind and are indicated at the METAR if 10 knots or more above the mean windspeed.
We also have wind power indications, which are based on the beaufort scale but is not used in aviation as its not linear and not precise enough as you can see here:
Beaufort force
Description
Wind speed (km/h)
Wind speed (knots)
0
Calm
0–1
0–1
1
Light air
1–5
1–3
2
Light breeze
6–11
4–6
3
Gentle breeze
12–19
7–10
4
Moderate breeze
20–28
11–16
5
Fresh breeze
29–38
17–21
6
Strong breeze
39–49
22–27
7
Near gale
50–61
28–33
8
Gale
62–74
34–40
9
Strong gale
75–88
41–47
10
Storm
89–102
48–55
11
Violent storm
103–117
56–63
12
Hurricane force
118+
64+
You could ask yourself why we measure and indicate the wind like this. If the wind blows to the north, it would be easier to say northern wind. In aviation we want to take-off and land our aircraft from a certain runway and favorite a runway with headwind (not with tailwind). This runway has a number corresponding to the magnetic course/direction it points at. By indicating the wind like this, the number is liked pretty much to the wind direction.
For example:
If we have runway 18/36, and the wind comes from 310 -> Our favorite direction is 360 (RWY 36)
If we have runway 09/27, and the wind comes from 330 -> Our favorite direction is 270 (RWY 27)
Taking off and landing with headwind (tegen de wind in) increases our true airspeed and decreases our ground speed, making those maneuvers a lot easier as we have less speed according to the ground.
Wind can do veering and backing, which both have a certain definition:
Veering: The wind direction changes clockwise (ruimen)
Backing: The wind direction changes counter clockwise (krimpen)
This will actually say nothing about the wind speed, only the direction.
Coriolis-effect
The coriolis effect is a result of curvy winds as result of the rotation of the earth. This effect has the most presence at the poles and the less at the equator. This happens as air travels to the poles, but the turning speed there is much slower than on the equator.
Cause: The Coriolis force is caused by the rotation of the Earth. Moving air appears to be deflected because the Earth rotates beneath it.
Direction of deflection
Northern Hemisphere → deflection to the right
Southern Hemisphere → deflection to the left
What it affects The Coriolis force does not start motion, it only changes the direction of moving air.
It acts perpendicular to the direction of motion and increases with wind speed and latitude (stronger near the poles, zero at the equator).
Winds in High Pressure areas vs Low pressure areas
In this illustration, we can see several different details here about winds and high/low pressure areas. We will look at all details applying to the northern hemisphere. In the southern hemisphere, all details are reversed.
Winds in a high pressure ares rotate clockwise from the center out
Winds in a low pressure area rotate counter clockwise to the center
Winds blow parralel to the isobars at altitude, on ground this will back (krimpen)
One fact applying to the whole earth is that areas with isobars close to each other represents areas of high wind speeds. Just look at cyclones which are a low pressure area (the L south west of Iceland):
Massive wind patterns
Around the earth, we have various wind patterns that are happening on recurrence. We know art least three of them:
Mistral: Powerful, cold and dry wind happening with cold polar air
Sirocco: Southern wind, wet and warm mostly during the spring months
Bora: Powerful cold and dry wind, mostly in the winter months
Fun fact, now you know where car brand Volkswagen got their names from :)
Small circulation patterns
We also have some small circulation patterns of the wind because of small geographical situations. Think of these situations:
Sea and land-wind circulations
Mountain and valleywind
Fohn
Mountain waves
Venturi-effect
We will now describe them all and look at their characteristics
Sea and land-winds
Seawind circulations occurs when a big temperature difference exists between sea water and land. The sun will heat up land way faster than sea water and the temperature above land will increase faster. Above land, the air will rise (Convection) and results in a thermal low air pressure area, because of the air expanding due to the heat.
As the air pressure at sea becomes a bit higher and on land, a small wind will now occur. As we already know that air from a high pressure area will always flow to a low pressure area, sea wind is now created. The barrier between the cold sea-air and warm land air is called the seawind front.
Sea wind circulation mostly happens in the spring, where the sea water is relatively cool and the sun radiation is strong enough to heat up the land, creating the temperature and resulting air pressure differences. Also these winds are also affected by the coriolis effect. The winds of the sea can reach several kilometers into land (up to 50km, based on the ground resistance).
These seawinds can cause some turbulence and wind shears and on the sea, some cumulus clouds can form. Sometimes with precipitation (neerslag).
Mountain and valley winds
In the mountains and valleys, we have huge sun radioation and resulting temperature differences which cause a lot of thermal high and low pressure areas.
We have 2 definitions to know here:
Anabatic winds: Rising winds up to the tops (blue)
Also called the Windward side (loefzijde)
Katabatic wind: Descending winds from the tops to valleys (warm)
Also called the Leeward side (lijzijde)
At the Canary Islands, most islands have this as primary climate where at the north the clouds and precipitation comes to the islands but are held back by the mountains. At the south side of the islands, the weather is a lot better and more dry. To describe the full process:
Air full of moist will flow to the mountain side
The air rises, expands and cools down, called the adiabatic cooling
The air will reach the dew point
Water vapor will condensate and will result in clouds and precipitation
The clouds are pushed to the mountains and want to go up because of the Fohn effect
At the top, most of the water vapor is rained down and the air contains a lot less water vapor
Over the top, the air will fall down because of gravity
Descending air will be compressed and heated as result of the compression, called the adiabatic heating
Warm air can contain a lot more water vapor, causing the humidity to lower
Because of this, clouds will dissappear and we can enjoy the sun
Fohn effect
The fohn is a name for the dry katabatic wind that flows down from the mountain top down to the valleys. The fohn name is mostly used in the Alps to name the warm winds from the Mediterranean Sea but the effect/result is the same.
Because of this air flow, this can cause mild to severe turbulence above those mountains.
Mountain waves
Mountain waves will occur when the flow of air is pushed over a mountain ridge (bergrug). If a stable layer of air is present, the passage will back down. This causes a golf pattern which can be measured even several hunderd kilometers after the mountain ridge. Mountain waves will be caused in these conditions:
The angle between wind and mountain ridge must be around 90 degrees
A wind speed of 20 knots or more
A stable layer of air of thousands of feets around the mountain-tops
Rotor and rotorclouds
Under the mountain waves, behind the mountain ridge and somewaht under the tops, a rotor will occur. Just like what happens at a plane-wing creating lift and stalling somewhat.
This mass of air rotates under a horizontal axis and wind speeds can be massive. Upward and downward speeds can be thousands of feet per minute and causes a lot of turbulence.
In dry air, this rotor is not visible, but with humid air they can cause rotary clouds. They look innocent but can blow with a lot of winds and cause severe turbulence. They look a bit like lenses of a camera.
Venturi effect
The venturi effect is wind that is forced to flow through a narrow space, causing the wind speed to increase and the air pressure to decrease. This seems not very important, but if flying there, the altimeter can indicate a lot higher altitude than you are actually flying. This difference can be hundreds of feets.
Valley inversion
A valley inversion is just like a normal inversion, but then in mountain-rich areas. The can occur in these conditions:
When the air above a mountain ridge cools down, a downward flow of cool air will occur (katabatic wind) and will form a reservoir at the bottom of the valley
As result of advection of warm air in higher layers of air
Valley inversions have several dangers for aviation which other inversions also have, like poor visibility, thick layers of clouds and high wind speeds at the upper side with windshears and turbulence. Taking into account you are flying in a mountain-rich area can cause huge accidents which pilots must be aware of.
Wind shears
Wind shears are rapidly changes of wind speeds and directions. Wind shears can be horizontal and vertical and will affect the way the plane flies. As we need air speed, including winds, to fly we need a flow of air. But if that flow of air is interrupted instantly, our speed and or altitude can result in a major decrease. We don’t want this when taking off or landing.
Vertical windshear is the differences of wind in vertical scale. As we descend, we will getting less winds eventually resulting in a loss of airspeed and life. Our plane will descend even faster
Horizontal windshear is when the cross winds are changing rapidly, which can cause us to get of track for landing. Buildings are the most important cause of this happening. As ground resistance rises but then catching some of the winds, we can go off track
Updrafts and downdrafts are a result of convection and will have vertical winds, pulling you up or pushing you down. This mostly happens in the vicinity of thunderstorms
The 5 most important causes of wind shears are:
Front passing by
Thunderstorms
Ground resistance (wrijving) in the form of buildings, forests or obstacles
Inversions
At the top of a layer of friction (wrijving)
Results of wind shears
Wind shears can occur at every altitude, but are the most dangerous above the ground like in take-off and landing.
You know, planes fly because they have a speed in the mass of air they are flying into. This is called the True Airspeed (TAS). If we have a ground speed of 70 knots and a headwind of 30 knots, the resulting TAS is 100 knots. If that headwind suddenly changes from 30 to 0 knots, our speed will decrease 30 knots. This causes our plane to create a lot less lift, resulting in a sudden descend. You can imagine as this happens feets from the runway, this can cause severe incidents.
We speak of a low level windshear if this happends 1600ft AGL (500m) or lower.
Turbulence
The wind never flows from A to B in a horizontal line with a constant speed. By buildings, forests, obstacles, heating and instability (all called ground resistance) or different layers of air, the wind will get an unorganized flow. This is called turbulence.
Turbulence has several causes:
Thermal turbulence: Heating of earths surface with rising air causing mild turbulence (thermiek/convectie)
Mechanical turbulence: Caused by winds flowing to buildings, forests or altered by ground resistance (present in ground to 3000ft AGL)
Orographic turbulence: Turbulence caused by mountains, rotorwaves and mountain waves and can reach above the actual mountains in the area
Clear air turbulence: Turbulence caused by clear and cloudless area’s. This is caused by jet streams and mountain waves
We classify turbulence into 3 categories:
Mild turbulence
Moderate turbulence
Severe turbulence
As every type of plane is built different, so is the level of what you feel. An Boeing 737 is less likely to feel turbulence than a Cessna 172.
Types of air (8)
An air mass is a collection of air with equal temperature and humidity spanning several hundred kilometers. An air type has a area of source which is a great area with similar elevation. The mass must be long enough to stay in that area. Examples are:
Oceans
Deserts
Snow plains
The source of the air mass is deciding the results of the air type. If this is moving, the properties will change. This process is called transforming and the properties will change from the source of air to its transfomed state.
The area’s of source which decide the weather in the Netherlands (and the rest of Europe) are:
Atlantic ocean
Siberia
North Africa
Definitions of air types
We have some definitions for different air types which we call in a certain abbreviation:
The geographic source of air
Maritime (Air comes from water)
Continental (Air comes from land)
The thermodynamic layout of the air
Arctic air (AL)
Polar air (PL)
Tropical air (TL)
An combination of these is used when we say the cold eastern wind in the Netherlands is cPL. Continental, polar air.
A full table of all possibilities and definitions:
Air Mass Type
Season
Characteristics
Weather
cAL (continental Arctic)
All year, except in summer
Cold air mass
Stable weather (cold, dry air)
mAL (maritime Arctic)
All year, except in summer
Cold air mass
Cold, often unstable weather; stormy winds. Showers. Good visibility
cPL (continental Polar)
All year
In summer warm air mass (CM), in winter cold air mass (CM)
Dry air. In winter very cold, in summer very warm. Little cloud cover
mPL (maritime Polar)
All year
In summer cold air mass (CM), in winter usually warm air mass (WM), sometimes CM
Moderate temperatures, humid. In KM: cumuliform clouds with showers. Good visibility
cTL (continental Tropical)
All year, but mainly in summer
Usually warm air mass (WM); in a warm summer sometimes CM
Warm and dry. Little cloud cover. Due to dust content, visibility often moderate or poor
mTL (maritime Tropical)
All year
Usually warm air mass (WM); in a warm summer sometimes CM
Warm and humid. Layered clouds, possible drizzle; mist. Especially in summer (CM) thunderstorms. Due to high humidity visibility moderate or poor
CM = cold mass WM = warm mass *Abbreviations in Dutch
Air masses
Because of cold mass will be heated and warm mass will be colled down, this can have some consequences for the vertical stability in the atmosphere. They can result in precipitation, clouds and fog.
If a mass of air on 1,5 meters is colder than on the ground, we speak of a cold mass
If a mass of air on 1,5 meters is warmer than on the ground, we speak of a warm mass
Property
Cold Mass
Warm Mass
Stability
Unstable structure
Stable structure
Wind
Gusty
Steady
Wind change with height
Little
Considerable
Turbulence
Light to moderate
None or very light
Clouds
Cumuliform, convective
Stratiform
Precipitation
Showers, possibly thunderstorms and hail
Drizzle, light snow
Visibility
Good outside precipitation
Moderate to poor
Clouds and precipitation (9)
Clouds will occur when warm rising air is cooled down by adiabatic processes. By cooling down air, the water vapor will condensate to water which is the cloud itself and can be in the form of rain. Because warm air can hold more moist, all of this moist is colled down and a cloud is born.
The condensation process
Condensation occurs when air is saturated with water vapor, so cooling to the dew point. In clean air, this happens far beyond the dew point. The proces will goes much faster if there are condensation nuclei (condensatiekernen) in the air. Types of those condensation nuclei are:
Dust parts
Sand
Soot particles
Salt crystals
Clouds appear in rising air which is cooled down by adiabatc processes, and then saturated with water vapor. If the air has condensation nuclei, this goes faster into liquid water.
Rising air movements
There are multiple causes of why air masses will rise into the air. Lets take a look at them:
Convection (thermiek): Local heating of the surface by the sun causing a part of warm air to rise and then cool doen. With enough cooling, clouds will form if the water vapor is condensating to small droplets of water. Convection happens the most at sunny summer days without clouds where the ground can warm up easily, like above sand and mountains and during the afternoon.
Forced lifting: When in a mountain-rich terrain or close to mountain waves
Low pressure areas that cause rising air movements, first converging air and then rising into the air
Influence on stability
The type of clouds generated is dependent on the stability of the atmosphere.
In an unstable atmosphere with much vertical movements this will cause cumuliform (stacking) clouds
In an stable atmosphere with much vertical movements this will cause stratiform (layered) clouds
Condensation level: with decreasing air pressure when going up, the dew point will also decrease. This decrease is about 0,6 degrees celcius every 1000ft.
Every 400ft up, the temperature and dew point will come together by 1 degree celcius.
Fundaments of clouds
As result of condensation of water vapor, there will be a lot water droplets (0,01 to 0,1 mm). These droplets will stay liquid if they stay above 0 degrees. Under 0, they can freeze but will most likely not be directly. Most water dropleys will freeze after being -12 degrees celcius, after being undercooled water. This is water that is under the freezing point, but not freezing because of moving or not enough oxygen.
There are clouds like the cirrus which only are made of ice crystals because of the altitude where they reside. Water droplets and crystals are called cloud elements.
Clouds that are completely made of liquid water are called water-clouds. If clouds are partly made of water and ice, they are called merged clouds. For ice clouds, they are logically made up of ice.
Categorization of clouds
Clouds are categorized into 3 levels based on their altitude and they partly get the name from the height and then a suffix of the cloud type.
Here I have generated a nice legenda which contains the most occuring types of clouds and their altitudes to better map them and give a better understanding than a table:
A good rule of thumb is that Cumulus clouds are formed by convection (unstable atmosphere), and Stratus type clouds formed by stable atmosphere
Cloud types (own pictures)
To train my eye a bit better, I went through my picture gallery and searched if I could find the cloud types in my pictures which was really fun to do. I always liked to take pictures of clouds and sunsets because they can sometimes be a piece of art.
Cumulus (Cu)
Here I have a picture full of cumulus (stacked in Latin) clouds, everybody seen them a lot during summer days:
Immediately gives away why they are called “cumulus”. They are stacked/cumulative clouds.
Nimbostratus (Ns)
Very boring rain clouds, which everybody seen a lot in their lives:
Nimbostratus clouds can be present on any layer, but from the ground we see the lower part only. These are clouds which drop water and can be present in a warm-front.
Stratus (St)
These clouds are called “stratus”. This is latin for “layered”.
This is a clear and big layer of the same level clouds in the low altitude region.
Altostratus (As)
The altostratos is a combination of “alto” which means high altitude and “stratus” which means layered in Latin. This gives us high-layered clouds:
Altostratus clouds are mostly present when a warm-front is near and coming.
Altocumulus (Ac)
The altocumulus clouds are a combination of “alto” which means High and “cumulus” which means stacked in Latin. They look like this:
There are multiple types of clouds in this picture, but the most are altocumulus. These are the small clouds in groups. They can indicate some instability on medium height but are not a direct danger for flying VFR.
Cirrus (Ci)
Cirrus means “hair” in Latin, and are the thin and high level clouds you see often during the summer. They are mostly ice crystals because of their high altitude.
The so-called “chemtrails,” like seen in the picture above which are actually frozen water vapor resulting from aircraft burning fuel, are part of cirrus clouds.
Cumulonimbus (Cb)
The mother of all clouds, present in all 3 layers and the most dangerous clouds for the ground and aviation are cumulonimbus clouds. These can span from around 1.000ft up to the end of the troposphere and are clouds containing thunder, heavy rain, heavy winds(shear) and hail.
Here we have a big one, photographed from a plane at 37.000ft above Portugal in rain season. Not knowing about the dangers of this cloud type back then but thought it was really cool.
This one is from a summer evening with predicted thunderstorms within 15 minutes. It does show a nice view with the collided cloud layer at the top, all the way to the ground surface with already ongoing precipitation. Minutes after taking this picture, heavy rain was falling and some thunders too.
In aviation, the general guideline is to stay away at least 15-20 NM from these type of clouds, even with a Airbus A380.
Towering Cumulus (TCU)
A towering cumulus is a cumulonimbus in a developing stage. A cumulus cloud which is building up, and looks like a cauliflower at the top. In METARs this is also described as TCU at the cloud type definition.
Precipitation and occurence
Precipitation means neerslag in Dutch and is everything that falls out of the clouds onto the ground. Think of:
Drizzle (motregen)
Rain
Snow
Snow grains (motsneeuw)
Snow pellets (Korrelsneeuw)
Hail (hagel)
Precipitation occurs when the cloud elements expand due to several reasons into bigger precipitation elements, which will be heavy enough to fall down due to gravity. A cloud always contains water vapor, but only when this vapor is combined into bigger water droplets, they will reach the ground.
Precipitation and cloud types
To further clarify which precipitation we could expect from a certain cloud, let’s take a look at this table:
Precipitation type
Dutch
Cloud origin
Drizzle (DZ)
motregen
Stratus(St)
Rain (RA)
regen
Nimbostratus(Ns) or Cumulonimbus(Cb)
Snow (SN)
sneeuw
Nimbostratus (Ns) or Cumulonimbus(Cb)
Snow grains
motsneeuw
Stratus (St)
Snow pellets
korrelsneeuw
Stratocumulus (Sc) or Cumulus (Cu)
Hail (GR)
hagel
Cumulonimbus (Cb)
Disappearing of clouds
Clouds can disappear in various ways and reasons. This is comparable to the disappearance of fog/mist.
Raining out: The cloud can simply rain out, losing all of its precipitation components. If no condensation will happen simultaneously, the cloud will lose all its water and dissolve.
Merging: A cloud can merge with dry air and can cause cloud elements to evaporate. This proces happens continuously because outside of a cloud, the air is not saturated. The outside of a cloud is always more dry and stopping the condensation process can help dissolving the cloud.
Heating: A cloud can also dissolve due to heating up. This helps lower the relative humidity in the cloud, and mostly will happen due to sunlight heating up the earth, and that warm air rising. This happens mostly for low-level clouds. Clouds in a high pressure area can also dissolve due to subsidy, causing adiabatic heating to dissolve the cloud.
Cloud base and coverage area
For describing the cloud base in aviation, we use 3 terms:
Type of clouds
Coverage
Cloud base altitude (AGL)
Cloud coverage
We use a coverage called in octa’s, where a visual viewer/system will look into the air and divides it into 8 parts. Then it determines how many parts are filled with clouds and makes a representation:
Code
Term
Sky condition
Okta range
CLR
Clear
Clear sky
0
FEW
Few
Nearly clear sky
1–2
SCT
Scattered
Partly cloudy
3–4
BKN
Broken
Mostly cloudy
5–7
OVC
Overcast
Fully overcast
8
Cloud base
The cloud base is the altitude above ground level (AGL), mentioned in feet (ft). This will be the lowest cloud layer.
The cloud ceiling is the altitude (below 20.000ft)which covers more than half of the sky, so broken clouds (BKN) or overcast (OVC).
If the sky cannot be seen due to fog or mist, there will be a vertical visibility mentioned in feet. This can be measured or estimated.
Thunderstorms is a phenomenon that brings huge dangers for aviation. Thunderstorms only exists in cumulonimbus clouds which bring huge rising and descending winds, turbulence and heavy rain or hail with it. The biggest threat is a thunder strike into the plane, where risks of fire or blindness can occur.
The Netherlands knows around 25 thunderstorm days per year, espexcially over land.
Cumulonimbus clouds are built upon cumulus clouds in a unstable atmosphere which can continue to grow up. We have a towering cumulus cloud type, this is a beginning stage of a cumulonimbus (Cb) which can also be seen as altocumulus castellanus (Acc), which happens with instability on mid-level. This looks like this:
You will see in an nutshell where this name comes from, a castle wall.
Thunder is a electric load from a cumulonimbus cloud. This phenomenon happens when the mass will hit the ground resulting in a flash and a very loud and sharp sound.
Layout of thunderstorms
The layout of a thunderstorm is like how the air movements will be started:
Frontal thunder: When air passes a front and is forced to rise, thunderstorms can occur if the air is humid enough and the atmosphere is unstable. This can occur in a cold or warm front
Orographic thunder: Orographic thunder occurs from the forced rise of air over a mountain
Air mass thunder: Air mass thunders are thunderstorms that are not caused by front passages. During the summer, the high levels of convection in a unstable atmosphere this type can occur. Especially above area’s of high levels of heating like sand grounds. This type is a great example of the heavy storms at the end of a warm and sunny day.
Developement stages of a thunderstorm
A thunderstorm knows 3 stages:
Cumulus stage (beginfase): Here the cumulus cloud will be expanded due to the rising air. This is only a water-cloud. If this reaches a great altitude, this will be mentioned in the weather reports as towering cumulus. A begin stage of a thunderstorm, with lots of updrafts (convection)
Mature stage: At the mature stage, the cloud will pass over the 0 degrees celcius point up in the air and the cloud has merged. In this stage, you can expect heavy rain, hail and thunderstroms, and the cloud is a passage for heavy winds from up in the air which is called updrafts/downdrafts
Dissipating stage: At this stage, the downdrafts will be the boss and because of this, updrafts will be suppressed. This stops the vertical flow of warm humid air and this is the beginning of the end of the thunderstorm. The cloud will rain out till the water is depleted, but the top of the cloud (anvil) can exists for several hours after this, as this is a cirrus cloud, containing ice crystals
The weather during thunderstorms
As the thunderstorms will occur during a unstable atmosphere, you could predict that the weather itself can also be a bit unpredictable.
During thunderstorms, you can expect these types of weather:
Heavy amounts of precipitation
High winds and turbulence, with windshears and a high frequency of gusts
Variable winds as big as 360 degrees difference
Lots of downdrafts and downbursts of thousands of feet per minutes (a Cessna 172 climbs normally between 700/1000 feet per minute, to give a scale)
Squalls, which are heavily increased winds minutes before a thunderstorm reaches you
Visibility and fog (10)
In VFR flights where we fly inder Visual Flight Rules, pilots must remain direct sight on ground and water. This is dependent on how many visibility we have in the cockpit, as we have to avoid other traffic. In aviation we can use different terms to describe the visibility:
Flying visibility (vliegzicht): The visibility from the cockpit
Ground visibility: The visibility as seen from the ground/tower
Runway visibility (RVR): On bigger aerodromes, the RVR will be reported under 2000 meters
Visibility direction
The visibility is not always exactly the same in various directions, due to fog or other phenomenons. This can also be reported in different terms to give the pilots a better understanding to avoid assumptions leading to accidents:
Prevailing visibility (overheersend zicht):This is the value of visibility over at least 50% of the horizon
Minimum visibility: This is a visibility measurement where the direction of sight is added to, for example 1800SW: this means 1800 meters in south-western direction
Measurements and instruments
To save a lot of time for airport-associates, most measurements are done automatically by instruments. Runway visibility is measured by transmissometers next to the runway, where the visibility can be seen live within seconds. However, intrepretation of automatic systems must be considered if we want to believe this 100%.
Flying visibility
The regulatory visibility for VFR is described in the rules of air space classes. The visibility for VFR that is very important is the slant visual range. This is the line of sight in front of our plane, where we look to the ground. However, when some haze, mist/fog or brume exists, this can decrease drastically.
Mist and Brume occurs
Mist and brume occurs by colling air without any vertical movement. Mist/fog will be categorized into the origin of cooling:
Cooling at cool surface
Merging
Evaporation
Radiation fog
In clear nights, the surface of the earth will cool down by heat-radiation. The air above will also cool down, sometimes even lower than the dew point. This results in condensed water vapor and this is called radiation mist. This can beup to 1000ft high, but also around 2 meters high. Then it will be called ground fog.
Advective fog
Cooling at a cold surface can happen when warm humid air will flow to an aera with cold underground. This fog will be advected. This mostly happens during winter, after a period with frost ends by a new flow of air with relative warm and humid air. This is the warm mass.
Above the sea, this type of mist is called sea mist.
Fog by merging
Merged air can also cause mist
Evaporation fog
Fog can also occur by evaporation of rain. The rain increases the humidity in cold air and this results in rain-mist.
Dissolving mist
The dissolving process of mist is exactly the same as with clouds, they can dissolve in three ways:
Heating and therefore evaporating the moist
Merging with dry air, lowering the dew temperature
Rain out
Mist vs Fog vs Brume
Mist, Fog and Brume are all terms that sounds like they mean the same, but we consider them partly different:
Dutch term
English term
Cause
Visibility
Mist
Fog
Water droplets
< 1000 m
Nevel
Mist
Water droplets
1000–5000 m
Heiigheid
Haze
Dust particles
< 5000 m
Fronts (11)
Fronts are different weather systems that collide with each other. On a location where two different masses (with different temperatures) of air will collide, there will be a transition zone which is called a “front”. A front is often referred to a zone with clouds and precipitation and therefore relevant for aviation. The weather conditions in a front are dependent on the temperature differences between the air masses, where we have some terms for:
Active fronts: these fronts consists of huge temperature differences
Inactive fronts: these fronts constst of low temperature differences
Here active fronts will let you know that they are there with lots of rain and maybe thunder where inactive fronts often go by unnoticed.
Types of fronts:
We can have multiple types of fronts, as illustrated below. The most important types are:
Warm front
Cold front
Occluded front
Stationary front
Fronts mostly consists of these components:
Surface front: This is the separation layer, the line between multiple fronts
Ground front: This is the separation layer, but then on the ground directly under the surface front
Frontal zone: This is the zone of a front as this can be up to 100km in size
Fronts in meteorologic charts
On charts, fronts will be indicated as lines with different symbols on them, mostly as seen in the picture above about fronts them selves.
Note: the high level/upper air symbols will not be filled, so the middle should be white.
Layout of a warm front
Warm air is lighter than cold air. The warm air mass will flow above the cold layer. This flowing warm air will merge with the cold air and will pull up the air, till the cold air dissappeared. This merge with the forced rise of warm air causes cooling and condensation and can cause clouds and precipitation.
As the rising movement of warm air to the surface front, this will cause condensation. This is the reason why the whole front contains closed clouds:
Source: pilotinstitute.com
Details:
Precipitation with poor visibility (drizzle)
Haze
Pressure rises at arrival, and decreases after passage
In summer this can cause cumulonimbus
Wind veeres and increases after passage
Low turbulence
Such warm front which is stable is a package of cirrus clouds, followed by cirrostratus, then altostratus and then nimbostratus, containing rain. This can also contain a hidden Cumulonimbus, which we call embedded Cb’s.
If the warm front arrives, you will start seeing some cirrus clouds, then some rain and visibility and air pressure will decrease. The winds will increase.
A warm front is slow and therefore is a period with some days of no VFR flying.
Layout of a cold front
Cold air is more dense and heavier than warm air, which causes cold air to displace warm air first at the ground. Just like the warm front, the cold front will move in the direction of the cold air.
Source: pilotinstitute.com
Details:
Pressure decreases at arrival, increases after passage
Wind increases and veeres after passage
Good visibility (when no precipitation)
Moderate to heavy turbulence and wind shears
The slope of the cold front is much steeper than the warm front. A cold front is also much faster than a warm front, passing by at a higher speed. However, cold fronts can be more dangerous as the warm air causes clouds to rise, causing towering cumulus clouds which can evantually grow into the dangerous cumulonimbus clouds.
A cold front tends to stay at ground level, pushing the warm and moist air up. This creates instability and causes the air to reach its dew point and condensate.
If a cold front arrived, the air pressure will drop, the wind will increase. Then the clouds will increase too.
Stationary fronts
Stationary fronts will stay at a certain position or will move very slowy. Sometimes even slower than 5 knots. There will be no movements, only parralel to the front. This can cause long periods of bad weather, due to the slow speed.
Source: pilotinstitute.com
A stationary front contains weather conditions of both warm and cold fronts and can take up several hours to days.
Winds mostly blow the way the front lies. Not from cold to warm or reverse.
Occlusions
Occluded actually means “hidden”.
Occlusion is where a cold front catches up with a warm front. The warm air is forced to rise off the ground, and the system becomes dominated by cooler air at the surface. This often leads to widespread cloud, steady rain, and sometimes stronger winds near the low-pressure center.
A classic example is a mid-latitude cyclone over northwestern Europe. For instance, when an Atlantic low moves toward the UK or the North Sea, the faster-moving cold front can overtake the warm front. As the occlusion forms, people often experience a long period of thick cloud, persistent rainfall, falling visibility, and a noticeable wind shift.
Then we can have cold front cllusions and warm front occlusions:
Warm front occlusions: Looks like a line with open red hemispheres on one side and closed red hemispheres on the other side
Cold front occlusions: Looks like a line with open blue hemispheres on one side and closed blue hemispheres on the other side
Upper-air fronts
We speak of a upper air front if the front-surface is only at high levels and not on the ground. This can occur when a front at the ground dissolves and turbulence merging different masses of air. This can also happen in mountain-rich areas.
Polar fronts
Weather in Europe will be dependent on two big masses of air, polar air from Greenland and tropical air from the Azores islands and north Africa. The transition layer of these two masses is the polar front, just where West europe is. In the summer, this front can be found at latitude 60 north, where Iceland and Sweden are and in the winter at 50 degrees, the line of Netherlands and England.
Frontal depressions
A frontal depression forms when cold polar air meets warmer air along the polar front. A disturbance creates a wave in the front, causing surface pressure to fall and a low-pressure area to develop. The system then forms a warm front and a cold front. Warm air is forced to rise over cold air, producing clouds, precipitation, and wind. As the depression intensifies, the cold front eventually catches the warm front, forming an occlusion, after which the system usually weakens.
The weather we can expect in a frontal depression is a warm front followed by a cold front.
Thermal depressions
A thermal depression is a low-pressure area caused mainly by strong surface heating. When the ground heats up quickly, the air above it warms, expands, and rises. This creates lower pressure at the surface and can draw in surrounding air.
A common example is a heat low over a hot desert or inland plateau during summer. In the afternoon, intense sunshine heats the land strongly, the air rises, and a shallow low-pressure area forms. This can help trigger local winds, dust lifting, or thunderstorms if enough moisture is present.
Ice build-up (12)
Ice build-up can happen on the ground and during flight. Ice on the plane is a huge risk for aircraft, as this causes the following problems:
Lift will be decreased
Weight will be increased
Ailerons and trim can freeze solid
Ice on propellors decrease thrust
Ice on propellors can cause huge vibrations
Ice on the windshield can decrease visibility
Ice can cause vibrations on antenna’s, potentially breaking them
Let’s take a look at what weather conditions this can happen.
Ice build-up formation
Ice build-up will happen if the temperature is under 0 degrees, and the air contains enough undercooled water. The most chance on undercooled water is between 0 and minus 12 degrees celcius. Mostly, ice build up will happen when precipitation, coulds, brume, fog or mist is in the air or flying into.
The outside temperature of the plane material can also be 0 degrees celcius or lower, causing any moist to freeze on contact. Especially when going from cold air into warmer and humid air.
Types of ice build up
The types of ice build up are:
Hoar frost (rijp): Freezing water vaporfrom clear unsaturated air under 0 degrees. This will be a thin layer just like on your car in winter-mornings
Rime ice (ruige rijp): Undercooled water that freezes instantly at contact on your planes’ surface, which looks like coarse (grof) ice
Freezing rain (ijzel): Undercooled water that is made of big droplets, that freeze instantly upon contact
Ice build-up in fronts:
When in a front precipitation from warm air comes into the cold air, this will then be undercooled water. This frontal investion will cause a ice triangle. In this ice triangle, undercooled water will fall in the form of freezing rain or drizzle which causes a lot of ice build up.
Because of the small slope of the front surface, the warm front is bigger than a cold front.
Ice build up in carburetor
In the carburetor, fuel is mixed with air si the engine always have a optimal mix of both. The engine will suck outside air into a narrow space, called a venturi and then in the carburetor. In this narrow space, there will be a lower air pressure (Bernoulli’s law) and the sprinkler will get fuel, which is combined into brume with the air.
The combination of the air pressure decrease and evaporating fuel, the themperature in the carburetor will decrease with temperatures up to 40 degrees celcius. This cooling can condense the water from the air, and can evantually lead to a solid freeze. This causes the engine to run inconsistent or even turn off, which we don’t want in flight.
The most chance of carburetor ice is in these conditions:
High humidity: 60% or higher
Low engine RPM
Always turn on the carburetor heat (CVV) in conditions where you have a lower RPM, sometimes in cruise, but this leads to a drop in RPM.
Meteorologic information sources (13)
Before we are going to lift of in our beautiful aircraft, we must first as part of our flight preparation, look at the weather in our area. The weather can often be predicted pretty well, but in some circumstances this can be very unpredictable.
We can use the following sources to get a good understanding of the weather during the flight:
Weather product
Description
Published by
Frequency
Where to find
Synoptic Weather Charts
Broad overview of the weather over Western Europe, including fronts and pressure systems
Dutch KNMI
Several times per day at standard synoptic times. (KNMI)
Significant Weather Charts are published by the World Area Forecast Center in London or Washington and contain charts with detailed information. This information is encoded with different icons and have their own meaning.
Significant weather charts are meant for a great overview-forecast, especially when planning international flights. These show the flight levels FL100 to FL450
Graphic Low Level Forecast
The graphic low level forecast (GLLFC) is a combinaton of the low level significant weather chart for a Flight Information Region and winds/temperatures from ground to FL100.
All the flags are windbarbs which show the wind direction and speed. It does it in this way:
The max is three of the same filled symbol, with winds above 150 knots you should ask yourself if you even want to be outside.You can see this as a weather station with a banner, it always points to the direction of wind source.
SIGWX: Significant weather
VIS: Visibility
CLD: Cloud base, octa’s, type of clouds and altitude of cloud tops
There are some other abbreviations used in this type of charts:
COT: Coastal
LCA: Local
MAR: Maritime
MON: Mountain
VAL: Valley
LAN: Above land
MTW: Mountain waves
WS: Wind shear
MOD: Moderate
SEV: Severe
Aerodrome routine meteorological report (METAR)
On controlled airfields, for the full 24 hours on a day there will be done measurements of the actual weather and published every 30 minutes. This looks like a code to new people, but still resides from older ACARS and teletext solutions used in the past.
020V080 Wind direction varying between 020° and 080°
9999 Visibility 10 km or more
FEW008 Few clouds at 800 feet
07/04 Temperature 7°C, dew point 4°C
Q1019 Pressure 1019 hPa
NOSIG No significant changes expected in the near future.
That states a lot more; meaning a cold spring day with this weather:
Source: AMS Live on Youtube
CAVOK means “Ceiling and Visibilty OK” and is only mentioned by ATIS/METARs if the following criteria are all met:
Horizontal visibility of 10.000 meters or more
Cloud ceiling 5000ft or higher
No significant weather like cumulonimbusses, towering cumulonimbusses
No thunderstorms
No ground fog/haze/brume
Measurement is not done automatically (otherwise it will be NCD meaning No clouds detected)
If one of the above criteria are not met, NSW or NSC will be used:
NSC (No Significant Cloud): no clouds below 5000 ft and no CB/TCU present.
NSW (No Significant Weather): indicates that no significant weather phenomena (e.g., rain, snow, thunderstorms) are occurring or expected. Mainly used in TAF trend forecasts.
In America we have another option: CLR
CLR (Clear): no clouds detected below 12,000 ft (primarily used in North America).
If the METAR contains any slahes ////, then the information is not measured, giving no 100% warranty on the information:
Here the wind and type of clouds is unknown, meaning that any cumulonimbus could be hiding.
METAR is actual measured weather with a trend and TAF is a forecast for the coming 24-30 hours. When departing from a controlled airfield, you are required to listen to the ATIS containing this METAR information which will be coded with a increasing letter (like Delta). When asking for the flight clearance, you have to pass on this letter as acknowledgement that you have listened the ATIS. When a new METAR is released in the meanwhile, you need to monitor the ATIS again.
A SPECI is actually a intermediate METAR, published if any significant change was measured. On military fields, this color code is being used.
TAFs
An airport with weather station also has something called a Terminal Aerodrome Forecast. This is a text-based forecast of the weather in reach (5 nautical mile range) of the airport in de coming 30 hours. We use this to plan flights more that 6 hours ahead. A metar is only valid for 30 minutes.
If needing weather information within 2-3 hours of landing at an aerodrome, use the trend of the airport
If needing weather information longer than 3 hours, use the TAF
VOLMET
A VOLMET is weather information for planes en-route. This is broadcasted on VHF frequencies which you can listen out, and are totally meant for international commercial traffic. “En vol” in French means for flight, this is the source of this name.
The VOLMET is really like an ATIS but then on route and an example is this:
“Amsterdam VOLMET weather at 1125 UTC on the 21st. Wind 050 degrees at 9 knots, varying between 020 and 080 degrees. Visibility 10 kilometres or more. Few clouds at 800 feet. Temperature 7, dew point 4. QNH 1019. No significant change expected.”
SIGMET and AIRMET
Aside from the given sources of weather information, two separate messages can be published:
AIRMET: Advises of less severe weather, but still important for flight operations.
Typically affects smaller aircraft or general aviation.
Examples: moderate turbulence, moderate icing, mountain obscuration, widespread IFR conditions.
SIGMET: Advises of severe or hazardous weather that can affect all aircraft.
Higher priority than AIRMET.
Examples: severe icing, severe or extreme turbulence, volcanic ash, sandstorms, severe thunderstorms.
In simple terms:
AIRMET = caution (important weather)
SIGMET = danger (serious weather hazard)
These messages can be received from your preparation, ATC or flight information services or your VFR navigation app like SkyDemon.
Weather radars
We also have weather radars, both on the ground and installed on some planes. Weather radars will send radio frequencies in the 6GHz band into the air, and can detect any reflections. This 6GHz band can receive precipitation elements pretty good and therefore can make a good forecast of the weather ahead. It basically sends a radio pulse into the air, and those precipitation elements like rain and snow reflects it back.
Sometimes, this causes clutter, which are false positives received by other devices or buildings on the ground but will be filtered for the greatest part.
A weather radar as a reach of around 200 to 250km, which makes it possible for the KNMI residing in de Bilt to scan the whole country and great parts around it.
Thunderstorms can also be detected as they are being measured using a different set of electromagnetic radiation detectors.
Satellite images
We can also use satallite images from the Europen Metrosat satellite. This satellite makes pictures every 15 minutes in two different types:
Visible light (VIS)
Infrared (IR)
These can be used to cross check to view which type of clouds are present and which protions are visible.
Visible light images give a great overview of the clouds. Thick clouds are lighter than thin clouds, but no difference can be seen within low and high clouds.
Infrared images will show the temperature of the clouds, where warm surfaces are darker and cold surfaces are lighter. Low clouds therefore are grey and high clouds are white.
Left: Infrared Right: Visible light
Thunderstorms are not visible on these satellite images because they look like high clouds. Satelitte images can only detect the highest point of the clouds, so we can use them but this is not our primary source.
In some countries, we have the GAFOR, called the general aviation forecast. This is a code which is valid for 6 hours, looking like a METAR but has some different coding:
GAFOR:Route A – X-RAYValidity: 21 March 2026, 1200–1500 UTC
Weather: Broken cloud layers, local rain showers, moderate visibility reduction in precipitation
Cloud base: 1,500–2,000 ft AGL
Visibility: 5–8 km, locally 3 km in showers
Wind: 220/15 kt, gusting 25 kt over higher terrain
Freezing level: 6,000 ft
Turbulence: Light to moderate below 4,000 ft
Icing: Nil below freezing level
The types/codes are given:
O – Open: Conditions are suitable for VFR along the route
D – Difficult: VFR is possible, but conditions are difficult
M – Marginal: Conditions are marginal for VFR
X – Closed: The route is closed for VFR due to weather conditions
In the Netherlands, you can use the Weather Bulletin for General Aviation from the KNMI which gives a better understanding but bigger countries work with the GAFOR, mostly bigger countries.
That was it for Meteorology.
To do
Review fronts, transitions and results
Adiabatic processes
Anabatic/katabatic processes
Coriolis effect and forces
Frontmist is caused by warm fronts and its precipitation
End of the page 🎉
You have reached the end of the page. You can navigate through other blog posts as well, share this post on X, LinkedIn and Reddit or return to the blog posts collection page. Thank you for visiting this post.
In aviation, we are mostly in environments of low air pressure. As we go further up in the air, the pressure goes down. This will have some effects on humans, where we could have hypoxia and barotrauma.
This page can contain a collection of personal notes, steps to remember, finished and unfinished content. Please excuse brevity.
Do not use specific information given like fuel flow, landing/take-off distances for your flights. Always refer to the POH of your exact plane for flight preparation. My information is just for references that I used.
Breath and effect of low blood pressure (1)
In aviation, we are mostly in environments of low air pressure. As we go further up in the air, the pressure goes down. This will have some effects on humans, where we could have hypoxia and barotrauma.
Hyperventilation and carbon dioxide-poisoning will play together with breathing and the effect on blood gasses. We will take a look into them all.
The air in the troposphere
In the Troposphere (0-36.000ft), we have an air mass that consists of the following components:
Organs and vessels in your body need energy to function properly. This energy will be generated by burning nutrients (voedingsstoffen). The process of burning nutrients is called oxidation. In this process, oxygen is used and as a result carbon dioxide which we breathe out. So the goal of breathing is to get energy.
Breathing conists of 3 phases which are in a never-ending circle:
External respiration is the process of gas exchange between the lungs and blood
The transport of oxygen and carbon dioxide from and to organs and body tissues
Internal respiration is the gas exchange between the blood and the body tissues
The functions of why we breathe are:
Transport of gasses between blood and lungs
Cel-breathing between body cells
Transport of carbon dioxide between vessels and organs and the lungs
Transport of oxygen to organs and vessels
Because we need to actually be able to inhale and exhale air, the oxygen pressure in the lungs is lower than in the atmosphere. This is because breathing requires air to move in and out of the lungs. For that airflow to happen, the oxygen pressure inside the lungs must be lower than in the atmosphere.
The most important factor of breathing regulation is the carbon dioxide pressure in the blood.
Ventilation
Ventilation is the process where due to the movements of the breast carcass air is transported from and to the lungs. The capacity of a adult is around 6 litres. The vital capacity, usable capacity and actually filled part is around 4,5 litres.
At rest, the breath frequency is around 15 per minute
Every time, around 0,5 litres of air is inhaled, called the breathvolume
When breathing, the lungs fill up with air and the air will go through the small bronchi and bronchioles in the lungbladders. These lungbladders are called the Aleovi.
Alveoli and external respiration
The alveoli is responsable for the transport of gasses. Oxygen and other gasses in the air will go through the thin wall between lung bladders and blood. Simultaneously, carbon dioxide will flow through the blood back into the lung bladders, which is actually the external respiration. The blood rich of oxygen is then pumped from the lungs to the heart and other organs through the body.
The frequency and depth of breathing is primarily controlled by the carbon dioxide concentration in the blood.
Transport of oxygen in blood and internal respiration
Oxygen in blood will be transported by a special transport-protein called hemoglobin (Hemoglobine). This is a ron-containing protein which is located in the red bloodcells. This stuff is the cause of the red color blood has.
In the exchange of gasses in the alveoli, the hemoglobin will be almost fully (97%) saturated with oxygen. This oxygen-rich blood will be pumped through the body and body tissues. In the meanwhile, the body tissues will give back the carbon dioxide back to the blood. This is a description of the internal respiration.
When hemoglobin absorbs oxygen-molecules, the color will change:
Oxygen rich blood is clearly red
Oxygen-low blood is dark red
In cases where a person has less oxygen than needed, the skin will color blue. This process is called cyanosis (cyanose). This will be visible at the fingers or lips first.
Hemoglobin and its properties
The link between oxygen and hemoglobin depends on the amount of available oxygen in the alveoli. The higher the O₂ pressure, the higher the concentration of oxygen in the hemoglobin. This link can be seen in the graphic below:
If you increase your flying altitude, the oxygen pressure will decrease. This will go slowly in the beginning of the graphic, but from around 70%, this will go very fast at the steep side of the curve. The curve can result in very fast change of symptoms.
Hypoxia
Hypoxia is a condition where a body gets too less oxygen. When exposed for the first time to an environment with low concentration of oxygen, you will not really feel a difference, because oxygen saved in the blood and body tissues can be used for a few minutes. After the oxygen supply is depleted, you will start feeling some really big differences:
Impaired judgment and visual (especially at night)
Reduced concentration
Euphoria and or Overconfidence
Headache
Dizziness
Fatigue
Shortness of breath
The chance of getting hypoxia is different for every person, but some critera:
Oxygen pressure (PaO₂) as stated in the graphic above
Exposure time to less oxygen
Oxygen usage of the body, this is linked to physical extertion (lichamelijke inspanning)
Personal condition
Better when not tired
Better when not drinking
Better when not smoking
Better when not having a too high BMI
Because of night visuals are affected first, the maximum altitude without supplemental oxygen is 5.000ft instead of 10.000ft in daylight.
Fun fact: Hypo is a definition of: “Too less”, xy is a shortened version of Oxygen.
Altitude (feet)*
Altitude (meters)*
Hypoxia Risk
5.000 ft
1.500 m
Night vision begins to deteriorate
8.000 ft
2.400 m
Mild hypoxia possible (especially sensitive individuals)
10.000 ft
3.000 m
Noticeable performance impairment
12,000 ft
3.700 m
Clear hypoxia symptoms likely
14.000 ft
4.300 m
Oxygen required (many regulations)
18.000 ft
5.500 m
Severe hypoxia without supplemental oxygen
*Based on the pressure altitude
A rule of thumb is to remember the 5.000ft at night and 10.000ft at day as lines to not cross without forms of oxygen. Above 10.000 feet, you must have supplemental oxygen for everyone on board for 30 minutes or longer. From 13.000 feet and above, supplemental oxygen is mandatory.
Other causes of hypoxia
There are some other, way less occurring causes of hypoxia:
Hypoxic: The oxygen pressure is too low
Anemic Hypoxia: This is caused by a too low capacity of oxygen transportation in blood, due to blood loss, blood donation, exposure to carbon monoxide or Anemia (bloedarmoede).
Ischemic Hypoxia: This is caused by a decrease of blood transportation to body tissues. Mostly occurring when exposed to G-forces. More on G-forces later
Carbon monoxide (CO)
Carbon monoxide is a highly poisonous gas without color or smell which arises when hydrocarbons not fully burn. Types of hydrocarbons (koolwaterstoffen) are:
Oil products
Gas
Exhaust gasses (small percentage)
Cigarette smoke (small percentage)
Carbon monoxide is highly poisonous because it wants to merge with hemoglobin. This affinity is around 200 times stronger than the affinity with oxygen. You’ll get the idea. Because of this a small percentage is needed to disrupt the flow of oxygen and unconciousness comes within minutes.
Sources of carbon monoxide
Exhaust gasses contain a small percentage of carbon monoxide. In planes and helicopters with a leak in the exhaust-system can also leak carbon monoxide. This can also leak through the cabin heating system to the cabin itself.
Symptoms of carbon monoxide poisoning
The following symptoms will happen when being in a carbon monoxide poisining:
Light headache
Hyperventilation
Sleepy feeling
Degraded decision making
Short-breathing
Tunnel vision
Seeing blurry
And every second exposed to carbon monoxide, these symptoms will increase till you die. If exposed to air with 0,1% of carbon monoxide, you could die just within 30 minutes when doing nothing.
This is why we pilots have CO/carbon monoxide detectors on board:
This is a passive detector, which only colors. If feeling one of the symphoms, look at the dot. If its dark, then open the windows and land as soon as possible. There are also active detectors available just like in your home.
Important things about Carbon monoxide and flying
Be alert when feeling light symptoms
Be alert on exhaust gasses in the cockpit
Have a CO detector, recommended is an active that makes noise if it detects something
When having symptoms or an alert that goes off, do these things:
Turn off the cabin heating
Ensure fresh air goes into the cockpit, for example by opening an window
Use supplemental oxygen if on board
Land as soon as possible, or do a precautionary landing
Call a doctor
Investigate the aircraft by a certified organization after landing
By breathing fresh air, the elimination of carbon monoxide from the body can speed up.
Hyperventilation
Hyperventilation is usually caused by stress or anxiety, leading to excessive breathing that lowers carbon dioxide (koolzuurgas/koolstofdioxide) levels in the blood, which then produces the characteristic symptoms:
Dizzyness or light headed
Short breathing
Feeling tingling in hands, legs or around the mouth
Muscle cramps or decrease in muscle power
To solve an ongoing hyperventilation, let the person breathe into a small waste bag. This will breathe in some carbon dioxide (CO₂), and will increase the CO₂, which solves the symptoms.
Hyperventilations can also happen fysiologic when fitnessing or working out. The human body will then on purpose have less O₂ in its blood and will increase the breathing rate to compensate for it. This is normal behaviour.
Expansion of closed gasses
In the human body, there are some cavities which are filled by air or gasses. With an increase of altitude, this atmospheric pressure will increase and those gasses will expand.
Complaints caused by expansion of those gasses can occur in several organs like the middle ear, paranasal sinus (neusbijholtes), the gastrointestinal tract (maagdarmkanaal) and teeth. Symptoms can be feeling little to severe pain.
Middle ear
The middle ear is linked up by the eustachian tube (buis van Eustachius) with the nasopharynx (neuskeelholte). This helps having the air pressure on the eardrum equal.
If the nasopharynx swells up by a sinus infection or hay fever, the eustachian tube can be constipated. When increasing or decreasing in altitude, this leads to a pressure difference between the middle ear and the atmosphere. This can cause the eardrum to bend in or outside.
This is why it’s not a great idea to fly if having a sinus infection because it can permanently damage your hearing.
When having this, you can get pain in your ears, pressing feeling or even cracks in the eardrums. This is called barotitis.
The eustachian tube is designed that air can easily escape through the middle ear. When climbing in a plane, most people doesnt have that much problems. The most problems are when descending, where the pressure will increase rapidly.
Barodontalgia
Barodontalgia is where teeth give a lot of pain because of the pressure difference. This pressure pushes on the teethnerves causing this pain. This goes away in time, as the pressure equals.
The circulatory system (2)
The circulatory system (de bloedsomloop) is the transportation of blood throughout the body. Blood transports oxygen and nutrients to organs and body tissues and collects garbage in the form of carbon dioxide (CO₂) and other garbage. The engine of this circulation is the human heart.
The heart is a specialized muscle which is a double pump:
The left half pumps blood around the body which is called the big circulation
The right half pumps blood to the lungs which is called the small circulation
The heart pumps around 60 to 80 times per minute at rest.
Regulation of heart rate
The heart rate will be controlled primarily by the sinus node (sinusknoop), which is a nerve node (zenuwknoop) in the heart itself. The speed where the node will fire signals is influenced by hormons like adrenaline.
Blood vessels
Blood vessels are tube-like structures in the human body where blood flows through. There are 3 types of blood vessels:
Arteries (slagaders): These carry oxygen-rich blood away from the heart through the human body. The aorta is the big body arterie that comes directly from the heart
Veins (aders): These carry blood back to the heart after the oxygen and other stuff is depleted from that blood
Capillaries (haarvaten): These are called this because those are the thinnest blood vessels. They ensure blood reaches the body tissues in cells and waste products are moved back in the blood
The coronary artery (kransslagader) is the road of blood to the heart itself.
Blood pressure
Blood pressure is the pressure of the blood vessels in the big circulation. This pressure is a result of the heart pumping in a certain speed. Blood pressure is measured in the two stages, and gives a double number. For a normal adult, the healthy blood pressure is 120/80 (mmHg or inches of mercury).
Systolic pressure (overpressure): This is at the moment of contraction (samentrekking) of the heart and reaches about 120 mmHg
Diastolic pressure (underpressure): This is the moment of underpressure between contractions where the pressure decreases to about 80 mmHg
This gives us the 120/80 healthy condition which can defer for every person.
Regulation of blood pressure
Most organs can survive some time without blood supply, but the human brain is very sensitive at variation of blood supply. This is why the human body consists of baroreceptors. These are pressure-sensors which are in the aorta and arteries which will measure the blood pressure. A low blood pressure is then corrected by increasing the heart rate or increasing the force of pumping.
Cardiovascular diseases
Cardiovascular diseases (hart en vaatziekten) are the primairy cause of death in the western world. One because its a broad term and 2 because we are not living very healthy. Incidents that could be categorized as cardiovascular diseases are:
Heart attack
Angina pectoris
Cerebral infarction (herseninfarct)
These diseases are caused by atherosclerosis, which means that the veins are full of calcic (kalk). This will then also cause bloodstols which is called thrombosis.
An heart attack and angina pectoris are coronal heart diseases. This is when the coronal veins/coronary arteries (kransslagaders) are affected. If one of the coronary arteries slits up by atheroscerosis, a part of the heart muscle will die because of a oxygen deficiency (zuurstoftekort). This is the definition of a heart attack. A cerebral infarction for the brains is the same principle.
High blood pressure
At a high blood pressure, also called a hypertension the diastolic pressure is higher than 90 mmHg and the systolic is higher than 140 mmHg. A mild increase of the blood pressure will not give symptoms, but is one of the critical causes of atherosclerose and with this other cardiovascular diseases. When having a blood pressure of 160mmHg/95mmHg or higher, you will not pass the medical certification (class 2) you need for a PPL license.
The causes of hypertension can variate between such different items:
High body weight (BMI above 25)
Unhealthy food
Not enough physical exercise (less than 150 minutes per week)
Genetic factors
Accelerations during maneuvers
During normal conditions with normal gravity, a human is exposed to around 9,8 m/s of gravity. During maneuvers, this can increase where the power on a body can heavily increase. We will call this G-forces or gravity-force. This number states the force and is a factor of how heavy you feel opposing the gravity.
G force
Description
1 G
In steady flight, you feel as heavy as you are
3,5 G
When pulling the yoke, you will feel 3,5 times as heavy as normal, feeling pushed into your seat
-1,2 G
When pushing the yoke, you will feel much lighter and will come out of your seat
Positive G (+G): Blood is pushed toward the feet. This can reduce blood flow to the brain and may cause blackout or tunnel vision, like as we learned, the brain needs oxygen to function and we disrupt this
Negative G (−G): Blood is pushed toward the head. This increases pressure in the eyes and head and can cause a red-out, where vision turns reddish
Humans usually tolerate positive G better than negative G because the blood vessels in the head are more sensitive to increased pressure. In both cases, its heavily recommended to stop your maneuver and keep the plane level.
The human brain has a oxygen storage of about 5 seconds
In fighter jets, the pilots have a special suit (g-suit) which is very tightly around the stomach and contains pressured air. This helps the flow of blood and stops it from going to the feet. They are also specially trained with breathing techniques where they can be exposed to 9G for a small time, where normal people will pass out at around 4-5g for some seconds.
The eyes (3)
Eyes of a human person are built from glass-like material, which is a clear and jelly like liquid. The inside of the eye is for the biggest part the light-sensitive retina (netvlies). At the front of the eyeball, there is a lens and iris, which is the rainbow-membrane and the diaphragm of the eye. The pupil is the central opening in the iris.
From retina to view
The eyes work realy similar to how a camera works. Light will be projected by the lens onto the retina which consists of light-sensitive cells. The signals of those cells will be transported by the eye-nerve to the brain. In the brain is the view converted to real pictures the human can see.
The iris is really similar to the apperture of a camera. In low-light area’s, it will become bigger to cach more light where it becomes smaller in light-rich area’s to compensate for the heavy amounts of light.
Cones and rods
In the human eye, we have 2 components which helps getting a good view:
Cones (kegeltjes): Are used for seeing sharp and details, but not for light. They are connected all to a single cell -> parralel
Kegeltjes -> Kleur + detail
Rods (staafjes): Are used seeing in the dark, their light-sensitivity is 10.000 times higher than rods. Cones are less great for seeing sharply as they are all connected to some cells -> serial
Staafjes -> Nachtzicht
Property
Cones
Rods
Main function
Vision in bright light and color vision
Vision in dim light / darkness
Light sensitivity
Lower sensitivity to light
Much higher sensitivity to light
Sharpness / detail
High visual acuity, good for fine detail
Lower visual acuity, less sharp detail
Neural connection
Often linked more individually, allowing precise vision
Many rods converge onto fewer cells
Best at
Seeing color and sharp details
Detecting light and movement in low-light conditions
Area of view
The area of view a human person can see is circle-formed and is around 90 degrees long to 60 degrees up.
Central viewing part
The rods are concentrated on the yellow part, called the macula lutea. The center of the yellow spot is called the fovea and only consists of cones, without any blood vessels between. There is a very small area where you can see very sharp, of around 5 degrees up and width. This is the text you are now looking at.
Peripheral visual field
In the part of the retina outside of the yellow spot, we have the peripheral visual field (perifere gezichtsveld). This part only consists of rods and you will not see very sharp in this part, but its great for seeing better in the dark. Our eyes are a combination of both things, making it all round. This part only has 10% of the sharpness of the central viewing part.
Blind spot (Optic disc)
At the part of the retina where the nerves converge and transition into the eye-nerve, we dont have light-sensitive cells. This is the blind spot, called the Optic Disk. This sits around 15 degrees outside of the view of every eye.
To test your blind spot:
Cover your left eye and stare at the cross with your right eye
Now slowly move towards the computer screen while still staring at the cross with your right eye
At somewhere around 30 centimeters inches from the computer screen, the black circle will disappear. This is the blind spot of your eye
Viewing sharpness
The visus is the rate of detail which we can see. The visus of the eye is always linked to the central viewing area. An eye with normal sharpness can separate details with the size of one arc minute (boogminuut). This is equal to:
A line of 1,75 mm thick at 6 meters distance
This is called visus 6/6, 20/20 or 100%. Young children can have even more than 6/6 or 100%.
The sharpnmess is dependent on several factors:
The amount of light, too much or less light means no sharpness
The contrast of the object
The refraction status, which is weaker in two conditions: nearsighted and farsightedness
Accomodate
Accomodating means setting your eye sharp. The lens of the eye can make itself ball or flat, respectively for seeing close by or far away. This proces is a lot harder from 40 years old where this completely stops around 65 years old. This is called presbyopia.
Refractive errors
Some people have a different shape eyeball, which means no sharp vision can be projecten onto the retina. The most occurring types are:
Myopia: Nearsightedness. You can see nearby objects clearly, but distant objects look blurry. (Bijziendheid)
Hypermetropia: Farsightedness. You can see distant objects more easily, while nearby objects may look blurry. (Verziendheid)
Astigmatism: A common vision condition where the eye is not perfectly curved, causing blurred or distorted vision at different distances.
Having such errors can speed up the presbyopia process when becoming older.
Depth-perception
To estimate distances between objects as person, we need to see sharply in the distance. The brain will use both binocular as monocular reference points to convert visual information to a three-dimensional vision.
Binocular: using both eyes
Monocular: using one eye
Stereopsis
Stereopsis is the process your brain takes to combine two slightly equal visions into one big vision. Its making a panorama-picture realtime, the whole day long.
Night vision
For seeing properly in low light environments, we use the rods in our eyes. The cones are barely adding something to this in low level environments.
The rods are outside of the yellow spot, thus the central vision, which is the reason you sometimes have to look about 5 to 10 degrees away from an object in the dark to actually see it.
Dark-adaption
For the most effective night vision, the rods have to adapt themselves to the darkness. This can take up to 30 minutes and will make a human eye about 1 million times more light sensitive. This is the reason when flying in the dark, the lights on board are also dimmed greatly. In case of emergencies, we dont have to adapt our eyes to the darker environment outside of the plane.
In the first 10 minutes, the cones will be more sentitive but the rods will take over after that. The speed depends on the first and second environment. How bigger the difference is, how longer the adaption takes.
Light-adaption
Light adaptation is much faster than dark adaptation because the eyes are adjusting to light that is already available. At night flights, the cockpit and cabin lights are mostly red to not expose too much blue light. Blue light makes the light/dark adaption proces longer.
Eye defects
We have some bugs that people can have with their eyes:
Cataract (Staar): A defect where the lens of the eye becomes cloudy, causing blurred or dimmed vision (mostly happening above 45 years old)
Glaucoma: A group of eye diseases that damage the optic nerve, often linked to high pressure in the eye, and can lead to vision loss
The hearing (4)
The hearing organ consists of 3 parts
The outside ear
The middle ear
The inside ear
Lets take a look at this picture:
Outside ear
The outside ear is the outside part containing the ear-auricle (schelp), the ear canal and the eardrum. The auricle catches sound and will lead that into the ear canal. This will cause the eardrum to vibrate and convert the signals to the brain.
Middle ear
The middle ear is a air-filled hollow pipe connected to the Eustachain tube and this tube is connected to the nasopharynx (neuskeelholte). With this connection, the pressure can be similar in both the inside and outside ear.
The cochlea is the actual hearing organ, which is filled with moist. The vibrations of the eardrum will transported to the cochlea using some small bones. In the cochlea, some vibration-sensitive hairs are available which move with the sound and this transfers to the ear-nerve to the brain.
We also have the vestibule, which is the organ of equilibrium (evenwichtsorgaan).
Inside ear
The inside ear consists of the Cochlea and the Vestibule and can witness turning increases, linear increases and sound.
Sound waves
Sound is fast air pressure changes which the hearing organ can witness. These air pressure changes are called sound waves and are indicated in Hertz (Hz). 1 Hertz means one vibration per second, where human speaking sits from 500Hz to 3000Hz
The amplitude of the sound means how loud the sound is, measured in Decibel (dB). The decibel ratio is exponential, where every 3dB increase means twice the amplitude.
Ear defects
The ears and soudn transported to the brain can decrease over time. We have multiple types of defects:
Conductive hearing loss (geleidingsverlies): This means when the cause sits in the ear canal, ear drum or middle ear
Perceptive hearing loss (perceptief gehoorverlies): This means when the cause sits in the cochlea or ear-nerve. This is mostly permanent and contains noise induced (NILH) and elderly loss of hearing (presbyacusis)
When exposed to high levels of sound, the sound will increase the hearing threshold. This means you temporarily perceive this louder sound somewhat more quiet, indicating that your ears will start hearing loss.
Wearing a headset in a single engine plane prevents you from having hearing defects and will make you communicate much better than shouting.
Balance and air sickness (5)
In the inside ear are 2 organs located:
Cochlea: already discussed, organ which processes your hearing and sounds
Vestibule: the balance organ
The vestibule itself also consists of 3 parts:
Utriculus: a bladder filled with moist and otoliths
Sacculus: also a bladder filled with moist and otoliths
Semi circular canals: These are three canals filled with moist, 1 is horizontally and 2 vertically
Otoliths
The otolith organs consists of 2 groups of hair cells which will be covered by a gelatined layer. At the outside, there are some calcium carbonate crystal which are the actual otoliths itself.
These two groups each have their weaknesses:
The horizontal otolith is sensitive for horizontal speed changes (left, right, front, back)
The vertical otolith is sensitive for vertical speed changes (up, down)
These organs detect linear speed increases. The otoliths have a higher density than the moist around, they will glow a little bit behind. The hair cells will move similarly and this gives us the feeling of moving.
Semi-circular canals
The semi circular canals are the three “half-circles” you see at the ear schematic. These canals are filled with fluids where one lays horizontally and the other two vertically. These canals detect angle speed increases as they both make an angle of 90 degrees and can detect rotations around all three axis:
Roll
Pitch
Yaw
When the head rotaties, the fluid will have a short latency because of mass-slowness. The movement of the fluid will be picked up by the small vibration hairs. If the rotation speed will stay the same, the feeling will disappear after a while when the fluid is stabilized.
Both the Otolith and semi-circular calans have a perception threshold, which must make a speed increase to notice. If the fluids don’t move at all, we can get illusions, like we don’t percept movements at all. The balance-setting will be applied when no speed increases are being percepted.
The balance-organ is not designed to feel a difference in gravity and centrifugal force.
Semi circular canals are sensitive for angular accelerations (hoekversnellingen/draaiversnellingen).
Air sickness (also called travel sickness)
Air sickness is a movement sickness which is really similar to car sickness. It is primairily caused by contradictory information from seeing and feeling in your body. Flying with people that cannot see the horizon can also cause this.
Symptoms of air sickness are:
Nausea (misselijkheid)
Throwing up
White-face
Transpiring (cold sweat)
Heart-poundings
Hyperventilation
Sleepyness
Air sickness can hugely decrease the normal functions of a human person. Good to know as pilot.
Air sickness is less common for people like pilots as they control the plane and are in sync of what they see, do and feel. Focussing on controlling a plane also helps getting enough cognitive effort.
One way to manipulate the body of passengers who are getting air sick easily is to give them some tasks, like making pictures of buildings, looking out for certain points of interests on the ground or help to look out for other traffic. This doesnt have to be al real task you need, only to keep them busy.
After a person is exposed multiple times to certain plane movements, the sickness will go away as the person adapts to the movements. Also avoid turning your head in situations with turbulence or heavy winds, as this also manipulates the semi-circular canals.
Perception and orientation (6)
A human is continiously aware of the state of the body against the environment around it. This capacity of aerial orientation is the result of 3 components:
Vestibilar device: delivers information about the direction of gravity and speed changes
Proprioception: This exists of nerve-endings in the human skin, muscles and joints. Basically everyting you feel including intuition
The eyes: The eyes deliver the visual image. This is 80% of the full orientation-process
The combined information of these 3 systems will enable us to do handlings and coordinate movements. When one of those three will stop functioning or delivers wrong information, most all-day tasks are becoming very hard to impossible.
Because of all these instruments our human body has, there is a very important rule to note:
Disregard your feelings when controlling a plane
In a plane you will move around and fly horizontally just because your eyes see a straight horizon. When flying without any sights and on feeling, you will end up losing control over the aircraft within 60 seconds and even faster when banking.
Desorientation
Desorientation happens when the perception and orientation stops working. Your human body who was designed to feel and coordinate on the ground is tricked into things that do not happen actually. This is called an illusion, which is basically an incorrect perception.
Examples of illusions are:
Leans: A pilot may feel that the aircraft is banking even when it is actually level, or feel level after returning from a real bank. This can lead to incorrect control inputs as the pilot tries to “correct” a false sensation.
Coriolis Illusion: This happens when the head is moved during a prolonged turn, creating a powerful sensation of tumbling or spinning on a different axis. The result can be severe disorientation and an inappropriate attempt to recover from a motion that is not actually happening.
Somatogravic Illusion: Rapid acceleration can create the false sensation that the aircraft is pitching up, while deceleration can feel like pitching down. This may cause the pilot to push or pull the controls incorrectly, especially during takeoff or go-around.
G-Effect: High or changing G-forces can distort a pilot’s sense of pitch and attitude. This can result in a false perception of the aircraft’s position and lead to dangerous control errors.
The Leans illusion is the most happening illusion and can be very dangerous if not treated correctly.
Visual illusions
We also have visual illusions, where we percept things differently than they are really.
Approach and Landing Illusions: Visual cues during approach can make the runway appear higher, lower, closer, or farther away than it really is. This can lead to an unstable approach and an incorrect glide path. This is especially important at runways with a slope angle.
Strong Lights and Contrasts: Bright lights, dark surroundings, or sharp visual contrasts can distort depth perception and distance judgment. As a result, the pilot may misinterpret altitude, alignment, or rate of descent.
Autokinesis: A small stationary light in darkness may appear to move when stared at for several seconds. This can cause the pilot to mistake the light for another aircraft or to follow a false visual reference.
False Horizon: Sloping cloud formations, shoreline lights, or ground patterns can be mistaken for the true horizon. This may cause the pilot to align the aircraft with a misleading reference and enter an unsafe attitude.
To avoid desorientations, the most important rule is to not do VFR in Instrument Meteorological Conditions (IMC). Stay alert and keep your situational awareness and use the IM SAFE checklist.
Looking out
In VFR flights, we mostly fly with the see-and-avoid principle, where we constantly look out for other traffic and avoid them as much as possible by sterring to the right. ATC does only completely separate VFR traffic in Class B airspace (Also in A, but we are generally not welcome there as VFR).
To look out for other traffic, we use a method called scanning, where we will keep a good picture of the fromt 180 degrees viewing field in front of the plane. We can switch for around 10 degrees and at least one second to actually separate the details/clouds from real threats in the air.
Some limitations of this principle aire:
Human facturs
Fast movers
RAM-course, where other traffic keeps a constant relative bearing from our plane
Hear is see
This is why we would always sign into Traffic Information Services, have our Transponder enabled and TCAS if built in.
Flying and healthiness (7)
Flying in a wrong condition is prohibited by the dutch “Wet luchtvaart”. Before even thinking of touching a plane, we must first run through this IM SAFE checklist:
Illness
Medication
Stress
Alcohol
Fatigue
Eating
Illnessses/sickness
Someone who is really sick will not feel like flying. If not functioning properly in day to day tasks, you wouldn’t be flying either. We can have several idderent types of sicknesses:
Sinus infection
Hay fever
Gastrointestinal disorders (Maagdarmaandoeningen)
Infections
If flying with a sinus infection or hay fever, the chance of these two symptoms is greatly increased:
Pressure vertigo
Pain in the frontal sinuses and paranasal sinuses
Medicines
When a pilot uses medicines, there are some things to look after:
Possible side effects
If the results are enough for flying an aircraft
If you are using medicines to suppress pain or other things, you must ask yourself if fit-to-fly. Some regulatory rules that forbids flying in these certain conditions are:
Using medicines which can disrupt safe flight execution
Be aware of possible decrease of medical condition
Pilots are required to ask for advice if having any chronical sickness or medicines
Coughing medicines
There are some medicines against coughing, which work by supressing the cough reflexes in the brain. They also give some feeling of sleepyness.
Ephedrine and other dangerous medicines
In some countries, we could buy cocktails of different medical cpmponents like:
Antihistamines
Adrenal cortex hormones (bijnierschorshormonen)
Ephedrine
Pseudoephedrine
They all are forbidden in the Netherlands because of the great side effects like sleepyness and seeing blurry.
Sleep and calming medicines
Medicines that cause sleepyness are considered one of the most dangerous types of medicines for aircraft pilots. Those medicines can cause effects up to 72 hours like:
Sleepyness
Less capacity for stressful situations
Less concentration
More vulnerable for illusions
The general guideline is when taking medicines that cause sleepyness, wait at least 24 hours before controlling a plane.
Alcohol
Flying under influence of alcohol is forbidden, just like driving. In aviation, the rules are more strict because of possible damages. The general rule is that someone drinking any alcohol must wait to 10 hours before controlling an aircraft. In reality, people can have a decreased functioning even after these 10 hours.
A person is punishable when having more than 0,2 promille, which is 90 (µg/l) micrograms per liter. This counts for everyone doing flight preparations, executions and such.
Obesity
Obesity or being overweight causes more diseases and people are a lot more sensitive to hypoxia and G-forces.
Smoking
Smoking has both short-term and long-term effects on the human body. The long term effects are primarily in diseases, but some short term effects are applicable to flying an aircraft.
Smoking causes hypoxia around 4.000ft to 5.000ft earlier than normal people (dangerous in night flying)
Smoking causes a light form of anemia (bloedarmoede)
Smoking people ar emore vulnerable to carbon monoxide poisoning
Smoking causes the overall blood flow to have less oxygen
The circadian rythm
The circadian rythm is an internal clock of the human body where the internal temperature rises when we should be awake, and drops when we should be at sleep. This temperature range is about 1 degree celcius.
At night flying during the window of circadian low, this brings extra risks, like a decreased capacity of decision making and little less reaction-time. This is why pilots are not allowed to fly more than 10 hours per 24 hours.
Types of tiredness
We speak of two types of tirednesses:
Acute tiredness: After speeling not well, effort or mental effort you can be exhausted and tired for a day
Chronical tiredness: You can be exhausted over a longer period by work, stress or other exhausting activities
One way to eliminate tiredness is to do power naps during the day. This is researched and can have a positive effect on the functioning of a person.
Psychoactive stuff
ICAO defines certain stuff as psychoactive:
Alcohol
Opiates
Cannabis
Calming stuff
Cocaine
Therefore all countries forbid the use of these stuff in combination with aviation. The only exceptions of this are coffee and tea.
Eating and dehydration
A human that has eaten too less have a low blood glucose level. This is also called “hypoglycemia”. Being hungry can cause light sickness like dizzyness, tiredness and nausea (misselijkheid).
When being dehydrated, we mean that you have drank too less. Symptoms of dehydration are:
Dry mouth
Headache
Dizzyness
After ignoring those initial symptoms, more can arrive.
Information processing (8)
A human persion catches information by it senses. These senses are:
Sight
Hearing
Smell
Taste
Touch
Balance
The senses are more of less sensors (to talk in IT terms) which continously register information and pass it to the brain. The human brain will select and combine the needed information and how to interpret this.
The first step in the process of information processing is perception (waarneming). This is a subconscious process where the information will be saved in your memory. We cloud also call this the sensory memory. Signals will only saved for several seconds here before being overwritten by new information.
Short-term memory
After we will set our concentration on several infoemation, this will be saved into your short-term memory. This is where something we see will be converted into decisions and doing actions. However, this memory has a limited capacity of around 3 to 7 items with information, but we can prolong this items by continuously repeating it. Information in the short-term memory will reside there for a minute at max.
Some disruptions of short-term memory are
Sensitive for external disruptions
Parts of a clearance can be forgotten if out of time/items
For the most part, if things are in your short memory and you need them to remember for flight safety, the best thing is to write them down. This helps extending the remembrance period plus you have it written down.
Long-term memory
The long-term memory differs from the short-term memory by terms of capacity and retention-time. This part has an unlimited capacity and can save information for years.
This memory contains different categories of information:
Implicit memory: memory without conscious effort; habits and automatic responses
Declarative memory: memory for facts and events you can state
Explicit memory: consciously recalled memory; largely the same as declarative memory
Procedural memory: memory for skills and actions, like cycling or typing; a type of implicit memory
However, the capacity is unlimited of the long-term memory, but very specific information can be lost very easily. Like “hey, how did I do this 3 weeks ago”. This is why making documentation andwriting things down can really help you. Exactly the reason I started my website.
Prospective memory
The prospective memory is a small part where you think of tasks you have to do in the future. They could be forgotten if we don’t have a certain trigger (cue) for it. Like setting the altimeter on 1013hPa at the transition altitude or at work, doing something for your collegue, but simply forgot about it because no cue was given.
Exactly why we use checklist in the cockpit.
Perception
The vision that is projected onto the retina is a direct view of reality. You should think that everything will reach our brain without changes and thus is objective. However, this is called a bottom-up in the perception process.
In reality, everything we see is percepted by the brain. Depending on your activity, we expect certain things to happen, like our Cessna lifting of at 55 knots on the runway.
Human perception is not always 100% in sync with reality, and experience and exceptancy will also play their role in this:
Selective processes: the brain focuses on some information and filters out other information; in aviation this can make a pilot miss important cues
Subjective processes: information is influenced by personal interpretation, feelings, and past experience; this can affect judgment and decision-making
Expectancy: the tendency to see or hear what you expect instead of what is actually there; in aviation this can lead to wrong assumptions
Probability: how likely something is to happen; in aviation it helps assess risk and choose the safest action
This is the reason several people can have a completely different view of the same situation. An example is when flying IFR with an inexperienced pilot. The experienced pilot will carefully follow the instruments where the more inexperienced pilot will fly on perception. The experienced pilot will do this better.
Visual illusions
In an earlier module, we already described some sense-illusions but we also have some visual illusions we must know and defend ourselves against.
Illusions sometimes can be very tough to “un-see” but being with two pilots can help a lot. The most important is the context of where the illusion is in and this will depends on how we see and then percept it.
Attention
Attention is assigning thinking processes to certain tasks. Selecting is essential as we have a limited capacity and only want to focus on the essential parts which can be processed in our short-term memory. This is called selective attention.
A human person can delegate attention into what is called divided attention where more people, like 2 pilots, will delegate tasks to each other. This is where the principal of Pilot flying and Pilot monitoring comes from.
We also have attentional tunneling which everybody knows; thinking too long about one job and completely forget about the rest.
Vigilance
Vigilance (waakzaamheid) is the process where a person will actively be aware of the attention is spent on the right and essential things. This is important, as some repetitive tasks can lower our vigilance due to the repeating cause. This can cause adecreased level of vigilance, called hypovigilance.
Some causes for hypovigilance are:
Sleepyness or being tired
Eating -> after diner dip
Monotonic sounds like engines of servers
High temperature
Stress and pressure
Fast irritance and bad communication
Limiting information processing
The proces of human information processing knows some built-in limitations where we have to be aware of.
Confirmation bias: This is a state where we expect something based on knowledge or events and we will keep searching for clues that confirm our initial bias, even when those are not even related that close
A great example of confirmation bias ending up fatal is:
A well-known aviation accident that is often used to discuss confirmation bias is Eastern Air Lines Flight 401, which crashed into the Florida Everglades on December 29, 1972. The crew became focused on a landing gear indicator light that seemed to suggest the nose gear had not locked properly. Because they were convinced the main problem was the landing gear, they directed most of their attention toward confirming and solving that issue, while failing to notice that the aircraft had begun to descend. The autopilot had been altered unintentionally, and the plane gradually lost altitude until it crashed. The U.S. investigation found that the crew’s attention was distracted from monitoring the flight instruments, allowing the descent to go unnoticed.
Automating tasks in the cockpit
Automating tasks in the cockpit can drastcally reduce workload and with that stress and such in the cockpit. Navigating with charts are replaced with tablets with GPS, autopilot for climbing and descending/cruise and other systems. However all these cool things, there are some cons about automating tasks:
Automation complacency: where pilots trust too much on their automations, unseeing critical errors like other traffic
Autopilot which deactivates itself after having a minor error and not hearing the beeps, causing the plane to descend from itself
Decision making and errors (9)
Decision making is a comprehensive cognitive process where a person needs to make choices. This process will start with perception and information processing, like described in the earlier modules.
In decision making, there will come a lot of human factors into play:
Knowledge
Skills
Experience
Attitude
Motivation
Fysiologic condition
Psychologic condition
Incluences from the outside like group-pressure or passenger pressure
Decision-making process
Normally, making decisions will happen in these steps:
Observe the problem (waarneming)
Attention on the details (aandacht)
Think of what is needed to cause this issue (interpretatie)
Execute a certain checklist or action (besluitvorming)
Situational awareness
To make safe and correct decisions, it is good to have a good situational awareness. This states that you exactly know what you are doing, what problem you need to solve and what things will help doing this. Also knowing where you fly is great. Without a good situational awareness you are sensitive for making errors which can lead in disasterous outcomes.
Situational awareness happens at three levels:
Perception: catching relevant information from the environment
Understand: based on knowledge or skills you will create a good overview of the real situation
Forecasting: prioritizing and anticipate on what is going to happen
If this situational awareness is decreased, your own reality does not match with the actual realtity. This will improve the chance of any wrong decision (garbage in, garbage out)
Factors that decrease situational awareness:
Bad attention spanning
Bad communication
Stress
Vermoeidheid
Too high or low workload
We can prevent and restore situational awareness by doing those things:
Keeping the golden rule of aviation, in this order:
1 Aviate
2 Navigate
3 Communicate
Admit and tell: if any doubts or uncertainties occur, speak up and just tell the situation
Keep workload and stress levels low and prioritize
Take your time to think and analyze and don’t do actions speedy
Good flight preparation and communication in briefings before a flight is a great way to enhance situational awareness.
Decisions and execution
To make a decision, you need to follow several steps. In the first place you need to assess the risks and the situation. Then all different options must be viewed and analyzed and the right option must be chosen which will overall give the best result.
Risk assessment and consideration of alternatives will differ from person to person. Also the pilot, plane, environment and 3rd party influence will all count towards this.
Personality and attitude
Decision making is not a objective process. Different persons will make different decisions based on the same situations. This all syncs with the personality and attitude of a person. Some persons are really fast at understanding a problem and will take a immediate decision, where other people need to write all different options down and (over)think them.
Some attitude exists, but must be prevented at all times:
Attitude
Symptom
Remedy
Macho
“Look at me, im better than you”
“Don’t take unneccesary risks”
Anti-authoritarian
“They can go to hell”
“Rules are there to prevent accidents”
Impulsivity
“Do something”
“Think, than execute”
Invulnerability
“That will never happen to me”
“Everything can happen to anyone”
Resignation
“What does it matter?”
“Everyone can make a difference”
Decision making in groups
Decision making in groups can have positive and negative effects.
Positive effects are more knowledge, awareness and more eyes
Negative effects is that you can exeed your personal limits and try things to look thougher than you actually are
Human error
We will call a human error such if a human decision does not stroke to the intention, leading to a unwanted result. Causes leading to human errors are liked described in earlier modules.
Human errors are for example:
Flying into a TMA without clearance
Forgetting carberateur heat on final
Actively violate rules are not human errors but violations with possible law-outcomes.
Learning from errors
In a human life, it is really critical to learn from errors we make or that other people make that can happen to you also. This is why every aircraft incident is thoroughly researched and the local authorities will create a final report with their recommendations described. They will fill the report with at least these information:
Cause of the incident
Analyzing the factors of the cause
Report of how the incident happened
Recommendations on how the industry can learn extensively from the errors or decisions made
The root purpose of this report is to learn from errors, not to point fingers at different orianizations and such. However, it is possible that certain organizations or individuals may be prosecuted (berecht) by law for negligence (nalatigheid) or for knowingly taking the wrong actions.
Safety culture
To learn from everyones errors, it is also important to note errors that does not lead directly to incidents. Pilots will only report their own faults if the company culture is open, and good. If the company is very toxic or closed with lots of punishments available, they will severely less open to speak about their own faults.
Therefore, in any company with pilots, there need to be a culture called “just culture”. Errors by pilots must not be directly leasding to the loss of license or work but into extra simulator training or personal training to actually become a better pilot. Only punishing and whining about errors resulting in lots of paperwork doesn’t make anyone a better pilot. Just culture must know what has gone wrong, not specifically what person did this.
It must be noted that actively violating rules and laws on purpose is a completely different story.
Stress (10)
The human body consists of mechanisms which adapts to the physical and physich threats (stressors) in its environment. The reaction of the human body is called stress, which we know 3 causes of:
Environmental stress: temperatures, noise, lights, vibrations, turbulence, air pollution or hypoxia
Psychological stress: Conflicts, great happenings in human life like marriage, divorce diseases, deaths, fired, changing jobs or high workload in the cockpit or fear of flying
Physiological stress: Sickness, bad food, tiredness or alcoholusage
Note that 2 and 3 are different, altough the word might look the same.
Acute stress
Some events can cause the human body to build specific hormones, like adrenaline. This can also happen in the cockpit, where the human body will go in the primitive fighting mode. The hearts pounds faster, breathing goes faster and muscles will get more blood. This also can cause hyperventilation.
Stress has a lot of causes for a person to function, where it decreases its function level:
Clammy hands
Transpitating
Vibrating hands and lips
Dry mouth
Hyperventilation
Heart poundings
Headache
Dizzyness
Stomach pain
Stress can therefore work against you, when in a degraded level of functioning where also having less concentration on the situation. It can also cause you to decline recently learned tactics, and do regression, where you pick up older methods you are more familiar with.
During acute stress, our body will flow through these phases:
Alerting phase
Resistance phase
Exhaustion phase
Stress vs Performance
Its no suprise that stress is a primary cause of how we perform. To further clarify that, there is a graphic from Yerkes and Dodson, clearly stating how those two are related:
The best levels of performance are in the middle, where we have some pressure to do things the right way and at the level we need. Low stress can cause some boredom and disinterest, where high levels causes anxiety and the things already described.
Stress is also cumulative, were every waterdrop helps overflowing a glass of water.
Dealing with stress
Every person will act different under similar conditions. One person will totally overflow and freak out where the other laughs a bit and solves the situation. It all is dependent on personality and perception.
Decreasing stress levels by specific strategies s called coping, and strategies that work are different for every person:
Stay current, deal in the current conditions
Good flight preparation and think of what to do when and why and brief them to your co-pilot
State personal limits, like 10 knots crosswinds or not under 5000 meters of visibility.
Dont be distracted by minor errors, fly the aircraft
Stay calm and take your time
One final sentence to think about:
Its better to be on the ground, wishing to fly than being in the air wishing to be on the ground
Extra information
Henry’s law
Henry’s Law states that the amount of gas dissolved in a liquid is directly proportional to the pressure of that gas above the liquid.
In simple terms: the higher the pressure, the more gas dissolves in the liquid. When the pressure decreases, the gas comes out of the liquid again.
A simple example is a soda bottle: when the bottle is closed, carbon dioxide stays dissolved because of the high pressure. When you open it, the pressure drops and bubbles form.
A real life scenario of this phenomenon is decompression sickness.
Decompression sickness
Decompression sickness happens when pressure decreases too quickly, causing gas bubbles to form in the blood and tissues. It is commonly known as:
Bends and creeps where skin itching or a crawling sensation
Chokes where serious breathing difficulty caused by bubbles affecting the lungs
Double vision in your eyes
Pressure vertigo
A more specific medical term is alternobaric vertigo, which means vertigo caused by a pressure difference between the two middle ears. This can happen when flying with a sinus infection.
Raw notes Theory course
HPL (Human Performance & Limitations)
Oxygen and circulation
Arteries carry oxygen-rich blood.
The pulmonary artery carries oxygen-poor blood (only exception).
Blood pressure and temperature are regulated via the central nervous system.
Normal blood pressure: 120/80 mmHg (baroreceptors).
Composition of blood:
Red blood cells: hemoglobin.
White blood cells: immune defense.
Platelets: clotting.
G-forces
Pulling the yoke = positive G-force.
Pushing the yoke = negative G-force.
Increased G-force can cause loss of consciousness (less blood to the brain).
Negative G-force is more dangerous.
Hypoxia and breathing
Hypoxia = oxygen deficiency due to insufficient oxygen/blood supply.
At night: maximum 5,000 ft without supplemental oxygen.
Dark adaptation is lost faster than visual acuity.
Carbon monoxide cannot be smelled (CO itself is odorless).
Flushed cheeks.
Exhaust gases contain carbon monoxide.
Hypo = too low.
Physiological vs non-physiological responses
Physiological: due to physical exertion.
Non-physiological: due to anxiety/stress.
Yawning is associated with tingling in the fingers.
No tingling.
Tingling present.
Barotrauma and pressure
Barotrauma = pain caused by pressure differences.
Pain during descent → stop descending.
The eardrum is airtight.
“Popping” ears → descend or climb more slowly.
Frontal sinus.
Gases and pressure differences with altitude changes.
Teeth: toothache due to pressure differences.
Eustachian tube.
Vision and perception
The eye is remarkable.
The eye is a light-sensitive organ.
The iris works like a camera lens.
Eyes accommodate by adjusting focus.
Fovea (yellow spot).
Light-sensitive cells (rods and cones).
Saccadic movements → processing pause.
Visual illusions and perceptual loss → noise/deafness.
Semicircular canals (balance).
Otolith organs (acceleration).
Airspace.
Motion sickness → focus on horizon.
Passengers.
Symptoms: quiet.
Rapid changes → flying is a bad idea.
Perception threshold.
Importance of vision
Eyes are very important (±80% of information).
Vestibular system = balance → integration.
Proprioception = body position.
Disorientation Type I = unrecognized.
Disorientation Type II = recognized.
Fluid in balance organ causes sensation of turning.
After some time it feels stationary.
2 seconds or after-image up to 48 hours.
The Leans → sensation of banking.
Coriolis illusion → semicircular canals.
Somatogravic illusion → linear acceleration (e.g. during takeoff).
Approach illusion is dangerous → PAPI helps with glide path.
Personality = genetics and environment.
Non-punitive vs Just Culture → no punishment approach.
End of the page 🎉
You have reached the end of the page. You can navigate through other blog posts as well, share this post on X, LinkedIn and Reddit or return to the blog posts collection page. Thank you for visiting this post.
This page can contain a collection of personal notes, steps to remember, finished and unfinished content. Please excuse brevity.
Do not use specific information given like fuel flow, landing/take-off distances for your flights. Always refer to the POH of your exact plane for flight preparation. My information is just for references that I used.
Aviation rules and laws in the Netherlands (1)
Because the whole world uses aviation to get from A to B, the world needed an organization that will monitor, review and publishes rules for aviation. This is the International Civil Aviation Organization (ICAO), founded in Chicago in 1944. The primary rule was to standardize aviation around the world.
In the Netherlands we have the so called “Wet Luchtvaart” (Aviation Law) and contains all the basics of ICAO themselves, changed for this country. This contains mostly some minor changes from the EU laws.
Treaty of Chicago and ICAO (2)
From the 1944 conference, ICAO was founded and almost all countries around the world are member of this. ICAO publishes guidelines and advisories for countries to adopt to ensure safety but countries are not required to do so. EASA in Europe is an other story, that are laws that all European countries must follow.
ICAO publishes advisories and recommendations
EASA publishes laws that are required to follow by the pilot in command
The goal of this conference was to found an organization, ICAO, that creates standardized rules which all pilot in commands around the world must adhere to. From this conference there was signed the Treaty of Chicago which contains a huge load of rules in Annexes, which are attachments to the treaty:
Annex number
Description
Annex 1
Personnel Licensing
Annex 2
Rules of the Air
Annex 3
Meteorological Service for International Air Navigation
Annex 4
Aeronautical Charts
Annex 5
Units of Measurement to be Used in Air and Ground Operations
Annex 6
Operation of Aircraft
Annex 7
Aircraft Nationality and Registration Marks
Annex 8
Airworthiness of Aircraft
Annex 9
Facilitation
Annex 10
Aeronautical Telecommunications
Annex 11
Air Traffic Services
Annex 12
Search and Rescue
Annex 13
Aircraft Accident and Incident Investigation
Annex 14
Aerodromes
Annex 15
Aeronautical Information Services
Annex 16
Environmental Protection
Annex 17
Security and Unlawful Interference
Annex 18
Transport of Dangerous Goods
Annex 19
Safety Management
Ground area and sovereign countries
The treaty explains that every country has full control over their own ground area and the air above the ground. It also explains that the water around countries are member of that country, at least within 12 nautical miles (22km) from the coast. Within those 12 nautical miles, the country is responsible for closing the airspace and control it by monitoring and giving clearances.
Access to airspaces
The treaty explains that the participating countries will permit access for uncontrolled flights like from private pilots without landing in the country. This is called the freedom of the air, which gives you the right to cross airspace from another country, with a possibility to make a diversion or emergency landing. This also gives commercial freedom, like transferring passengers or goods to another country.
However, the country where you land can determine if your cargo must be checked or forbid certain goods to ship into the country. Here the country where you land has the lead, because of the sovereignity. They can also forbid, or lead you to a different route in case of emergencies or international emergencies (like war).
A country can also force you to land in their country if they want to check your passengers or cargo. This is called a Safety Assessment of Foreign Aircraft (SAFA) check.
Uniformity of aviation rules
All participants of aviation of the treaty are required to comply with as much rules as possible of the treaty. These rules are described in Annex 2. The best thing is that the whole world uses the same rules, but some countries are more strict than other countries, especially the USA as a result of the 9/11 attacks.
Customs and immigration
A plane can be used to transfer cargo and passengers, so the customs of a departing and landing country must use an airfield with customs, which will check if everything is following the rules. You may only plan to fly an international flight when departing from an international airfield.
The treaty of Chicago states that aircraft can be allowed in a country without paying customs or other costs for fuel, oil, spare parts and extra stuff. This would make it impossible as every country has their own rules for taxes and importing goods.
It can also be required for international flights to submit a General Declaration. This requirement is mostly when flying outside of the Schengen-zone, incoming or outgoing.
Required documents on board
On every flight it is required to have these documents on board:
Certificate of Airworthiness
Pilot License / Certificate of the pilots given by country (or EU) of aircraft registration (ICAO-confirmed, RPL and LAPL not included)
Journal
Radios and technology
The board devices of the plane must comply with the minimum requirements of the country where the plane is registered. When using the devices, the rules of the country below the plane apply.
For the radio’s, only qualified personnel that have a RT certificate may send over the radio.
Cameras
Countries can forbid you to use cameras on board of aircraft. In most countries, there are restrictions on making pictures of military facilities. In the Netherlands, there was a very restricting law that forbid most of the pictures from the air, but was suspended in 2013.
Aircraft (3)
All aircraft must be registered in the national aviation register and will receive a registration number. This number must be short, but with the most combinations possible.
In the Netherlands, this is done by the “Inspectie Leefomgeving en Transport” (ILT).
Registration numbers will be made up in two parts:
Here is an example of the registration numbers and method in the Netherlands:
Aircraft type
Naming Convention
Example
Planes, Helicopters and Hot air balloons
3 letters
PH-JSV
TMG’s and Gliders
3 or 4 numbers
PH-2653
Microlight aircraft
Number-Letter-Number
PH-6H9
Unattended aircraft (Drones)
Number-Letter-Letter
PH-8SD
Some sensitive combinations are not included, and may not start with “Q”.
The registration number is like a license plate for a car. A unique number, instead of “A red or yellow plane”. There are some requirements for this number to be visible:
Both sides on the wing or tail (visible from Air)
Both sides at the underside of the wings (visible from ground)
There are some specific guidelines for visibility
Registration number must be 50 centimeters high on the fuselage
Registration number must be 30 centimeters on the vertical stabilizer
It must be clear and readable from several hundred meters distance
Countries can deviate from these rules but must align with the rules described in the SERA as baseline.
In an aircraft, the Pilot in Command is responsable for a flight following the rules. Violation of rules is only permitted in emergency situations.
Flight Rules Collections
For types of flights, we have 2 collections of rules:
Visual Flight Rules (VFR): Flying on visual checkpoints and POI’s
Instrument Flight Rules (IFR): Flying on instruments/navigational waypoints
Commercial flights will always fly on IFR to reduce the workload of the captains. Also, they very often have to fly through cloud layers where flying visually is not possible.
General flying guidelines
We have some general guidelines for flying in the air. These rules are based on:
Corrections on earlier mistakes/incidents/crashes
Safety
Minimizing pilot input
Throwing items from the plane is not permitted
Simulating IFR in a not IFR ready environment
Avoid collisions. Formation flights only permitted when its a controlled flight
Priority rules, traffic from the right has priority
Two planes that fly right head on must deviate to the right to avoid collision
Overtaking must be done over the right side, under a 70 degrees angle of the overtaken plane
There are some special events that could happen:
Gliders must avoid hot air balloons
Planes must avoid hot air balloons and gliders (they are the one that have the most control)
General ground guidelines
Pedestrians and cars must give way for (towed) aircraft
Emergency vehicles have priority to every other traffic on the ground
Starting aircraft have priority over taxing aircraft
Taxiing aircraft must steer to the right to pass each other without collisions (pilot is on the left)
Crossing roads gives priority to right traffic
Use as much space as possible when overtaking aircraft on the ground
General Circuit guidelines
When flying a circuit around an aerodrome or airport, these rules apply:
Injecting the circuit must happen on the signal aera (or else when permitted by ATC)
The circuit must be followed, stay within the borders
Go arounds must be done safely
Exiting the circuit must be done at the given position and under an angle of 45 degrees
Follow deviations in circuit procedures (always check published procedures by AD/airport)
Controlled airfields has a complete circuit at 1000ft, uncontrolled mostly on 700ft (or else published)
VMC minima
To fly VFR, flight conditions must be at least the rules below:
10.000ft/FL100+: 8000 meters or better visibility and 1500 meters horizontal and 1000ft vertical from clouds
3000 to 10.000ft: 5000 meters or better visibility and 1500 meters horizontal and 1000ft vertical from clouds
On or below 3000ft: 5000 meters or better visibility, clear from clouds and view on ground or water
In airspace classes F and G, its allowed to reduce the required visibility below 3000ft. In these special conditions, you may fly with 1500 meters visibility:
140 knots or less speed
Very small chance of meeting other traffic
Flying VFR in CTRs
When flying VFR in CTRs, you must follow these rules:
The cloud ceiling is 1500ft or higher, or less than 4/8 octas (SCT)
Ground visibility is 5000 meters or higher
VFR limitations
When flying VFR, you have the following limitations:
Flying in airspace class A without clearance
Above FL 195 (19500ft pressure altitude)
At night without Night VFR rating
Faster than 530 knots GS
In airspace classes C to G below FL100 and faster than 250 knots IAS
Flying VFR at night
When you want to fly VFR at night, you must comply with these rules:
Cloud ceiling must be higher than 1500ft or lower than 4/8 ctas (SCT)
Visibility in airspace classes F and G on or below 3000ft is at least 5000 meters
On or below 3000ft AMSL (or 1000AGL if higher) there must be visual on the ground in all airspace classes
In mountain rich areas, VFR minima will be more strictly than written down here
Day and night period
To define hen its day and night, we have the following rules:
Its night between the end of civil twilight and the start of morning dusk
Its civil twilight and dusk when the sun is less than 6 degrees under the horizon, which is around 30-45 minutes after sunrise/sunset
Some countries, like the Netherlands, have a defined “Uniform Daylight Period” (UDP), which defines the start of sunrise and end of sunset on average for the whole country. This is published in the AIP.
Minimum VFR altitude
When flying VFR, you must comply with these altitude rules:
Above cities or buildings with an altitude to not bother people, but high enough to make an emergency landing (1000ft above the highest building)
At night: 1000ft above the highest building in a vicinity of 8000 meters or 2000ft in mountain rich areas
You may only defer from these VFR minimums when performing these actions:
Take-off and landing
Picking or delivering towing operations
If any special clearance is given, for example to practice forced landings
Signals
Distress situations
Of course we hope to never need this part of information, but it’s crucial to know. What to do in distress situations, which are the most dangerous, where life is on the gamble.
When an aircraft is in immediate danger, the following steps must be done as pilot in command:
Transmitting, on the frequency the aircraft is, MAYDAY,MAYDAY,MAYDAY followed by a message that states the callsign current position, heading, altitude, type of disaster and intentions
Setting the transponder to 7700 (seven, going to heaven).
Shooting red flares into the air
An aircraft that is in danger is allowed to do everything just to get attention. If this includes a low fly by or calling the LVNL (in the Netherlands) by phone, this is allowed.
In the case of an emergency situation, which is where an aircraft needs priority but not immediate landing, instead of MAYDAY we use the phrase PAN PAN, PAN PAN, PAN PAN. Stating that we need priority caused by an error on board, smoke of strange smell or a person getting sick or incapacitated.
Just like the distress, start transmitting PAN PAN, PAN PAN, PAN PAN followed by a message that states the callsign current position, heading, altitude, type of disaster and intentions
When flying into a danger zone or restricted area, its possible that you get some radio calls to defer your course. Its also possible that flares in red and green colors (every 10 seconds) are shooting into the sky where people on the ground warn you about the possible danger you are to encounter. You as pilot in command should always leave the area as quickly as possible. If this takes a 180 turn, do that.
Signals at aerodromes (visual messages)
Its possible if the aerodrome thinks your radio isnt working, that you get visual messages when in the circuit. This can be confirmed if you don’t hear anything on the radio like a response to your message.
The visual messages are also stated in the COM course, and therefore a link to that section:
White means clear to land or return to starting point
Steady green is a clearance to take-off or land
Steady red means stay where you are or keep circling
Flashing green means cleared to taxt or return for landing
Flashing red means expedite, vacate runway or aerodrome unsafe, do not land
To confirm messages given visually, you need to make clear that you saw, understand and performing them. This can be done:
In daylight, swinging your wings left and right
In daylight on the ground, moving your rudder full left and full right
At night or dawn: flash your landing light 2 times or if not possible do other lights like strobe or navigation.
Ground signals
If any radio failure occurs on an aerodrome or aircraft, the aerodrome will put some ground signs at a certain place. This can be at the runway itself.
Here is an overview of the different signs you could encounter. They are also described on the back of the VFR chart.
These signals are physically on a large banner which the aerodrome has to put at a certain place in case of emergencies. Physical and visual does always work.
Marshalling signs
At an airport, there is a chance that a marshal will give you instructions about what to do. This will mostly only happen at controlled airfields.
Some additions to the signs that can be given by marshalls:
Stopping and turning signs are given with his arms. The faster his gesture, the faster you must stop or turn.
Braking is gestured by the marshall making a fist. Stop braking is the complete opposite gesture.
Start engine: The marshall will point at the engine that can be started. In most cases with VFR flying, this is only one engine.
Unlawful Interference
In case of unlawful interference, we mean that the aircraft is interfered. This can be a hijack or weaponized aircraft where people in or outside of the aircraft can be in danger. You as pilot in command are asked to do the following actions (if possible of course):
Notify local aera by radio
Set 7500 on transponder (five, man with a knife)
Land as soon as practical at the nearest airfield or keep your current altitude and heading
Make a emergency notification at the international emergency frequency: 121.500 MHz and keep notifying about heading/altitude differences.
Intercepting civil aircraft (by military)
If an aircraft does not comply with rules, for example flying in a restricted area, the aircraft can be identified, call out or intercepted by the military. In the worst case scenario, there will be a fighter jet flying next to you to check what you are up to.
In this situations, do the following steps:
Notify your current frequency about this happening
Set transponder 7700 or other code when asked
Set radio to 121.500 MHz to communicate with a possible fighter jet next to you
You have to do everything you are told at this point
If not possible to communicate because of an language barrier, the following ICAO phrases will be used
Phrase
Meaning
Callsign
Your callsign is?
Descend
Descend to land
Follow
Follow me
You land
Land on this airfield
Proceed
You can proceed your flight
Based on the situation, its possible to answer the actions:
Phrase
Meaning
Callsign
My callsign is …
Wilco
Roger, I will follow your instructions
Unable
I am unable to follow your instructions
Repeat
Please repeat your instructions
Am lost
I am lost or no GPS fix
Mayday
I am distress traffic
Hijack
I am hijacked and possible need some help
Land
I am asked to land on …
Descend
I have to descend to … ft.
The fighter jet can also give some visual instructions:
Air Traffic Control (5)
Air Traffic Control (ATC) is for the highest safety possible when flying an aircraft. Because ATC has an overview of all aircraft, their task is to make it safe for everyone by separating aircraft from each other, leading them to certain points etc.
The full list of tasks of ATC:
Prevnting collisions between aircraft
Prevention collisions with obstacles
Enhancing traffic flow
Giving advices for an safe and efficient flow
Notifying responsible organizations and helping them
There are 3 types of air traffic service:
Air Traffic Control for airspaces A, B, C
Flight Information Services, like Dutch Mil Info or Amsterdam Info
Alerting service for avoiding possible collisions
The structure of services and their responsibilities is shown on page 44. ¥
Flight Information Regions (FIR)
All airspace parts are together managed by a Flight Information Region (FIR). This is separated for horizontal areas, like the Netherlands is member of the Amsterdam FIR. Belgium is member of the Brussels FIR and so on.
A FIR is a region where all three types of air traffic services take place. Bigger countries like France and Germany have multiple FIRs (4 to 5) to separate the workload.
Air Space Partitions
On page 44 is described that there are multiple manners of separating airspace next to A to G. This must be researched. ¥
Dutch Airspace (as example)
On page 45 there is also a vertical view of the Schiphol (EHAM) CTR, please review thoroughly. ¥
Some simple rules apply for the Dutch airspace:
From ground to 1500ft, airspace is always G with the exception of CTRs
A CTR for civil airports is always airspace class C
A CTR for military airports is always airspace class D
CTRs in the Netherlands start from the ground and stop at 3000ft AMSL
Above and outside CTRs we have TMA area’s which are Terminal Maneuvering Areas. This can be seen as approach traffic. Their airspace class defers based on the goal and application.
Amsterdam has a CTA above the TMA. VFR flights are not permitted in this area and is from FL95 to FL195.
Amsterdam has a Upper Control Area which spans from FL195 to the ceiling, but good luck getting a Cessna 172 above 19.500ft :)
This is all page 45.
Air Traffic Control areas
Air Traffic Control areas are as the name suggests, areas where ATC provides control to your aircraft. This happens mostly with IFR flight rules.
Air Traffic Control areaa are:
Area Control Center (ACC) (for example: Amsterdam Center) - Leads aircraft in their region from A to B
Approach Control Unit (APP) (for example: Schiphol Approach) - Leads traffic to the destinated approach path for inbound aircraft
Aerodrome Control Tower (TWR) (for example: Schiphol Tower) - Leads aircraft to a runway and gives landing clearance
Airspace classes
Same explaination as already done, search for the complete table for a copy. ¥ (Page 47).
Airspace classes can also be temporary active. Always refer to the NOTAMs when planning a flight to be sure you are allowed and flying in the airspace you are supposed to be.
VFR rules and Air Traffic Control
VFR flights are mostly uncontrolled, but in some cases they will be leaded by Air Traffic Control:
VFR flights in air space classes A, B, C and D.
Special VFR flights
VFR flights departing or landing at controlled airfields
A highly advisable note: being controlled by the tower doesnt nessecarily mean that you are being separated from other IFR or VFR traffic. Please refer to the air space classes definitions. (Page 49).
Flight Information Services
In uncontrolled airspace, like E to G, its highly advisable to sign into the Flight Information Services. These will give you important information like:
Meteorological information like significant or unforecasted weather (SIGMET/AIRMET) or at your destination airport
Regional QNH, to have all planes in the region flying on the same pressure altitude. This may not be the actual pressure but is an average for the whole region
Information about navigation tools
Information about aerodromes (busy or landing not possible)
Traffic information to avoid collisions (best effort of FIS)
VFR-unwanted weather reports
Military operations (like a NAVO Top)
Other important information for helping you having a great flight
In the Netherlands, we have two Flight Information Services:
Amsterdam Info for randstad: 124.300 MHz
Dutch Mil Info for the rest of the Netherlands: 132.350 MHz
You always have to sign in to FIS by describing your flight:
Dutch Mil Info, PH-JSV
PH-JSV
Overhead Apeldoorn
1500ft
VFR to Eelde
Request flight information services
They will respond with a message to maintain your flight, important information and a regional QNH which you must set. Sometimes they give you a special Transponder code.
Aerodromes (6)
In the Dutch LAW, we have two separate laws for aerodromes:
Besluit Burgerluchthavens (2009)
Regeling Veilig gebruik luchthavens en andere terreinen (2009)
Its required to always use airports for take-off and landing. The only exception is when in a distress/emergency situation and you have to do a forced landing.
Gliders and hot air balloons are allowed to take-off and land from any land that is applicable. The same applies for police or emergency choppers.
Civil aviation is forbidden to use military airports, except if they have a special clearance.
Position of an aerodrome
The podition of an aerodrome is fixed by a clear GPS point, called the Aerodrome Reference Point (ARP) and is mostly the geometric center of the aerodrome. This will never change in normal situations, but an aerodrome can expand so a new ARP has to be assigned. This ARP is mentioned in the AIP.
Available runway lengths
Already described somewhere, look that up and adjust. ¥
Taxiway markings
Described on page 59, good to review further.
Aircraft Detection Lighting System (ADLS)
Page 66
Air Traffic Control in-depth (7)
In this part we will describe all rules about working with Air Traffic Control.
VFR Flight Plan rules
For VFR flights, it is required to submit a flight plan. This flight plan contains some general information of your planned flight, like:
Waypoints
Speed (TAS)
IFR/VFR rules
ETA
Departure
Arrival airport
Contact information
Number of passengers on board
We have to submit this at least 30 minutes but preferrably 60 minutes (maximum of 5 days ahead) before starting. Your flight plan can be transferred between ATC units so everybody knows exactly what your intentions are.
However you may sumbit a flight plan for every flight you do, it is only required by law in the following circumstances:
Flights that cross international FIR stations, unless otherwise described in AIP of the states
Flights that fly through controlled airspace, so airspace class A, B, C or D.
Flights to or through areas assigned by authorities, like the North Sea Area Amsterdam (NSAA)
Flights at night leaving the vicinity of an aerodrome (further than 5 NM)
VFR Flight Plan submitting methods
We can submit a flight plan by using the following methods:
Via Amsterdam Integrated Briefing (homebriefing.nl)
By radio in-flight
Submitting a flight plan by radio has its own rules to comply with:
Flight plan only applies to a section of the flight
Flight plan must be received at least 10 minutes before flying in a controlled airspace
CTR Schiphol is forbidden
Flight is in airspace A, B of C or above FL195
Flight without flight plan
You can also do a flight without a flight plan, but is only permitted when following these rules:
Flying from and to an uncontrolled aerodrome
Flying exclusively in airspace classes E and G
Submitting a flight plan can have a huge advantage for search and rescue missions, as they know your intentions.
Change of flight plan
Sometimes a change of flight plan is needed. Maybe the destination or alternate has changed or the number of passengers.
A change in flight plan has to be submitted at least 30 minutes before departing. If the delay is more than 30 minutes, you are required to cancel the flight plan and submit a new one.
In flight, you must follow your flight plan, and if your speed does defer 5% or more you have to notify the flight information services or ATC.
Closing your flight plan
When your flight is completed, your flight plan must be closed. This means the towers and ATC knows your flight is over and all processes stops. It is possible that if you forget to do this a search and rescue mission will be started, which you have to pay.
To close a flight plan, do one of the following options:
Land at your destination which must be a controlled aerodrome, they automatically close it
Notify the ARO of your area
When closing your flight plan, you must notify the following information:
Registration number
Departure Aerodrome
Time of arrival
Alternate airport (if diverted)
Arrival airport
Diverting
If landing is not possible at your planned destination, we have to divert to our alternate aerodrome or make a forced landing. In this case, we have to notify our planned destination by phone. This can be the control tower or ARO.
Altimeter settings procedures
In our plane we have the altimeter which actually measures pressure based on a reference point. This reference point is the QNH, the actual, mean pressure on sea level.
Because in some areas planes must be on the same page, we have regional QNHs, so multiple planes are flying on the same reference point and collisions can be avoided.
When flying above the decided transition altitude, we switch our QNH to 1013 and we fly on flight levels, ending on 5. FL55, FL65, FL75 etc. IFR flights will take the rounded levels like FL60, FL70 or FL80.
In the netherlands, the transition altitude is mostly around 3500ft. The transition level is 1000ft higher. For avoiding collisions, its not permitted to cruise between the transition altitude and level, as this is for corrections of multiple, different built altimeters or pilot errors.
When descending, we will asap set the local QNH to make sure we fly at the correct setting and having the ground at the planned distance.
Semi circular altitude system
For deciding our flying altitude, we use the semi circular altitude system. This means we pick our altitude based on magnetic ground course. VFR flights pick flight levels ending on 5, IFR picks flight levels ending on 0.
000 - 179 degrees: Odd (FL55, FL75, FL95)
180 - 359 degrees: Even (FL65, FL85, FL105)
Great dutch way to remember: Oost = oneven.
Altimeter setting options
Because our altitude meter doesnt measure exact altitude above ground but the pressure difference from a reference point, we can select multiple reference points.
QNH: This is the locally measured pressure, calculated back to mean sea level
QFE (Aerodrome elevation/AGL): This is where you set the altimeter to 0ft on the ground so you measure the altitude above the ground, based on the aerodrome.
ISA/Standard: This is always 1013 and is mostly used above the transition level.
The altitude meter may defer a bit but not more than these values:
60ft difference to actual for altimeters to 30.000ft
80ft difference to actual for altimeters to 50.000ft
page 83
Pilot licenses (8)
Medical class 2 is EASA approved and valid for this periods
Till 42 years old: 60 months/ 5 year
Till 51 years old: 24 months/ 2 year
50 years and older: 12 months/ 1 year
Flight Preparation and execution (9)
In this module, we will go deep into the rules for preparing a flight and then executing it according to your plan.
The 3 most important subjects in this module are:
Aviation intelligence
Flight preparation
Instruments and gear
All rules in this module are according to ICAO Annex 6, called the Operation of Aircraft - International General Aviation). For Europe we have the Air regulations 965/2012 where for PPL pilots, the Non Complex Operations part applies.
Aviation intelligence
The pilot in command of an plane must ensure every flight is prepared. This minimizes the chance of mistakes or worse things from happening.
The information a pilot must gather before performing a flight is:
The Aeronautical Information Publication (AIP)
The Notice to Airmens (NOTAMs)
Aeronautical Information Circular (AIC)
Aviation Charts (like the VFR Netherlands chart)
Aeronautical Information Publication (AIP)
The Aeronautical Information Publication is required by each country to host and publish where all rules will be described. Therefore this has to be publicly accessible. The AIP contains all information that is relevant for flight preparation and safety for people in and outside the plane.
The AIP always looks like this:
General (GEN)
Gen 1: National regulations and requirements
Gen 2: Tabels and codes
Gen 3: Services
Gen 4: Charges for aerodromes and services
En-Route (ENR)
Enr 1: General rules and procedures
Enr 2: Air traffic services airspace
Enr 3: ATS routes
Enr 4: Radio navigation aids/services
Enr 5: Navigation warnings
Enr 6: En route charts
Aerodromes (AD)
AD 1: Aerodromes/heliports introduction
AD 2: Aerodromes
AD 3: Heliports
Here are 2 examples of AIPs of different countries:
Supplements: Temporary changes (shorter than 3 months)
The AIP will change in a cyclus of 28 days, this is not every month. The effective dates are worldwide described:
The AIP of the netherlands has changed every 28 days in the last months.
The new admendment changes has to be released 42 days before becoming effective so everyone has time to implement.
Notice to Airmen (NOTAMs)
NOTAMs are pieces of information that are important for day to day flight preparation. They are recognized as essential information before taking off.
NOTAMs are not published in the AIP, because this has two reasons:
The information is temporary
The information will be effective shortly
NOTAMs are effective information for pilots to know. Some examples of NOTAMs caused are:
Danger areas effective at a specific day
Restricted area effective
Obstacle anti collision light not working
Temporary changes at aerodrome (like a temporary displaced threshold at the runway)
High obstacle (crane) in the vicinity of the aerodrome
NOTAMs will be separated into 4 different classes:
A-series: International traffic and en-route traffic
B-series: National and international traffic
M-series: Military based notams which also must be read and obeyed by civil aviation
S-series: Special, snow, SNOWTAM
There also exists a ASHTAM, which is a very special and rare NOTAM which announces volcanic ash in the area. In the Netherlands, we don’t have volcanoes, only dykes. :)
Dutch pilots can view NOTAMs on the website https://homebriefing.nl, which is the International NOTAM office (NOF) of the Netherlands. Also NOTAMs from adjecent countries are announced in the Homebriefing website. This is part of the Aeronautical Fixed Service (AFS).
NOTAM code
NOTAMs are pronounced as partly coded information and some abbreviations. An example of a NOTAM effective at the day of writing this:
(A0116/26 NOTAMN
Q)EHAA/QOBCE/IV/M/A/000/999/5227N00531E005
A)EHLE B)2601120600 C)2604122200EST
E)MOBILE CRANE BTN PSN 522654.4N 0053040.1E AND 522656.6N
0053044.1E, BTN 553M AND 655M BEYOND THR RWY 05 AND 235M RIGHT FROM
RCL. 160FT AMSL, MARKED AND LGTD.)
I will break this NOTAM down:
NOTAM line
Description
A0116/26 NOTAMN
Series, number, (New)
Q)EHAA/QOBCE/IV/M/A/000/999/5227N00531E005
FIR Amsterdam, Obstacle, Crane, Erection, IFR/VFR
A)EHLE
Lelystad Airport
B)2601120600
Start time: January 12 2026 at 0600 UTC
C)2604122200EST
End time: April 12 2026 at 2200 UTC (Estimated)
E)MOBILE CRANE BTN PSN 522654.4N 0053040.1E AND 522656.6N 0053044.1E, BTN 553M AND 655M BEYOND THR RWY 05 AND 235M RIGHT FROM RCL. 160FT AMSL, MARKED AND LGTD
Crane at GPS coordinates, around 600 meters from threshold runway 05, 160FT AMSL high, marked and lighted.
As you can see, such NOTAM is very specific and contains safety messages. In this case we are warned for a crane possibly in our path, in case of making a emergency landing or go around.
In NOTAMs there will be used some abbreviations of general subjects that are used often:
Abbreviation
Full description
AD
Aerodrome
BTN
Between
DLY
Daily
EST
EST
EV
Every
FLG
Flashing
HEMS
Helicopter Emergency Medical Service
PJE
Parachute Jumping Exercise
PN
Prior Notice
PPR
Prior Permission Required
UAS
Unmanned Aircraft System
U/S
Unserviceable
WEF
With Effect From
WIP
Work in Progress
WO
Without
Aeronautical Information Circulars (AIC)
Some information is crucial to pilots but are not mentioned in the AIP or NOTAMs. Some practical messages. These will be distributed through the AIP but in his own tab:
Some practical things which could be mentioned there:
Warning for the increased use of laser pointers on the ground
Implementation of 5G, high usage of specific frequencies
An area with multiple unknown transmissions
Drone warnings
These AIC notifications are mentioned in 2 categories:
AIC-A: which are general or technical notifications for national and international aviation (only in English)
AIC-B: which are general or technical notifications for national aviation (in English and Dutch)
You see, same strategy as the NOTAMs.
Aviation maps
For VFR flights, some different maps are published through the LVNL website (or other website for different countries).
Visual Approach Chart: which is specific to each aerodrome on how to fly the approach and landing
Aerodrome Charts: which is specific to each aerodrome and contains taxiways, aprons and parking.
Each pilot is required to have the charts on board for the departure and destination aerodrome and execute the flight according to these charts.
Flight Preparation
Pilot in Command rules
Here we have all rules according to flight preparations which are effective to the pilot in command (PiC).
Each flight must have the pilot in command assigned and on board
The pilot in command is responsible for the safety for people in and outside of the plane
The pilot in command is responsible for a safe execution of the flight
The PiC must know all rules and follow them, except for distress situations (but leads to a huge process of debriefing)
The PiC must brief its passengers for safety informations, processes and brief other safety information of the plane
The passengers are required to follow all instructions the PiC gives
Pilot in Command responsibilities
The pilot in command is responsible for the following actions:
The aerodrome, facilities on the ground, communication tools and navigation tools are compatible with the planned flight
The plane is airworthy, which can be decided at the final time in the take-off roll
Maintenance is done correctly and checked by the pilot in command before executing the flight
All instruments crucial for a safe flight are working, checked according to the checklist and working before take-off
All required documents are on board
The mass and balance calculation is done and within limits
The pilot in command is not sick or in a bad healthy condition or drank alcohol in the 24 hours before the flight
Weather information
The Pilot in Command is required to study the weather forecast of the departure, arrival, alternate (1, 2, 3) and en-route circumstances. This can be done though METARs of airports, TAFs or simple methods like buienradar.nl (don’t use it as your main source).
Mandatory notifications
At some point in flights, the pilot in command is required to notify the autheorities of some possible things happening. He can do this himself or give this to the “pilot-monitoring”, but the PIC is responsible for the execution of all tasks.
Writing defects in the technical logbook of the plane
Dangerous/significant weather must be notified to the flight information services or ATC
In the case of a (possible) hijack, this must be reported to the authority (in Netherlands, the LVNL)
The pilot in command notifies the authorities after accidents with injuries or fatalities or with damage to properties or the plane
Flight Planning
Alternate airport(s)
The Pilot in Command is required to select an alternate airport in case a flight cannot be proceeded to the planned destination. It must have a alternate airport selected in the planning stage but is allowed to change this during the flight in case of technical failures, bad visibility or other problems.
Fuel and oil
The Pilot in Command is required to have enough fuel/energy on board to complete a flight, with enough space to also reach the altername without using the final reserve fuel (30-45 minutes).
By calculating the fuel, take the following things into account:
Weather
Your cruising altitude
Factors that effect plane performance
Possible delays or diversions in-flight (having to avoid a cumulonimbus cloud)
All unforseen circumstances in-flight
Final Reserve Fuel (FRF) requirements
The final reserve fuel is the last 30 (day) to 45 (night) minutes of fuel you have on board of your plane. In normal circumstances this may never be used. The PIC is responsible for having enough fuel/energy on board to ensure a safe landing.
At day we must have at least 30 minutes of final reserve fuel based on a holding pattern on 1500ft
At night we must have at least 45 minutes of final reserve fuel based on a holding pattern on 1500ft
If the holding usage is not known, you can use the best range speed. This is around 65-75 knots in a Cessna 172).
Fuel Management
The PiC is required to calculate the fuel usage and to prepare this into blocks. It must be known exactly what the final reserve fuel is, so in-flight this is clear.
If the final reserve fuel is used in flight the pilot must announce an emergency and land as soon as possible. This comes with a lot of debriefing processes and possible fines or penalties as result.
If landing on a controlled airfield, the pilot in command must notify ATC about minimum fuel. This is done by adding the words “MINIMUM FUEL” to the initial message, and possibly repeat this one or 2 times.
Tanking with passengers
When tanking with a flight of passengers, the following rules apply:
Passengers may never have the seatbelt on during taking
The ground cable must be connected at all times
The best is to board passengers after tanking is complete
Oxygen and pressure altitude
The plane must have enough oxygen and tools on board, especially in these situations:
Flying higher than 10.000ft AMSL for longer than 30 minutes
Flying higher than 13.000ft pressure altitude at all times
Ice
The plane may only start the take-off roll when no sign of ice is detected. Ice will negatively decrease lift and controlability of the plane.
If this happens in the air, the PiC must ASAP descend to an altitude the ice melts or even do a emergency landing.
Medical problems
The pilot in command will never proceed the flight if he is not medically able to complete a flight. This can result in a emergency landing.
Required instruments and tools
In Annex 6 of the Chicago treaty, there is described a minimum of instruments and tools on board before allowed to take-off. These are:
Instruments
Tools
RequiredatDay/Night
Magnetic compass
Clock, which counts hours, minutes and seconds
Day and Night
Altitude indicator
Spare circuit breakers (every type applicable)
Day and Night
Speed indicator
First aid kit (within reach)
Day and Night
-
Fire extinguisher
Day and Night
Artificial horizon
Navigation lights
Night only
Turn coordinator
Landing lights
Night only
Gyro compass
Strobe lights
Night only
Vertical speed indicator
Instrument lights
Night only
Vacuum/electric
Electrical torch for every crew member (phone)
Night only
The instruments and tools are not related.
Seats and seatbelts
Planes must have seats or lying places for people above 24 months
All seats must have 2-way seatbelts
Pilot seatbelts must have a shoulder harness (to avoid bumping head into dashboard)
All people on board must have their seatbelt on during take-off and landing
Pilots must wear their seatbelt at all times
Flying above water
Single engine planes which fly above water outside of glide distance to land (for a Cessna 172, 1.5NM per 1000ft altitude in good conditions), must have life jackets for every people on board. This must be within arms reach so it can be put on while having the seatbelt on.
Long flights (more than 50NM or 30 minutes) above water must have an additional risk assessment by the pilot in command (pic) like:
Distance to ground (no sea)
Sea conditions
Dinghies
Signalling stuff like flares or fireworks
Survival tools like first aid kits and food
Flights over uninhabited areas
Sometimes we need to fly above areas where there is no-one in the vicinity. In this case the plane needs to have:
Signalling tools like flares or fireworks
Survival tools like first aid kits and food
Mandatory documents on board
When flying a plane, the following documents (of every pilot) needs to be on board before even starting an aircraft (Page 131):
Flight crew license
Medical certificate
ID
Aircraft flight manual
Certificate of registration
Certificate of airworthiness
Airworthiness review certificate (ARC)
Noise certificate
Radio station license
Journey log/technical log
Third party insurance certificate
ATS flight plan
Up-to-date aviation charts, departure airfield, arrival airfield and alternate airfields
List of hijack procedures (page 40)
Information about search and rescue facilities in the flying area
International flights: Technical maintenance log
ICAO attachment for flying in an aircraft registered in another country
Other general information in the overflying or landing country
Now you definitely don’t want to take all those documents with you the whole time. You are allowed to have (digital) copies of the official documents in the plane while the official document is in the office. The only documents that needs to be the original:
Flight crew license
Airworthyness certificate
Medical certificate
Also according to NPA 2024-02, you are always required to have the latest published checklist for your aircraft on board.
Communication and navigation
For controlled flights (A to D airspace), you are required to have a VHF installation which can do two-way communication in the 118.000 to 137.000 MHz range and has 8.33KHz channel separation.
Also planes needs to have a Emergency Locator Transmitter on board. They have to transmit on 121.5 MHZ and 406 MHz.
A plane is also required to have an transponder on board with mode S (Code/Pressure altitude/Ident).
Lights
All planes have to enable their anti collision lights (strobe) during the day, if it has them built in.
During night flights (after sunset), enabling landing/taxi lights is required.
Navigation lights must be enabled as the plane starts the take-off roll till the moment it stops the landing roll.
The lights layout of an plane is:
The navigation lights can be both static and flashing.
Operational procedures (10)
In aviation, there are some procedures that needs remembering for different scenarios. You always must know what to do in certain situations.
We will talk about:
Bird strikes
Emergency landings
Precautionary landings
Contaminated runways
Bird strikes
When a plane collides with a bird, the plane can be moderately or heavily damaged. A famous example of a succesfull landing after a bird strike is the Hudson miracle, where an Airbus A320 hits a fluck of birds after take off and loses both of its engines.
So, if an Airbos A320 gets critical problems with birds, we certainly do with our Cessna.
The best thing is to try to avoid bird strikes at all times, however this may be impossible. The most chances of having to deal with birds in the Netherlands are:
Waterrich areas like Zeeland or Flevoland
Nature reservations
Airports
Garbage
On the VFR chart are some tips about high concentrations of birds measured and in the AIP under ENR 5.6 and ENR 6-5.3 there is actual reported information about bird migrations and riskfull areas.
Most bird strikes happen under 2500ft AGL. The highest chance is within the ground and 1000ft. The LVNL has some security measures because of this, it forbids flying over Zeeland and the Waddenzee below 1000ft AGL.
Sometimes high bird risks are mentioned in the NOTAMs, especially if they are reported to be around an aerodrome.
On a controlled airport, tge ATC, ATIS or NOTAMs can also mention birds as possible risk. ATC can also cancel your take-off or landing clearance if birds are detected. This can also happen on Final, so a go around is mandatory.
Bird strikes are part of the notification requirements. (161)
Emergency Landings
An emergency landing is known as a landing where your plane doesnt have forward power, so no engine(s) and a landing must be done. This is in case of an engine failure, smoke or fire.
We call a emergency landing on water “ditching”.
The pilot in command is responsable for the plane, passengers and goods until the authorities took this over.
The pilot in command is also required to notify ASAP the Onderzoeksraad voor veiligheid (OVV) and the national aviation authority (LVNL in the Netherlands).
Precautionary landing
An precautionary landing is a landing with power where resuming the flight is not safe, and the aircraft must be land to avoid the problems to be worse. This can be things like:
Engine stalls
Electrical smell or light smoke
Radio failure
Before doing a forced landing of this kind we need to do the following steps:
Transmitting an urgency message using PAN PAN, PAN PAN, PAN PAN
Search for a suitable spot
Against the wind
No obstacles
No animals
Not too close to houses or buildings
Inspection run, low fly by to inspect the predetermined land
Expect a short field or soft field landing, so execute it
Runway Contamination
Take-off and landing performance of a plane is very dependent on how the runway state is. Planes perform much better on a dry runway than on a wet or contaminated runway.
To brief pilots and ATC about runway states, we use 4 different states:
Contaminated: A runway which is at least for 25% covered with contamination
Wet: A runway where the surface can still be seen until 3mm of water
Damp: A wet, shiny runway without floods of water
Dry: A dry runway
Types of runway contamination:
Water
Frost
Ice
Wet ice
Slush (melting snow)
Dry snow
Wet snow
Compacted snow
For the states of runways in winter weather we have a SNOWTAM. These are spreaded using the same channels as normal NOTAMs. An example of a SNOWTAM:
Next to runway contamination states, we have also braking action. This is an index-number about how good the brakes work in a runway (higher is better)
Runway condition code
Pilot report of runway braking action
6
Perfect
5
Good
4
Good to Medium
3
Medium
2
Medium to Poor
1
Poor
0
Less than Poor
The problem with these codes is more or less that these are relative. On the same runway, the one pilot may say braking action 4 where another pilot with a much heavier plane may report 2.
Sound Nuisance
Planes that are not checked and certified with a valid sound document are forbidden to fly. Only some older planes can get a sort of exclusion, a sound description.
Sound classes and measures
To class airplanes based on their sound production, we have 8 sound classes, where silent is class 8 and very loud is class 1. The actual number is the number of decibels and this decides the class itself.
Sometimes an airport takes some measures for not producing too much sound. It can take some runways as preference, select different departure or arrival routes. A plane may also not make a turn lower than 500ft. (148)
Search and Rescue (11)
In case of a plane or multiple planes in danger, the procedure “Search and Rescue” will be started. This starts with 3 emergency phases:
INCERFA -> Uncertainty phase: ATC has not heard of the plane for 30 minutes
ALERFA -> Alert phase: In case of hijack or technical problems
DESTRESFA -> Distress phase: In case of technical problems, no fuel and a landing/crash will be made or is already done
ATC (FIC,ACC,TWR) is responsible for the alerting and notification services. If an uncontrolled flight without flight plan was being performed, the aerodrome leader is responsible (tower or a specific person).
Alerting by local ATC (TWR)
If an airplane is transferred to tower and does not contact tower or radio contact is lost and the plane does not land within 5 mintes, TWR must contact the ACC or FIC about this incident.
Tower is responsible for notifying fire trucks and or rescue operations in case of these situations:
Accidents on or in the vicinity of the airport
When information is received about an unsafe situation on a plane
When a plane itself requests this
The alerting messages will be transferred to the Rescue Coordination Center (RCC) and there the search and rescure procedure will be started. The official Joint Rescue Coordination Center JRCC in the netherlands is located in Den Helder, doing both maritime and aeronautical search and rescue operations.
The RCC itself is purely a coordination center and only notifies other parties like the Knoninklijke Marine, Luchtmacht, Douane or the police.
Notes to self for preparation
The country of registration sets the instrument colors and limits
In CTRs, the cloud-base must be at least 2500ft AMSL
Ground visibility is measured by a transmissometer
Aviation Services do flight information, alerting and traffic control
Amsterdam FIR has Local, Approach and Tower
If you have a radio errors before entering a CTR, land on the closest airport which is not in CTR
If you have radio errors after entering CTR, proceed according to plan and look for visual signs
EASA FCL is the Flight Crew Licensing part of law
The OVV does research for accidents in the netherlands with netherlands plane, netherlands plane in other countries, other country plane in the netherlands and netherlands plane on the sea
End of the page 🎉
You have reached the end of the page. You can navigate through other blog posts as well, share this post on X, LinkedIn and Reddit or return to the blog posts collection page. Thank you for visiting this post.
This page can contain a collection of personal notes, steps to remember, finished and unfinished content. Please excuse brevity.
Do not use specific information given like fuel flow, landing/take-off distances for your flights. Always refer to the POH of your exact plane for flight preparation. My information is just for references that I used.
Vacate will always be used to “leave a runway”. When leaving a circuit, we call out, leaving your circuit area.
When asking to stop squawk charlie, we have to disable the pressure altitude setting. This can be to set from ALT to Standby.
Non-spelled abbreviations
There are some abbreviations which we (aircrafts and ATC) don’t spell letter by letter because of the often use. These are:
Abbreviation
Full definition
ADF
Automatic Direction Finder
ATC
Air Traffic Control
CB
Cumulonimbus
CTR
Control Zone
DME
Distance Measuring Equipment
EET
Estimated Elapsed Time
ETA
Estimated Time of Arrival
ETD
Estimated Time of Departure
IFR
Instrument Flight Rules
ILS
Instrument Landing System
IMC
Instrument Meteorological Conditions
NDB
Non Directional Beacon
QDM
Magnetic groundcourse to beacon
QFE
Pressure on ground level
QNH
Pressure on mean sea level (AMSL)
TMA
Terminal Control/Maneuvering Area
UTC
Coordinated Universal Time
VFR
Visual Flight Rules
VHF
Very High Frequency (30MHz-300MHz)
VMC
Visual Meteorological Conditions
VOR
VHF Omnidirectional Range
Airspace classes
All around the world, we use 7 different airspace classes, devided into the letters A to G. To make it clear what every airspace is for, please refer to this table:
Class
IFR/VFR
Separation
Traffic Control/Information
Clearance required?
A
IFR*
All traffic
Control
Yes
B
IFR/VFR
All traffic
Control
Yes
C
IFR/VFR
VFR from IFR
Control for IFR Information for VFR
Yes
D
IFR/VFR
None
Information about VFR and IFR traffic
Yes
E
IFR/VFR
None
Information
No
F
IFR/VFR
None
Information
No
G
IFR/VFR
None
Information
No
*VFR traffic only permitted with clearance from ATC.
When the chart doesnt define an airspace for an area, this always will be Class G (geen in Dutch).
Taxi instructions
On the ground, driving our aircraft to the ramp, hangar or runway is called taxing. We could get some different instructions which we have to read back to ensure the pilot and ATC are on the same page, or else some huge accidents could happen.
Action
Read back
Give way to *aircraft description
Giving way to *aircraft description
Follow the *aircraft description
Following the *aircraft description
Expedite taxi
Expediting
Taxi slower
Slowing down
Taxi with caution
Taxiing with caution
Hold position
Holding
* Aircraft description could be something like a helicopter, a Boeing 737 or Cessna 172
Traffic information sentences
When signed in to the traffic information for a region with airspace classes D to G, we could get call outs to watch other traffic. As we don’t get instructions from information to fly certain headings, only information about other traffic we have to look out ourselves.
There are some phrases we could say when coming across other traffic, based on your action. As all planes in a region are required to sign into the same frequency, they will hear your action as well.
Phrase
Closing
Crossing from left to right
Opposite direction
Same direction
Overtaking
Fast/slow moving
No reported traffic
Distress calls
Distress calls are used when in immediate danger when an aircraft is in immediate danger, like an engine failure or electrical failure.
We must always include the following in a initial distress message, when possible of course. Remember: 1. Aviate, 2. Navigate and 3. Communicate
Mayday Mayday Mayday
Callsign
Type/Cause of distress
Intention
Position
Altitude and Heading
Radio communication in Emergency situations
An example of an distress call could be:
Type of sentence
Actual part of distress message
Initial announcement of distress
Mayday Mayday Mayday
Callsign
PH-JSV
Type/Cause of distress
Engine failure
Intention
Making an emergency landing
Position
10 miles south of Schiphol
Altitude and Heading
2500ft, heading 340
As it may be not possible to say this message out loud during emergency, at 2500ft we would have around 3,5 miles of glide distance with a Cessna 172 and with a speed of around 65 knots we would have only 200 seconds from the start of the failure to a possible emergency landing.
Scenario
Aircraft: Cessna 172
Altitude: 2500 ft AGL
Airspeed: 65 KIAS (best glide)
Assumptions: no wind, flaps up, propeller windmilling
Glide distance
Rule of thumb for a C172:
≈ 1.5 NM per 1000 ft
Calculation:
(2500 / 1000) × 1.5 ≈ 3.75 NM
≈ 6.9 km
Time available
Approximate glide ratio: ~9:1
At 65 kt:
Sink rate ≈ 730 ft/min
Time from 2500 ft:
2500 / 730 ≈ 3.4 minutes
≈ 200 seconds
Result
Time available: ~3–3.5 minutes (≈ 200 seconds)
Maximum glide distance: ~3.8 NM (≈ 7 km)
Watch me demonstrating the whole procedure succesfully on MSFS 2024 in a Cessna 172:
Pitch for the best glide speed (Vg) which is 65 knots in the Cessna 172
Orientate for a spot to land and stay in the vicinity
Troubleshoot the problem
Crank the engine at max 3 times
Shutoff all fuel flows
Disable ignition
Extend flaps when inbound to land
Disable Master switch
Butter the landing
This is an great example of having aviate on the first position, then navigating and if we have time left, communicate.
Visual messages
When a tower assumes your radio communication doesnt work, they could give you visual messages by shining light to you. These lights could have different meanings.
Color
Pattern
On the ground
In the air
Green
Flashing
Taxi clearance
Return to land
Green
Solid
Start clearance (start engines)
Landing clearance
White
Flashing
Return to the platform
Land here and taxi to platform
Red
Flashing
Leave the runway
Do NOT land here, unsafe
Red
Solid
Stop your aircraft immediately
Circle and avoid other traffic
Red
Flare
-
Do NOT land here, especially if cleared earlier.
Fixes and classes
When asking for a radio direction, we could given a heading/QDM with a specific class. This tells us how good the heading can be:
Class A: around 2 degrees of possible deviation
Class B: around 5 degrees of possible deviation
Class C: around 10 degrees of possible deviation
Class D: less accuracy then class C
This are the classes given by a ground direction finding station, but we can also get a fix when you combine multiple direction findings (QTF). The QTF is the QDR + variation.
Some ground stations have multiple stations which can directly give a fix, which will be made up by finding the direction from the multiple stations. These will give a fix with a specific class:
You have reached the end of the page. You can navigate through other blog posts as well, share this post on X, LinkedIn and Reddit or return to the blog posts collection page. Thank you for visiting this post.
Navigation and Flight Planning is a very important part of preparing your flights and knowing where to go in the air. When a flight is not properly prepared you can get several different kind of issues. These are the most pilot-caused problems in the air:
This page can contain a collection of personal notes, steps to remember, finished and unfinished content. Please excuse brevity.
Do not use specific information given like fuel flow, landing/take-off distances for your flights. Always refer to the POH of your exact plane for flight preparation. My information is just for references that I used.
Introduction to Navigation and Flight Planning
Navigation and Flight Planning is a very important part of preparing your flights and knowing where to go in the air. When a flight is not properly prepared you can get several different kind of issues. These are the most pilot-caused problems in the air:
Incorrect fuel calculation
Incorrect mass & balance calculation
Fail to read and understand NOTAMs
When planning a flight, we always make a A to B flight with an alternate as C. The alternate is mostly an airport in the vicinity of B, but can also be A. As we might revert back to A, we need to have at least double the fuel as we need for getting from A to B.
Runways, Take-off and landing
Runways are straight pieces of grass, asphalt or bitonimous where a plane can take off or land on. They always have 2 numbers, like 04 and 22. This indicates the magnetic heading of the runway based on magnetic north. This is by design so you could land a plane without navigation and only with your magnetic compass.
Runways have some characteristics which we should take into account before taking off and landing to make sure we can succeed or reject a take-off and that the runway is long enough for our plane to actually land.
We have the following abbreviations:
Take-off run available (TORA): this is the area we can run-up our plane to rotation speed, or where we actually lift off the ground
Clearway: is is a piece of extra cleared area after the runway to lift off our aircraft to at least 50ft above the ground. This can also be water, if the elevation of the runway is higher than the water.
Landing distance available (LDA): this is the area where can land the plane in normal conditions, without the stopway at the end.
Stopway: this is a designated piece of extra runway to stop our aircraft if overshooting the normal runway
Displaced threshold: this is the part at the start of the runway with the arrows, its meant to extend the runway for take off but not meant to used for landing, only in case of emergency.
Accelerated stop distance available (ASDA): this is the area where we can take-off and reject our take off. ASDA includes the stopway and the displaced threshold.
Take-off distance available (TODA): This is the sum of the displaced threshold, LDA and clearway. Also lnown as the area where we can start our take-off till we hit 50 feet.
When calculating your take-off and landing performances, numbers may never exceed those numbers above. You can find the actual numbers in the AIP.
International Standard Atmosphere (1)
Worldwide, we have the same default settings for our standard atmosphere on sea level:
Temperature: 15 degrees celsius
Air pressure: 1013 hpa (29.92 mmHg)
Air density is 1,225 kg air per cubical meter (m3)
Vertical air gradient is -2 degrees per 1000ft (-6 degrees per 1km or 0,65 degrees celsius per 100 meters)
Nitrogen: 78% (stikstof)
Oxygen: 21% (zuurstof)
Carbon: 0,03%
Gasses: 0,9%
Humidity
On around 18.000ft the airpressure is half of sea level pressure (500hPa), and on 36.000 ft, the temperature is around 56,5 degrees celsius.
We have multiple layers in the air:
Troposphere: ground to 36.000 ft
“Tropopauze at 36.000ft which can defer day to day”
Stratosphere: 36.000ft to 160.000 ft
Pressure Altitude
Pressure altitude is the altitude corrected to the International Standard Atmosphere, namely 1013 hPa (which is also called QNE). For performing take-off calculations, we will want to know how our plane performs which can be different with different pressures. This is a live indicator of being above or below earth’s standard atmosphere.
In short:
Higher pressures (Low altitiudes): Better engine performance, better propellor performance and more lift
More oxygen and more air molecules
Lower pressures (High altitudes): Less engine performance, less propellor performance and less lift
Pressure altitude examples
In an airport which mostly is lower or higher than mean sea level, there will be a small correction needed. For example, our airport is at 17 feet above sea level, and the actual pressure is 1032 hPa on sea level at a day with nice weather, the pressure altitude is -489 ft. This means our take-off performance will be better as we have more air molecules which is better for our engine.
In the same example with a pressure of 968 hPa on sea level, we will have a pressure altitude of 1238ft. This means our aircraft will perform as it takes off at 1238ft above sea level, which will have some disadvantages. As there is less air, we will need a longer runway, our engine performance is less and our lift will be less as there is less air. However, flying in relative high pressure altitudes is good for having speed, as drag decreases in lower pressure.
As you can already see, this example gives two completely different scenario’s with around 1700ft difference. In countries like the USA where airstrips can be at 5000ft altitude, the pressure can be a huge difference which we must take into account.
Now we know the pressure altitude, we need to correct it for Density altitude, because warmer air is thinner than colder air. This is because warmer air expands, just take a look at a hot air balloon. This means that on 5000ft pressure altitude and on a hot day of 35 degrees, the density altitude (also known as “performance altitude”) will be almost 9000ft. So we can expect our plane to behave as it is on 9000ft in normal ISA conditions.
Thinner air means less oxygen and less air molecules, denser air means more air for lift for both propellor and the wings. Less oxygen also means less engine performance but a higher true airspeed due of less resistance from air molecules.
To calculate the density altitude from pressure altude, you can use the E6B or the tool below:
Tip: Use an E6B calculator for a quick and thorough calculation of Density altitude based on the outside air temperature (OAT) and pressure altitude.
GPS coordinates and Earth
GPS coordinates are made to navigate and pinpoint certain places in the world. In aviation, we mostly use these 2 possible notations;
Decimal: 51,
Degrees, minutes and seconds (DMS): 51 degrees, 30 minutes and 30 seconds
The equator and 0-meridian is the actual 0 point of earth. From there we look up the coordinates:
For reference, the Netherlands lies between 50 and 54 degrees North, and 4 and 7 degrees East.
In a degree goes 60 minutes, where each minute is around 1 nautical mile (zeemijl), and this is 1852 meters. This is measured on a meridian, not on the parralels.
Transponder communication and usability
The transponder on board of an airplane is used by Secundary Surveillance Radar (SSR) to identify the blips shown on the map. In the plane, a device called the Transponder is turned on and sending out signals in pulses at around 1090MHz. This pulse consists of 4 digits and the transponder has several modes:
Mode A: Squawk code
Mode C: Pressure altitude (not AGL/MSL!) but measured on the ISA pressure -> QNH 1013
Mode S: “Selective” (identify code, TCAS, etc.)
Mode C also contains the code and mode S also contains the pro’s of mode C, this is cumulative.
ATC can ask for your transponder capability, you can say “Transponder capability Sierra” for Mode S transponders.
Map projections (15)
To project the globe which is a round object, we can use multiple different projections, each with their pro’s and cons.
Type
Pro’s
Cons
Mercator (Cylindrical)
Conform = Hoekgetrouw* Medians and parralels are straight lines
Greenland looks equal size to Africa but Africa is 14 times the size Poles are not shown correctly
Lambert (Cone)
Conform = Hoekgetrouw* Partly Equadistantie = Afstandsgetrouw Medians and parralels are shown curved
More complex because of the rounded shape
* main property
This makes clear that poth projections are great in their own use:
Mercator for whole world navigation -> like a complete map
Lambert for small regional navigation -> like VFR charts
Then we have “Grootcirkels” and “Loxodromen” (Rhumb lines), which are different on both types of maps:
Projection
Medians
Grootcirkel
Loxodroom
Mercator
Straight lines
Curved
Straight line
Lambert
Slope in lines because of conal shape
Straight line
Curved
A loxodroom means that a line on a chart hits all medians under the same angle (same degrees). This is why a loxodroom is straight on the mercator chart and curved on the curved lambert chart.
Planes fly mostly loxodromische routes on one fixed heading, the magenta line on the Primary Flight Display.
In the Lambert Conformal Conic Projection, construction means that the parralels defer between the default parralels.
The shapes to remember:
Lambert -> Loxodroom -> Hol Pool
Mercator -> Grootcirkel -> Bol Pool
Planet earth (14)
Earth is no perfect ball but is a ellipsoid.
Earth has “Grootcirkels” and “Kleincirkels”
Great circle is a circle which combines with the middle
Small circle is a smaller circle which not combines with the middle
The equator devides earth into the north side and the south side. When the north side has summer, the other side has winter. We also have 2 extra parralels small circles above and below the equator:
Tropic of cancer (Kreeftskeerkring) at 23.5 degrees north
Tropic (Steenbokskeerkring) at 23.5 degrees south
And then we have 2 polar circles, which are a indication of the angle the sun as opposing the north/south axis of the earth (which causes the different seasons):
North artic circle: 66.5 degrees north
South artic circle: 66.5 degrees south
Parralels
There are parralels at each 10 degrees that horizontally divide earth
The equator is the only groot circle which also is a parralel
There are also some meridianen which goes from north to south only, and so look like half-groot cirkels. These are comparable to the timezones
Earth turns 15 degrees per hour (1 degree per 4 minutes) so 3 degrees on the chart is 12 minutes
180 degrees median is the date-line next to new sealand. The 0 median is the UTC line
Earth is 40.075 kilometers long measured on the equator parralel
Earth is 40.008 kilometers long measured on the 0 degree meridian
This is divided into 360 degrees medians
One minute on such median is 1.852 meters or exactly one nautical mile (NM). However, this is on average. At around 60 degrees north or south, one nautical mile is actually 2 minutes, cutting this in half.
One minute on a parralel is around 1856 meters, so more distance and longer time horizontally
True north vs. Magnetic north vs. Compass north (16)
In aviation we have different types of norths, called the True north, magnetic north and compass north. All three sounds the same but are different of course.
True north: This is the north that is displayed by charts, atlasses and small-scale globes. This is also the location where the icebears live.
Magnetic north: This is the north decided by earth’s magnetic field. This changes over the years, and lies now somewhere in the north side of Canada (around 1100km from the true north)
Compass north: This is the north displayed by your compass, which will be a minor correction to the magnetic north. The actual difference can be found on the calibration chart:
For the actual magnetic heading of 330 degrees, we have to steer 328 on the magnetic compass. This difference is mostly somewhere around 0 to 5 degrees.
Then we have multiple corrections we have to take into account:
Deviation
Magnetic north and compass north
Afwijking of the compass in a plane due to correction and magnetic field of radio/electronics
Listed as +2 or minus 2 what means: the compass reads 2 degrees more or less than the magnetic north (Thisdeviation is caused by not using the compass/standing still of the plane and is measured every maintenance)
Variation
Magnetic north and true north
Afwijking of the magnetic north
Example: VAR 2 W decreasing 7’ annually
Correction (miswijzing)
The sum of deviation and variation summed up (or subtracted) gives you the correction of what to fly with your specific aircraft based on the magnetic compass
We can make multiple calculations with these numbers:
This variates between west and east. We use the guideline: East = least (-) and West = best (+) but this only applies when going from magnetic to true/planned chart route.
For true/planned chart route back to magnetic is the calculation reversed, we have to subtract west and add east. This is due to the slight west position of the magnetic course.
Course: This is the direction you are planning to fly
Heading: This is the direction your nose of the plane is pointing at, which han change due to wind
Track: The actual line flown with the wind taken into account
Example:
You plan to fly 90 degrees. This is your course planned on the chart (Course)
The wind is coming from 360 degrees and blowing you to the south, you keep 100 degrees (Heading)
Your True track is then 90 degrees as you correct your heading for the wind (true track)
Then we can base these courses on True North (charts), Magnetic North (on board) and Compass Heading (on board).
1 Kts is 1 nautical mile per hour which is 0,5 meter per second
One minute on a median is 1 nautical mile (NM)
Actieradius is both to and returning to your starting point (A - B and B - A)
Range is only A to B
Scale of a map is projected like this:
1:500.000 is 1 cm on the map is 500.000 cm in real life (or 5 kilometers)
Time (19)
The apparent solar time is the actual time based on 12 o clock noon -> highest sun point
Local time is regional time of the country, UTC is Greenwich time
Standard time is the time of a country (actual time)
Local Mean Time (LMT) is the actual sun time based on the setting of the sun -> linked to closest meridian
Time notation can be done in various ways:
1345
13:45
13:45 UTC
13:45 Z
13:45 LT (Local Time)
Calculate UTC from LMT
We can calculate the LMT from the actual time:
1 degree is 4 minutes
1 median minute is 4 seconds
Pick the distance from your location to your actual time median and calculate the difference
Uniform Daylight period is the calibrated daylight time, + 15 minutes before sunrise and + 15 minutes after sunlight.
VFR Navigation (20)
Navigation in VFR is done based on visual references, track calculations and wind calculations. Because the wind is a mass of air where the plane flies in, we will arribe at our destination “together with the wind”. Which means we have to correct our track for the wind.
Before going into the deep explaination, let’s process all the different terms we must know:
Gispositie: Your destination with the wind taken into account, but not entirely sure.
True position/Fix: A fix where you cross referenced chart/GPS with what you see outside and confirmed
Wind-triangle
Air vector (1 triangle)
Ground vector (2 triangles)
Wind vector (3 triangles)
Ground course: This is the track to be flown relative to the ground
True track (TT) -> Track based on true north
Magnetic track (MT/MC) -> track based on magnetic north
Intended track: This is the chart-based ground track to be flown
Actual track: This is the actual track flown to correct the wind
Track error: this is how much degrees you must steer to your intended track if deviated (100 degrees intended, 90 true heading is 10 degrees track error). This is also the difference between true track and actual track if there is no wind.
Drift: This is the amount of degrees between the intended and actual track to correct for the wind (opposite of the wind correction angle WCA is 7 degrees right means drift is 7 degrees left)
Heading (air course): Amount of degrees based on the north where the plane flies to in the air
True heading: Course based on true north
True track: the flying track based on true north, and so on your VFR map
Magnetic heading: Course based on magnetic north
Magnetic course: the glying track based on magnetic north
Compass heading: Magnetic corse with compass error correction added/subtracted
Wind correction angle (opstuurhoek): this is the angle between the intended ground heading and the true heading (what to correct)
Isogonic line: A line on a chart that represents the local magnetic variation
Agonic line: A line on a chart that represents a magnetic variation of 0 degrees
If there is no wind, the air track, intended track and actual track are all the same value.
The wind triangle
The movement of the plane relative to the ground is decided by three vectors:
The air vector -> Heading and True airspeed (TAS)
The ground vector -> Track and ground speed (GS)
The wind vector -> Wind direction and speed (260 at 8 knots)
The numbers correspond with the arrows/triangles in the drawings, but we calculate in the order 1, 3 and then 2.
Air vector
The air vector’s length is based on the true airspeed and course based on the true heading. The start position is called the true position.
Wind vector
The wind has a speed and track, but wind is pronounced where the wind comes from. This is the opposite of planes because it makes calculations easier.
Ground vector
Now we know those two values, we can make an airplot. This gives us the result of the track incl. wind correction, basically the ground vector.
Calculating Tailwind/Crosswind components
We can calculate the headwind and crosswind components with the sinus and cosinus to have a better understanding of the actual wind blowing against your plane:
Crosswind = sin(wind direction - ground course) x wind speed
Example: sin (270-285) x 12 = -3,1 knots
This means wind comes from the left with 3 knots blowing you to the right
Head/Tailwind = cos (wind direction - ground course) x wind speed
Example: cos (270-285) x 12 = 11,6 knots headwind
This means from the 12 knots wind, we get 11 knots onto head and 3 knots from cross.
You could also use these numbers to remember quickly (or take a E6-B on board)
Wind angle
Factor crosswind (sinus)
Factor Head/tailwind (cosinus)
30 degrees
0,5
0,9
45 degrees
0,7
0,7
60 degrees
0,9
0,5
Example: your heading is 180, wind comes with 15 knots from 223. Difference is 43 degrees, we pick 45:
15 knots x 0,7 = 10,9 knots crosswind
15 knots x 0,7 = 10,9 knots headwind
Track error correction by incorrect steering
If deviated from the original route, we must correct this by steering the opposite way. But how much, that is something we can calculate.
We can use the 1 on 60 rule: every degree off from the intended route will result 1 nautical mile (NM) on a distance of 60 nautical miles.
Example: After 20 NM you are 2 NM from track. We will calculate this to 60 miles, which is times 3: 6 NM deviation every 60 NM. This means also 6 degrees off track.
To correct the course, we must multiply this correction times 2 to get to the original track. This is called the track error (trekfout).
Best fuel consumption methods
To fly to a far aerodrome, fly maximum range by leaning the mixture, with tailwind and minimize drag
To maximize endurance, fly as low as possible with minimal RPM
Als keep in mind that the disadvantages of wind are greater than the advantages. For example:
We fly from our starting point to the east (090) with 100 knots (IAS).
We have a wind from west to east (270) with 25 knots.
Our ground speed (GS) will be 125 knots
This means we are 125 nautical miles from our starting point after 60 minutes
If we turn around, we fly into the wind which will slow us down, because we don’t have tailwind anymore our speed is back at 100 knots. In fact we have to subtract those 25 knots of wind from our ground speed
We fly back to the starting point with 75 knots of ground speed (GS)
However, this will take 100 minutes (1h40m) (125 nautical miles / 75 knots * 60 is 100 minutes)
Automatic Direction Finding (25)
Automatic Direction Finders or ADF in short is a piece of hardware in the plane that can contact Non directional Beacons (NDB) beacons on the ground to find the correct direction to it. It is basically tuning the frequency when in range and then read the direction the signal comes from. The frequency of ADF works between 190 kHz and 1750 kHz (LF and MF). Most NBD beacons use a frequency between 250 kHz and 550 kHz.
The plane only contains a directional-sensitive receiving system, in these 3 parts:
Antenna system
Control panel to tune the frequencies
Indicator
the ADF has three important buttons:
ADF: this turns the device on, and another press enables the ANT mode which is used for testing only.
BFO: Identify NDBs
FRQ: to switch between stand-by and active frequency
Your ADF system in the plane only connects to NBD beacons (sometimes reffered as locators) on the ground. It then shows a relative bearing to the beacon, based on the heading of the plane. It basically says, turn till the plane in the middle of the indicator and the line are aligned.
Relative bearing: The angle to turn to exactly the beacon
Compass heading: The actual compass heading
Compass bearing: The solution of the sum Compass heading + Relative Bearing
Example: We fly at 173 degrees and our ADF indicator says “69”, we sum those up and that gives us 242 degrees. We have to fly 242 degrees on our compass to fly directly to the beacon. This because the ADF gives us a relative bearing, so the “langsas” of the plane is 0 degrees.
Bearing means “peiling” in Dutch.
Now we must make it harder, we can do a magnetic bearing to the NDB beacon. We take the outcome of the sum above the blue bar and put into a new sum.
Compass bearing + deviation = magnetic bearing. This magnetic bearing is the QDM, also called, the ground track to follow to reach the NDB. The reverse of the QDM is called the QDR, which is from beacon to the plan. We have to add 180 degrees to the QDM to get the QDR.
Example: our compass bearing is 242 degrees. Our deviation is 4 degrees west (indicates too much west) so we have to subtract it. The magnetic bearing is 238 degrees.
Now we could correct this number on top of all for the true north instead of magnetic north, which gives us the “true bearing”: Magnetic bearing + variation
Example variation east: Magnetic bearing 238 + variation (2,45 degrees east) = 240,45 degrees
Example variation west: Magnetic bearing 238 + variation (2,45 degrees west) = 235,15 degrees
Look at how the variation can change the headings, because we go from magnetic to true, we have to subtract west and add east. In the case of true/chart to magnetic this flip-flops.
ADF indicators
We have 2 types of ADF indicators:
Relative Bearing Indicator (RBI) (Left)
Radio magnetic indicator (RMI): This is a indicator that has a gyro in it and turns with the magnetic compass. This shows the actual QDM at any time. Ligher aircraft doesn’t have a RMI.
In the RMI, the green arrow is the QDM.
NDB beacons are the oldest type of beacons and are only used today as holding points. Today we have VOR/DME beacons and also the more user-friendly GPS.
NDB beacons have a range of about 10-25 NM
NDB beacons are “locators” and shows with a “L” on maps. SOmetimes they are used as approach locators.
En route beacons could have a range up to 200 NM.
Reliability
A NDB beacon is not always reliable. These are factors that plays when using NDB beacons:
Transmit power of the transmitter
Weather -> rain and thunderstorms
Around 6 degrees correction
LF/MF frequency so much affection by terrain
Night effect -> skywaves (less range and interference)
Coast-effect -> Curving radio waves due to sand and sea -> Rely on visual navigation in coastal areas
Mountain effect -> curved lines/multi-path effect due to bouncing of signal
Interference of other NDBs
VOR Navigation (26)
VOR beacons are the next evolution on top of ADF where most of the issues with ADF are fixed.
VOR stands for VHF Omnidirectional Range, and sends signals to every radial around it. It also works on VHF which makes the range and interference much better. The frequency range is 108.0 MHz to 117.975 MHz.
VORs are always based on magnetic north.
Its works basically like this: tune to the VOR frequency and your CDI will show an arrow to the beacon. On top of ADF you can select where to join the VOR radial and navigate to that. It also dhows course deviations with the needle. Also it shows if going to or from the beacon. With DME we could also measure the distance to the beacon where we will go dive in deeper in the next module.
VOR has the following advantages on top of ADF
Less interference
Less reliant on weather
No strange side effects
Better navigation as you select where to get to the VOR
Selectable on navigation frequency
Better precision
A VOR is an hexagon on the chart. If its outlined with a square, it also has DME.
VOR beacons push out 2 different signals:
Reference signal: A signal which sends out signals for verification. This also contains a MORSE code to verify you are on the right VOR
Variable signal: A lighthouse-like signal that varies over all the radials to send out a signal which planes can receive. Thus it knows where to navigate to
VOR navigates you to the magnetic north, so 0 degrees on the VOR radial is to the magnetic north. We also have to take the local variation of the beacon into account which also would be on the map.
The instrument to use with VOR beacons is the Omni Bearing Indicator (OBI), which contains the CDI (needle) and the selector (OBS) to set the desired radial of the beacon. It also shows “From” and “To”, to point out if you are flying to the beacon or flying away from it. Later more about that.
The horizontal needle represents the course/track to the beacon radial, where needle right means you are too much to the left. This is based on the view of the beacon itself. Each dot/stripe is 2 degrees off the selected radial (330 degrees in this case). The needle represents the track you must fly to get to the selected radial of the beacon.
You will select 330 degrees if you want to overfly the beacon with a heading of 330 degrees. Its as simple as that. The from region will then be 330 + and -90 degrees and the to region 330 - 180 = 150 degrees, 90 + or - that number.
Radial: The line you are on (above screenshot: radial 150)
Magnetic ground track (above screenshot: 330 degrees
CDI: Course deviation Indicator/needle -> shows the correct track to steer to overfly the station at selected magnetic heading
To/From: Shows if you are flying to or away from your selected radial - and + 90 degrees of your selected heading
To/From indicator
The to and from indicators are shown on the right side of the indicator and will tell you if you are flying the right way. We could fly heading 0 degrees and are north of the indicator. It will then show as if we are south and flying to it. The to/from indicator will then show “From” as we are currently flying away from it. The signal will be sent into the radial but otherwise there wont be a note to tell you if the direction is correct.
As we then select the 180 degrees radial, the indicator will switch “To”. We could also use the “from” course if we need to fly 240 degrees over the beacon and then for 10 miles further.
Using the VOR navigation equipment
In the cockpit we have a separate radio for navigation. We need to tune to the frequency to start using the beacon. The frequency is on your VFR map or app.
We can tune to the frequency and set it as active to make the OBI adjust to the beacon. You can also press the IDENT button to get the unique morse code which is also on the map.
Using multiple VORs can help you getting a “fix”, or a real position as you know where you are relative to a beacon. Useful when you are lost or lost your visual references.
The range of a VOR beacon is the same as with normal VHF radios and can be calculated with this formula:
1,23 * (√antenna elevation in ft) + (√plane altitude in ft)
Let’s say, the antenna height is 1000ft and our altitude is 13.400ft:
1,23 * (√1000)+(√13400)= 181,27 nautical miles (NM)
Horizontal Situation Indicator (HSI)
In newer planes, we will have a HSI instead of a CDI. This new variant doesnt use FROM/To but always shows the correct direction with an arrow. It always leads you to the correct heading and shows if on or off course to the beacon.
GPS errors
GPS is a great navigational system, but comes with different possible errors:
Propagation errors can occur due to the ionosphere
Geometry errors can occur due to close positioning of satallites
Atomclocks in GPS satallites can be restored in the Master Control Station
A GPS satallite sends out 2 codes.
To get a two-dimensional (2D) fix from GPS (length and width), you need at least 3 satallies
To get a three-dimensional (3D) fix from GPS (length, width and altitude above ground), you need at least 4 satallites
1-in-60 rule
The 1 in 60 rule is a quick method to estimate how far off course you are without using trigonometry.
It is based on this practical approximation:
After traveling 60 units of distance, an error of 1 unit sideways equals an error of 1 degree.
This works because for small angles, the tangent of the angle is approximately equal to the angle itself (in degrees). It relies on small-angle approximation, which is why it is accurate for normal navigation errors.
You can use these simple calculations and I have some examples below:
Miles off track * 60 / Miles flown = Track error in degrees (trekfout)
Miles off track * 60 / Miles left = Correction angle (sluithoek)
When you only have the amount of degrees:
Track error in degrees * miles flown / 60 = Track error in NM (reverse of the calculations above)
Miles off track * 60 / Miles left = Correction angle (sluithoek)
For example:
We plan to fly a route of 88NM in total
After 63 NM, we find ourselves at 4 NM off track with 25 NM to go
We do 4 * 60 / 63 which gets us 3,8 degrees off track in 60 minutes
We do 4 * 60 / 25 which gives us 9,6 degrees which we have to correct
This means we have to fly 3,8 degrees to correct our heading + we have to add 9,6 degrees to actually get at our destination. From the heading we have flown, subtract 13,4 degrees
Example 1 – Finding heading error
You planned to fly 60 nautical miles, but you end up 1 NM off course.
Solution is 48.8567° and we have to do this for both north/south and west/east
Decimal to time
This formula shows how to calculate the time/DMS notation if you only have decimals.
Formula:
Degrees + (Minutes x 60) + (Seconds × 60)
Example:
40.6892°
Degrees: 40
Minutes: 0,6892 x 60 = 41.352 rounded to 41
Seconds: 0.352 × 60 = 21,1 rounded to 21
Solution: 40 degrees, 41 minutes and 21 seconds, in short 40° 41′ 21"
ISA to temperature on altitude
To calculate from ISA (15 degrees celsius on 1013 hpa) to a certain ground temperature on a specific altitude, use this calculation.
Example 1: Ground temperature is 26 degrees and elevation is 1650ft. The QNH is 1013
1650ft / 1000ft * 2 degrees per 1000 feet is 3,3. This means it’s 3,3 degrees warmer than ISA which must be taken into account for density altitude calculations
Example 2: Outside air temperature (OAT) means on the altitude is -9 degrees and elevation is 6225ft. The QNH is 1002
1013-1002 = 11 * 30 ft hpa is 330ft difference. The pressure is lower than 1013 so we add this to the actual altitude to get the pressure altitude: 6555ft
6555 / 1000ft * 2 degrees per 1000 feet is 13.11 degrees.
ISA temp is 15 - our temp 13.11 is 1,89 degrees according to ISA. But the actual OAT is -9 so its -9-1,89 = -10,8 degrees colder than ISA.
This can now be dialed on the E6B to get the actual density altitude:
Pressure altitude: 6555
OAT: -10,8
Gets you the density altitude of around 5000 feet.
Example 3: Density Altitude is 12.000, OAT is +20 degrees, calculate pressure altitude
12 x -2 + 15 (ISA) = -9
20 - (-9) = 29 degrees on the ground
120 feet per degree is 120 x 29 = 3.480 feet to subtract from density altitude
12.000 feet DA - 3.480 is 8520ft pressure altitude
Speed and distance to time
115 knots
73 Nautical mile
distance : speed = time (decimal) * 60 is time in minutes
73 : 115 * 60 is 38 minutes
Distance and time to speed
320NM
2 hours and 23 minutes
Hours and minutes to decimal -> 143 minutes
Distance : time * 60 = Speed in knots
Speed, distance and fuel flow
Speed is 125 kts
Distance is 105 NM
Fuel flow is 2,5 GPH (US Gallons per hour)
105 : 125 = 0,84 hours -> 2,5 * 0,84 = 2,1 US Gallon (x 6 to LBS if fuel density is 0,72 kg/l)
True Track/Compass Heading questions
To calculate questions about certain headings with variation and deviation into place, we can use the following abbreviation:
Cadbury - Compass heading
Diary - Deviation
Milk - Magnetic Heading
Very - Variation
Tasty - True Heading
Dr(iving) - Drift (or WCA)
TTrucks - True Track (ware kaartkoers)
Let’s say, we have a True Track of 352 degrees, and we want to know some of the other values. Let’s do this:
C
D
M
V
T
Dr
TT
352
Now we can fill in the blanks step by step to get to the actual other values correctly and in the correct manner:
C
D
M
V
T
Dr
TT
358
5W
353
11W
342
10R
352
Left to right: Subtract (-) West and Add (+)East numbers (LR -W +E)
Right to left: Subtract (-) East and Add (+) West numbers (RL +W -E)
The Total compass error is the sum between true heading and compass heading, exactly in this format. A positive digit will give you an east error and a negative digit will give you a west error.
Temperature and altitude correction
Vuistregel: 4 ft correctie per °C temperatuurafwijking (per 1000 ft hoogteverschil)
Dat betekent:
Temperatuur 1°C kouder dan ISA → 4 ft extra fout per 1000 ft
Temperatuur 10°C kouder dan ISA → 40 ft fout per 1000 ft
Temperatuur 30°C kouder dan ISA → 120 ft fout per 1000 ft
Headings/courses extra
CH 098°; deviatie +2°; variatie -8°; drift 5° L. Bereken de TT.
Kompasluchtkoers (CH) 317°; deviatie +3°; variatie 5°W; drift 10°R. Bereken de ware grondkoers (TT).
TH 358°; MH 352°; deviatie +3°. Bereken de miswijzing.
CH 317°; deviatie +3°; variatie 5°W. Opstuurhoek 10°R; er is geen trekfout. Bereken de TT.
CH 054°; deviatie +3°; variatie 5°E. Bereken de TH.
CH 224°; deviatie -3°; variatie 4°W. Bereken de TH.
CH 098°; deviatie +2°; variatie -8°; drift 5° L. Bereken de TT.
With the E6B flight computer, we can calculate a lot of different things. On the front side, we can calculate and convert units. The other side is used to calculate true heading based on true track and the wind component. Also we get an indication of what our speed will be.
Unit conversion
Calculating Density altitude from pressure altitude and temperature
Calculating true airspeed with altitude, Calibrated Airspeed (CAS) and temperature
Calculating drift and wind correction angle
True airspeed and wind to ground speed
Raw notes (exam preparation)
Lambert chart (VFR Netherlands) is conform, which means angle-corrected (hoekgetrouw)
Lambert chart has straight meridians
Lambert chart has crossing meridians and parralels in 90 degrees angles
DME always gives one decimal: so 2 nautical miles will be presented as 2.0
A plane following a straight heading, also follows a loxodrome
Meridians are both groot cirkels and loxodromes
A grootcirkel is the shortest route and requires continious steering
Meridian conversion is the angle of meridians and the 0 on the mercator-projection
In the flight plan, you always mention the true airspeed (TAS).
To get relative bearing, you do QDM - heading
The wind vector can be determined by the air and true position (2 of the 3 of the triangle)
WCA - track error is drift
The wind-angle is the angle between wind and the true track
Semi-circular altitude system will be determined based on magnetic ground course
On the VFR chart, airports will be marked with elevation and then the runway length
Time depends on the geographic length, every 15 degrees represents 1 hour, 1 degree per 4 minutes, 1 parralel minute per 4 seconds
To do examenvoorbereiding:
VOR Beacons
Trekfout
ADF/Relative bearings
End of the page 🎉
You have reached the end of the page. You can navigate through other blog posts as well, share this post on X, LinkedIn and Reddit or return to the blog posts collection page. Thank you for visiting this post.
This category contains pages about Radio Technology and communication strategies.
Flight RT Course notes
This page contains the notes I wrote down while following the Radio-telephony VFR course. I have completed the VFR Radio Telephony rating on November 14 in 2025.
This page can contain a collection of personal notes, steps to remember, finished and unfinished content. Please excuse brevity.
Do not use specific information given like fuel flow, landing/take-off distances for your flights. Always refer to the POH of your exact plane for flight preparation. My information is just for references that I used.
Module 1: Introduction to Radio Technology
In aviation, we communicate by radio technology. A plane and a ground station both use radio’s to communicate with each other, so an aircraft knows how to fly a route and the tower can communicate with the pilots to give them clearance and such.
The main language in radio technology is English, but is no default language. In countries such as France, it can happen that the tower starts with French and then having to ask for English. Before you can achieve any pilot license, you first need to achieve a Language Proficiency Endorsement (LPE). Here you get a score from 1 to 6. You must score a 4 or higher to pass.
Communication in general is very important. How often you come across events in real-life where two people didn’t know things of each other, forgot things or misinterpreted sayings different as an other person. In aviation, this can make a difference in life or death, so good communication and following the guidelines is very, very important.
An example of where communication gone fully wrong was the Tenerife 1977 disaster, where there were much more factors btw, but good communication could have prevented it from happening, it was the last factor.
Sound moves with a speed of 330 meter per second, which is around 1188 km/u and are vibrations, which can be seen as waves. The length of the soundwave is equal to the tone-height (in Hz) and the height of the soundwave is equal to the volume (amplitude).
Waves mean frequency, which we will pronounce in waves per second, or simply Hertz (Hz). We can calculate the speed of soundwaves with this formula:
Wavelength x Frequency is Speed (G x F = V)
Mostly, radiowaves will make its way with the speed of light, which is aroung 300.000.000 meters per second.
This way we can also calculate the other way around, if we don’t know the wavelength:
Speed / Frequency = Wavelength
Because radio waves are not receivable from anywhere, just like a flashlight will stopped being visible, we can calculate the maximum distance of our radio waves with this formula:
1,2 x (**√altitude+√**antennaheight) =
For example, we are flying at 15.300 feet and our antenna is at 247ft height:
*1,2 x (**√15300+√*247) = 167,29 nautical mile (NM) (309 km)
So if we are within a 167 nautical mile circle of the ground antenna, we could have a connection with it. We can also use this formula to calculate the distance to another plane. But be aware, we are talking about the maximum distance, which means all variables must be perfect. In practice, the distance can be a lot less.
Aviation radio frequencies are between 118 MHz and 136.975 MHz. The range from 108 to 118 are reserved for VOR navigational beacons. When calling out radio frequencies, we will always use 4 or 6 digits, and callout “decimal” for the dot.
118.750
118.1
Radio’s in an plane sometimes have a “squelch” button, which filters aircraft engine sound away. But be aware not to use too much as this will filter any sound away.
Radio failures: put transponder on 7600, so every air trafffic controller knows you are not reachable. By having your transponder on ALT will popup the aircraft on the ATC screens. We also have 3 extra special transponder codes:
7000: Normal VFR flight
7500: Hi-jacked flight
7700: Emergency (7 -> going to h
Squawk code
Meaning
How to remember
7000
VFR
-
7500
Hijacking
Five, man with a knife
7600
Radio miscommunication
Six, radio to fix
7700
Emergency
Seven, going to heaven
Every controlled airport has some radio failure procedures published which must be followed to minimize problems for yourself and other aircraft. In case of your receiver is broken, but we can send messages, we will always use the phrase TRANSMITTING BLIND DUE TO RECEIVER FAILURE -> Add your message.
If receiver doesn’t work, you can test the sender of your plane by pressing the transmit button. If you hear side-tones like a distant beep or buzzer, we can highly assume transmitting messages will still work.
Also to remember: speak in around 100 words per minute and Wait around 10 seconds between every radio call.
25KHz and 8.33 KHz channel separation
Previously we used 25KHz channel separation in aviation. However as more frequencies and radios are coming, the frequencies kept depleting. That’s why we use 8.33 KHz separation today. This makes it possible to use frequencies like 121.000, 121.005, 121.010 instead of 121.000, 121.025, 121.050.
Under the hood, 121.005 is 121.00833 but we refer to them as channels more likely as frequencies but we call them frequencies to make communication more easy.
Module 2: Message categories and Priority
In radio telephony we have multiple different categories of messages which we can hear and transmit to ATC. They are here in order of priority:
Distress calls
Urgency calls
Direction finding
Flight Safety messages
Meterological messages
Flight regularity messages
Some examples of these messages are:
Type of message
Example message
Distress call
Mayday mayday mayday, loss of all flight controls (or engines)
Urgency calls
Panpan Panpan Panpan, Running out of fuel, request to land immediately
Direction finding
Request radio vector/magnetic bearing/heading to airport
Flight Safety
Clearances, regular flight communication
Meterological
Weather-related messages
Flight regularity
Company-origin messages
Distress Message
Distress calls are the most urgent calls possible and mean that direct action is needed. ICAO says about this: A situation with great danger where immediate assistance is needed.
For example, a plane has problems with engine or flight controls and want immediate clearance to land the plane if possible. When putting out a distress call, there is a specific frequency available that all ground stations across the world listen to which is 121.500 MHz. This is the emergency frequency.
A good distress call looks like this:
Mayday (preferrable 3 times)
Specific station or all stations
Callsign of the plane (registration number/flight number)
Cause of the problem
Pilot’s wishes
Position relative to a station, altitude and direction
Other information that helps identifying the problem
Urgency Messages
A urgency call is a type of call which has urgency but no immediate danger like the distress call but still needs priority. This is where the safety of a plane or a single passenger is compromised without direct problems to get a plane on the runway.
A good urgency call looks like this:
Pan Pan (preferrably 3 times)
Specific station or all stations
Callsign of the plane (registration number/flight number)
Cause of the problem
Pilot’s wishes
Position relative to a station, altitude and direction
Other information that helps identifying the problem
Panpan calls can be upgraded to Mayday calls if needed and the other way around, but be aware not to change too often.
Direction Finding messages
These messages are related to determine a direction to an airport. In the past, this sometimes was a problem but these days with Radar, GPS and mobile apps, this mostly don’t happen anymore.
In the past was a method transmitting a signal to a plane physically to reach the VOR antenna was a thing.
Flight Safety Messages
Most common messages are the Flight Safety Messages. These consists of landing/taxi/take-off clearances, ATIS information, plane position report and airport information.
Meteorological Messages
Meteorological messages are messages purely about the weather and forecast. This can be a request to deviate from a certain heading to avoid weather and messages about forecasted turbulence and thermal waves with sunny weather.
Flight regularity messages
Least priority messages, mostly from company to pilot to inform about next flights schedules or maintenance. Some messages are so low priority that they can wait till the plane has landed, so this category has the least priority.
Time in aviation
In aviation, we can be in 3 other countries within an hour, all with their own timezones. In aviation, we have the UTC time, which is the median timezone line that spans over the United Kingdom, Portugal etc. UTC is an abbreviation of Coordinated Universal Time. Why this doesn’t match the 3 letters:
In English, it would have been CUT (Coordinated Universal Time).
In French, it would have been TUC (Temps Universel Coordonné).
To avoid favoring one language over the other, international organizations in the 1960s agreed on the neutral abbreviation UTC. Thanks to France for this :)
We calculate from there with + or - hours. In the Amsterdam timezone, we have UTC +1 in the winter months and UTC +2 in the summer months.
Module 3: Altitude Meter Procedures
The altitude incidator is a unmissable instrument in aviation for both the pilot and ATC. The pilot must know at all times that he will fly at a safe altitude above the ground, terrain buildings or windmills and the ATC will use height-seperation + location to avoid collisions.
To calculate altitude, planes use a altimeter that measures static pressure which works like a barometer and measures air pressure. Because the weather can change from time to time and the air pressure will change with it, we sometimes get a QNH setting from ATC which we must set. Then we have the corrected and calibrated altitude setting.
We have various types of air pressure:
QFE: Pressure on ground level
We will use this only with taxi, take-off and landing as we then must know our height relative to the ground
QNH: Pressure on sea level
We will use this mostly on over-land flights
Flight Level: based on 1013,25 hPa and rounded to 1000 feet
These terms all mean somethin different:
Type of altitude calculation
Relative to
Flight Level
1013,25 hPa
Altitude
Weather station/METAR QNH (current air pressure)
Height
QFH/Ground Level
Module 4: Meteorological Information
All things meteorological has something to do with the weather. The weather can change at any time and can be unpredictable sometimes. This is a risk we have to manage properly in aviation.
METAR
Every airport with a weather station has a weather report, which we call a METAR, every 30 minutes or 60 minutes. This depends on the size of the airport. In this report, the following information is published in this order:
Type of report (METAR/SPECI)
Which airport/city/area
Time of measurement (In UTC)
Visibility in meters (0 - 9999 where 9999 means “more than 10 kilometers”)
Runway Visual Range (RVR) in case of fog, means how much of the runway you will see when on the runway
Current weather
Amount of clouds and weather type
Temperature and dew point
Temperature in RT is always given in Celcius, except being mentioned
Local QNH (sometimes QFE)
METAR version (Sierra/Zulu/Quebec)
Other relevant information
Because the weather can change within an hour, sometimes a SPECI report is published. This is a in-between report that states the differences between the already known report and the changed situation. Types of weather that can cause a SPECI report:
Fast changing wind/speed
Major visibility decrease
Thunderstorms
Snow
Fog
Runway state change, ex. from dry to contaminated
Wind Speed and direction
The speed of the wind and direction is something that is always reported in the METAR. This is reported in this convention:
Wind 240 degrees 15 knots
The degrees is the direction the wind comes from which is always pronounced in 3 digits and rounded to every 10 degrees and the speed in knots. Sometimes, there is a gust added, which means that the speed can at max reach that speed.
Also sometimes in the METAR, there is a variance added: 200V280 means that the wind is mostly coming from 240 degrees, but can be variable from 200 to 280 degrees.
Visibility
The visibility will be calculated by the weather radar and always reports the visibility in meters.
Under 5 kilometers, the visibility is reported for every 100 meter
Example: 4700 meters
Above 5 kilometers, the visibility is reported for every kilometer
Example: 7 kilometers (while it may be actually 6900 meters)
When the visibility is above 10 kilometers, there are no clouds below 5000 feet (1500 meter) and no cumulonimbus, towering cumulus or significant weather is forming we have a weather condition called: CAVOK. This means Ceiling and Visibility OK.
When there is fog that limits our visibility under 1000 meters, then we have “Fog”. Between 1000 and 5000 meters, we call it “Brume”.
Weather types
For Precipitation (neerslag in Dutch), different abbreviations are being used:
Drizzle: DZ
Rain: RA
Snow: SN
Hail: GR
Small hail: GS
For clouds and types, we use these abbreviations/types and we categorize them in “okta”. This means that the sky is seperated into 8 equal size parts, and the more cloud coverage, the more okta’s are filled.
CLR: Clear skies: 0 okta
FEW: Few clouds, almost a complete clear sky 1 or 2 okta
Sometimes, a VER VIS (Vertical Visibility) is given, mostly in conditions with multiple cloud layers.
How to get Weather reports?
Weather reports can be received in various different ways. The most important ways are:
Through ATC ATIS information system
VOLMET
Website on phone or tablet
A weather report is different for every airport with a weather radar. If you have an airport without weather radar, pick some adjecient airports. You can ask the airport itself by requesting it in this way:
C/S request departure information
C/S request arrival information
We also have 3 different meteorological information for certain types of aircraft:
VOLMET: In flight meteorological information
AIRMET: Light plane warnings under flight level 100
SIGMET: Information about unreported significant weather which can cause turbulence, ice or rain
Module 5: Definitions and Abbreviations
In this module, we will look into different definitions and abbreviations that we mostly use in aviation. This will be mostly a list of the definitions and shortcodes and the meaning + the use of them.
Aeronautical Mobile Service: Service between ground stations and planes where emergency services are part of
Aeronautical station: A ground station in the Aeronautical Mobile Service.
Aircraft station: A mobile station in the form of an airplane
Air-ground Communication: Two-way communication between an aircraft and the ground
Air-to-Ground communication: One-way communication from aircraft to ground
Blind transmisson: A transmission done from station one to another without possible two-way communication. The sender assumes the receiver can actually hear this transmission
Broadcast: A broadcast with information for multiple stations which is mostly one-way
Simplex: A method where communication is only possible one-way at a time
Radio Direction Finding: Radio positioning system which uses the receiving radio frequency waves with the goal to determine the current heading (like VOR)
True radio bearing: The angle between the assumed between the incoming radio waves and the true north (360/0 degrees).
Magnetic radio bearing: The angle between the assumed direction of a radio transmission and the magnetic north.
Radio direction finding station: A radio positioning station to determine the direction with radio waves.
FL: Flight Level (based on 1013.25 hPa / 29.92 inHg)
FIR: Flight Information Region
FMC: Frequency Monitoring Code (SSR)
IFR: Instrumt Flight Rules
IMC: Instrument Meteorological Conditions
kHz: Kilo hertz (1000 Hz)
MHz: Mega hertz (1.000.000 Hz)
RMZ: Radio Mandatory Zone
RPAS: Remotely Piloted Aircraft System (drones)
SAR: Search and Rescue
SSR: Secondary Surveillance Radar
TMA: Terminal Control Zone
TMZ: Transponder Mandatory Zone
VDF: VHF Direction Finding station
VFR: Visual Flight Rules
VHF: Very High Frequency
VMC: Visual Meteorological Conditions
Phew, that was all.
Module 6: Last general knowledge before practicing
Before we dive into some general practices, we want to prepare you by stating some guidelines of the lines you are about to learn. You must know these before practicing.
Guidelines for transmitting messages
Put your microphone close to your mouth to be understandable and to filter out the engine noise.
You could ask your co-pilot if you are clearly hearable
Use a normal conversation tone and speak clear
Use a speaking speed of around 100 words per minute. If your message must be written down, speak more slowly
Keep your speaking volume the same for the whole message
A short break after numbers to remind them better
Avoid “eh” or other unwanted sentence breaks. Finish your sentence as soon as possible
Press the transmit button, speak and then end pressing the transmit button
If you have contact with a ground station, you are required to hear the frequency out. The ATC will determine the order of contact to multiple planes (if applicable).
Frequency hand-overs
Sometimes, an ATC will hand-over the plane to a different contact center, and will hand-over you to that ground station. This mostly happens if you cross the country where there are multiple ground station areas.
A pilot will be handed over by ATC with the word “contact”, which is a signal word and will then say the frequency the pilot must connect to. An example is:
PH-JSV, contact Amsterdam Tower on 118 (decimal) 705
This must be read back to ATC and after transmitting the sentence, change the radio to 118.705.
When the pilot itself changes frequency, this has to be transmitted to ATC. An example of this transmit message is:
PH-JSV, approaching Rotterdam CTR, leaving your frequency.
Readback of messages done by ATC
To verify that poth the pilots and ATC are on the same page, we do readbacks in aviation. It works like this:
ATC transmit a certain message to a pilot (radio frequency, heading, action, cleared for landing runway XX)
Pilot hears this and readbacks this complete message (or a summarized version)
Both ATC and pilot could then be corrected if readback is incorrect
Only reacting “roger” isnt enough.
Some general guidelines about readbacks:
Important information must always be readbacked, like frequencies, runways, heading but the readback may be summarized:
ATC: JSV, contact Schiphol Tower on 119.230
Aircraft: 119.230 JSV
Clearance and instructions must always be clearly confirmed
ATC: JSV, cross RWY 22, report vacated
Aircraft: cross runway 22, roger, JSV
Information which must be included if summarized:
Everything about runways
Headings
Altitude and speed
Transition level
Altimeter setting (QNH)
Transponder code (squawk)
QDM/QDR (Magnetic bearings)
Frequencies
Other information must not be readbacked, like wind or other information. Only when it’s important.
A readback must always be ended with your flight-name (registration number, which may be shortened to only the second part or flightnumber on greater airports)
Conditional clearance must be readbacked
If clearance is readbacked incorrectly, ATC will say “negative” and give you the correct version
If pilot cannot succeed the given clearance, “Unable” must be at the start of the sentence and the rest of the message
Use of Transponder
The transponder is a device in a plane which transmits altitude and other flight information to the Radar (SSR). This will allow for ATC to have your plan on the radar, including a 4 digit “squawk” code which is a plane identifier. If flying IFR, ATC will give every plane a unique number, and there are around 4.000 different codes made with 0 till 7.
Special transponder codes are:
7000: VFR (Europe -> 1200 in USA)
7500: Hijack
7600: Radio receival problems
7700: Emergency situations/forced landing
We also have some zones, also in the Netherlands where we are required to do something with transponder and/or radio:
Transponder Mandatory Zone (TMZ): This is a zone where we are required (from 1200 ft in the Netherlands) to have a Transponder enabled
Radio Mandatory Zone (RMZ): This is a zone where we also have to listen to the radio frequency.
A Transponder is often called the Secondary Surveillance Radar (SSR), and is next to the normal, passive radio based Primary radar, an addition for ATC and Flight Information Services to monitor all planes. Primary radar does not work with thunderstorms or particular types of clouds where Secondary Radar does. Using them both is the best combination.
Secondary radar works in the Ultra High Frequency range, at 1030 MHz and 1090 MHz.
We will call all letter and number one-by-one. Let’s say our registration number is PH-JSV and we want to make a Radio call. We actually say:
Papa - Hotel - Juliet - Sierra - Victor
We will do this for any collection of letters and numbers, except for these abbreviations:
Abbreviation
Definition
ACC
Area Control (Center)
ATA
Actual Time of Arrival
ATC
Air Traffic Control
ATD
Actual Time of Departure
CB
Cumulonimbus
EET
Estimated Elapsed Time
ETA
Estimated Time of Arrival
ETD
Estimated Time of Departure
FIR
Flight Information Region
MSL
Mean Sea Level
QDM
Magnetic heading (wind excluded)
QFE
Altimeter pressure on ground (sea level + elevation)
QNH
Altimeter pressure calculation
SSR
Secondary Surveillance Radar (Transponder-radar)
TMA
Terminal control area
UTC
Coordinated Universal Time
VFR
Visual Flight Rules
VHF
Very High Frequency
VMC
Visual Meteorolocigal Conditions
VOR
VHF Omni directional beacon
These are terms we often use, and both A/C and G/S’s will know them. No spelling needed for those.
Now to communicate with other stations or aircraft we use some default phrases. These phrases must always contain one of these words which we could call “signal-words”:
Phrase
Meaning
Practice Example
Acknowledge
Please let me know if message is received and understood
G/S: … Acknowledge you received last transmission
Affirm
Yes
G/S: … Confirm you are at holding point for runway 22 A/C: Affirm
Approved
Your action is approved (no clearance)
A/C: … Request startup G/S: … Startup approved
Break
A separator between multiple unrelated messages for the same receiver
G/S: … Cleared for landing, runway XX BREAK … Report runway vacated A/C: … 2 minutes out of holding point for runway 22
Break Break
A separator between messages for different receivers
A/C: … Cleared for landing, runway XX BREAK BREAK … Behind the landing aircraft, line up and wait behind
Cancel
Cancelling the given clearance
G/S: … Cancel last clearance
Check
Check a system or procedure
G/S: … Check heading A/C: Heading checked
Cleared
You are cleared to do something you need clearance for
G/S: … Cleared for take-off runway 22 A/C: Cleared for take-off, runway 22, …
Confirm
Did I receive the last transmission correctly?
G/S: Confirm you are at holding point runway 22 A/C: Correct
Contact
Switch frequency to…
G/S: … Contact Amsterdam tower on 118.250 A/C: 118.250, …
Correct
That is correct
G/S: Confirm you are at holding point runway 22 A/C: Correct
Correction
An error in the message
A/C: … 2 minutes, eeh, correction, 3 minutes out of overhead Tango
Disregard
Decline this message, never transmitted
A/C: … 2 minutes, eeh, disregard
How do you read
Question for readability level
A/C: … How do you read? G/S: … Readability 4
I say again
Repeat the message if not read back correctly
* after a failed transmission G/S: I say again, taxi and hold short at runway 22
Maintain
Maintain an altitude or heading
G/S: … Maintain altitude 5000 ft and Heading 069 A/C: Maintain altitude 5000 ft, heading 069 …
Monitor
Check a frequency but do not talk (ATIS)
G/S: … Cleared for taxi, monitor ATIS at 121.705 for latest weather A/C: Cleared for taxi, 121.705, …
Negative
No
G/S: Confirm you are at holding point for runway 22? A/C: Negative.
Over
End of my message and I expect reply
A/C: Request for landing, 17 miles south, over …
Out
End of my message and don’t expect reply
A/C: End of flight, out, …
Read back
Repeat the message and therefore confirm you have heard it correctly
G/S: … Cleared for landing, runway 22, read back A/C: Cleared for landing, runway 22, …
Recleared
Change in clearance and cleared for the new procedure
G/S: … Recleared for landing, runway 35 A/C: Recleared for landing, runway 35, …
Report
I want to know cloud ceiling, altitude, heading, traffic in sight
G/S: … Report altitude A/C: Altitude 1500 ft or Flight Level 70
Request
I want to do the following
A/C: … Request startup G/S: … Startup approved
Roger
I have received your message (when no readback is needed)
G/S: … Wind 260 at 12 A/C: Roger …
Say again
Can you repeat the whole message?
A/C: 2 eehh… minutes eeh.. out ehh.. Tango apprkjw%dbcif@$3jbcihc3… G/S: … Say again
Speak slower
Can you speak slower?
A/C: Request startup (fast) G/S: Request to speak slower
Stand-by
Wait, I will come back to you
* engine problems G/S: Request ETA A/C: Stand-by
Unable
I cannot fullfill that request
G/S: Hold short at runway 22 A/C: Unable, traffic on taxiway
Wilco
I will do this in the near future
G/S: … Cleared for landing, runway 22. Stay on the runway after landing A/C: Wilco, after landing …
Words twice
Every word transmitted must be said twice in case of radio jamming
G/S: Readability 1, words twice A/C: Request request startup startup
… = Callsign of the aircraft
Units
Some of the units we don’t shorten but speak fully. This is to reduce confusion about the units and Impertal/Metric system.
Distances: Nautical miles
Short distances: Metres
Altitude/elevation/heights: Feet
Horizontal speeds: Knots
Vertical speed: Feet per minute (FPM)
Wind-direction: Degrees
Altimeter settings: Hectopascal
Temperature: Degrees Celsius
Module 8: Callsigns and general procedures
In aviation, we have different procedures to communicate to other stations. We define “station” as a building, plane or car with one or multiple people, listening actively to a radio frequency. A plane is a station but “Schiphol Ground"also is a station.
We call this communication the “Aeronautical Mobile Service” and contains the communication between a station and a aircraft.
Beause this communication is on a frequency, and we have limited airtime on that, communication is always “simplex”. This means transmitting goes only one-way. You can not talk through a message, just like you can do on your phone. We call this “simplex”. When calling on your phone where two-way traffic is possible, this is called “duplex”. If you know some IT or computer stuff, you might know these terms.
We categorize this into 2 categories:
Air-to-ground (ATG) = simplex (only from aircraft to ground)
Air-ground (AG) = duplex (two-way, both from air to ground and ground to air)
Mind the seperating “to”.
Radio callsign for Ground Stations (G/S)
Every station, if it is a plane or a ground station, has a callsign. Every start of a conversation must start with this phrase.
Location + Suffix
Examples can be:
Schiphol Tower
Teuge Radio
Eelde Delivery
Rotterdam Apporach
We have some default suffixes that are the same for most of the airports:
Service
Purpose
Suffix name
Area control
General/national area controller
Control
Approach control
Approach controller
Approach
Aerodrome control (TWR)
Local area controller
Tower
Radar
Radar area controller
Radar
Surface movement control
Taxi controller
Ground
Clearance delivery
Clearance controller
Delivery
Flight information
Flight information, weather + METAR
Information
Air-ground communication service
Aerodrome information
Radio
Radio callsign for Aircraft (A/C)
For a plane, the callsign would be:
The plane’s brand, type and registration number
Cessna 172, PH-JSV
The international radio-name of the aviation company with the last 4 positions of the registration number
KLM HJSV
The international radio-name of the aviation company with the flight number
KLM 1234
Ryanair 666
A fictional callsign
“Speedbird” for British Airways Concorde
“Air Force One” for the Boeing VC-25A if the president of the USA is aboard
We will shorten the plane’s registration number to the first position and the last 2 positions, but only when approved by ATC. They will inform you of which one to use.
If a plane’s take-off weight is above 136 tons (136.000 kg and 300.000 lbs), then the term Heavy must be added to the callsign. For the Airbus A380, which weights about 500 tons for a full flight, we use the term Heavy. This is because those planes can add a lot of wake-turbulence in the vicinity. Especially for us flying a weak Cessna 172.
Module 9: Making Radio contact
Initial contact
We mean by “Initial contact”, the first communication that we have with one of the Ground Station services. At initial contact, we will communicate to the ground station name followed with our callsign which will mostly be our full registration number:
Teuge Radio, PH-JSV
We will wait for the ground station to respond to our message, as they can answer and process our message. They will respond with a message like:
PH-JSV (PSV), go ahead
We will then transmit a message that clearly states the following:
Part
Practical sayingexample
Who are we?
Cessna 172, PH-JSV, 2 POB (People on board)
Where are we?
In front of restaurant 5 miles north of Amsterdam 2 minutes out of “Sierra”, 1500ft
What are we doing?
1 hour local training flight VFR to Amsterdam VFR to Rotterdam
What do we want?
Request startup Request taxi Request for landing Request departure Request switching off
When complying to a request, like stay on the runway after landing, use the following:
Roger (after landing) for immediate action
Wilco (after landing) for action in the near future (in a few minutes)
We may shorten the request to the first 2 words or the most important words
Readability scale
To communicate how good we are being heard on the other side, we have a readability scale, from 1 to 5. This is a score where higher means better readability:
Score
Description
How to remember
1
Unreadable
2
Readable now and then
Now & Then - 2 words
3
Readable but with difficulty
Diff-i-cult - 3 syllables
4
Readable, but not perfect
5
Perfectly readable
Read means being heard in this case.
When doing a radio check, the ATC will respond with readability 1 to 5 depending on how readable you are. Sometimes, ATC asks if they are also readable to you. You can respond with this scale as well:
Papa hotel juliet sierra victor, readability 5
The best tip in practice is to first prepare your message, maybe write it out on your note-block and read it for yourself. Then transmit the message on the “critical” frequency. Remember, transmitting means airtime on the frequency.
If a station doesn’t know for sure that it was being called, no answer must be given. Carefully wait till a new call is being done. This is to keep the frequency empty from unnessesary communication.
If a station has confirmed that they are the one being called but not by who, first communicate this:
Station calling…, say again call sign
VFR-circuit
In VFR flights, we will fly a pre-determined circuit to land and take-off our aircraft. This is so that all aircraft will fly the same route to the runway. For controlled airports, this is mostly on 1000 ft or 1500 ft MSL. For green airports like Teuge or Texel, this is 700 ft Above Aerodrome Level (AAL). This is Elevation + 700 ft.
Always refer to the published procedures, as this published altitude is the leading factor.
Here is an example of a left-hand circuit. This means the Downwind leg is at the left side of the landing runway. In a right-hand circuit, Downwind is at the right-side.
Back to the communication in a circuit. We have multiple mandatory call-out points:
Downwind
C/S, cross in the middle, downwind, Full stop/touch and go
Final
C/S, on final (inbound to land)
We can announce Base leg on the frequency if there are aircraft on the run-up area or holding short to anounce that we are inbound. This will hopefully make them alerted and waiting till entering the runway.
After making the initial radio contact like above, we must give the information block:
Type of aircraft + persons on board (POB)
Parking place
VFR or IFR
Destination ( + alternate)
Which weather is received
Request type/intention
Callsign (C/S)
Two examples (2 & 9) of initial contact with Delivery which I had to work out for the training:
Example 1
Papa - hotel - bravo - oscar - sierra
Radio check on one- two - one - decimal - niner - eight - zero (121.980 MHz)
Readability
Piper Cherokee, 2 POB
In front of Hangar 5 Lima
VFR to Eelde, Alternate Teuge
Received weather is Bravo
Squawk VFR set, request for taxi
Papa - hotel - bravo - oscar - sierra (papa-oscar-sierra)
QNH xx Runway XX
Example 2
Papa - hotel - tango - whiskey - romeo
Radio check on one-two-one-decimal-eight-three-zero (121.830 MHz)
Readability
Cessna 172, 4 POB
Charlie-apron unable to receive ATIS
VFR to Teuge
Received weather is Whiskey
Squawk VFR set, request for taxi
Papa - hotel - tango - whiskey - romeo (papa-whiskey-romeo)
QNH xx Runway XX
We as aircraft then can respond with this message:
On every controlled airport, we must first request for clearance before starting our engines. We call this the “start-up”. After receiving clearance to start the engines, we can start them and then ask a clearance to taxi to the runway. On some bigger airports, the taxi instructions come from the Tower frequency. On Schiphol Airport, this is on the ground frequency.
A/C: C/S, request taxi
G/S: C/S, roger, contact Eelde Tower on 118.705
A/C: 118.705, C/S
Then we have to switch to the correct frequency, and start-again with the whole block of Initial contact because this is a new frequency and so new ground station. However, it is possible that you get the same department or even the same person, but this is by procedure.
Taxi clearance
When receiving taxi clearance, you will be directed to multiple taxiways, holding points (s) and taxiway exits. A taxi clearance for Eelde Airport can look like this:
C/S, taxi to holding point S1 (Sierra one) runway 23 (two three), via taxiway G (Golf) and taxiway A (alpha)
This relates to the green line on the picture above. At the holding point, we must wait till we get the clearance to cross the yellow line. The clearance must contain “cleared for take-off” or “cleared to cross runway XX”. Otherwise, this line may never be crossed.
After you leave a runway, we transmit “Runway XX vacated”. This means, we have left the runway. We don’t need taxi clearance for leaving a runway but we need one to taxi from taxiway to parking.
Some regularly used abbreviations
Estimated Time of Arrival (ETA)
Endurance
Fuel in hours (and minutes)
Alternate
Alternate airport in case of bad weather or other discontinuities
Rate of climb (ft/min)
Climb speed
Rate of descent (ft/min)
Descent speed
Reduce (speed/rate of descent/rate of climb)
Expedite
Speed up
Heading (without wind correction) QDM
Track (with wind correction)
Immediately
Do this now
Orbit
Make a circle above a certain point over left or right
360 turn
Hold over/Overhead
Wait at a certain point till further instructions
Omit
Exclude something like position report
Names of taxiways
All ways on an airport has names to make clear what turns to take and what ways to follow. This makes both the pilots and G/Ss clear how a plane must taxi from and to the runway.
All taxiways will be indicated next to the runway. The letters are always spelled completely like the ICAO alphabet:
Yellow signs means intersections, black signs mean current ways.
Some extra ATC and F-Plan abbreviations
These are some extra ATC and Flight Plan preparation abbreviations and their definitions:
Abbreviation
Definition
A/C
Aircraft
ALT
Altitude
C/S
Call sign
EET
Estimated Elapsed Time
END
Endurance
POB
People on Board
FOB
Fuel on Board
A/B
Airborne (on time X)
L/T
Landing (on time X)
TCK
Track (heading)
IAS
Indicated Airspeed
TAS
True airspeed (IAS + Wind)
Then some extra generic abbreviations which ATC will use from time to time:
Abbreviation
Definition
U/S
Unservicable
CTR
Control Zone
GND
Ground (station)
TWR
Tower
TFC
Traffic
TMA
Terminal Maneuvering Area
UFN
Until further notice
WIP
Work in progress
Module 10: VFR outbound flights
Because most flights in single engine planes are done using the Visual Flight Rules (VFR), we have some basic rules which must be followed. We are clearly different traffic than IFR flights, which will mostly be the big commercial planes like Boeings or Airbusses.
VFR flights will be seperated from those IFR flights on dutch airports. On Schiphol, there is one runway available for VFR flights, which is 04/22. The flight paths for VFR are mostly on the edge of the airport’s control zone (CTR) to have physical seperation. For big airports like Schiphol, a “slot” must be reserverd due to the high traffic amount per hour. This is because on average, a plane lands and takes off every minute.
For VFR outbound/departing flights, we have the following guidelines:
A flight-plan must be submitted to the local area controller and clearance must be received from the controller
Within controlled airspace, two-way radio communication and active monitoring is required
All flights from and to airports and aerodromes must follow the VFR routes and published procedures
Routes and altitude may only be deviated with permission or from ATC’s order
In Dutch CTR’s like Schiphol, Beek, Eelde, Rotterdam and Eindhoven are IFR areas. These are marked on the VFR procedure map of the airport
VFR traffic on controlled airports must always get a clearance to startup the engines. This is called the start-up clearance
Departing routes
When departing in VFR, we have multiple routes which can be followed. These are published by the airport itself. For Schiphol, we always use the Victor-departure (V-departure). This is called the Victor departure because the route leads to a town “Vinkeveen”.
The route of schiphol has the following requirements:
Maximum altitude of 1000ft MSL (maximum, so 500ft e.g. is allowed)
After departing, the edge of the CTR must be reached within 4NM distance from the airport
Checkpoint Bravo is a mandatory call-out location
After leaving the CTR above checkpoint Victor, this must be called to ATC
VFR 7000 and mode on ALT
Uncontrolled airfields
On uncontrolled airfields we mostly have a specific frequency available for all planes to communicate. This will mostly the Radio Suffix, which has no ATC permissions. Also we announce to the Radio/aerodrome monitoring what we are doing and they will give us the required information. This information consists of:
Wind direction and strength
Threats in the vicinity or mind gliders/para’s
Other aviation activities in the area
Taxi procedures
In VFR outbound flights we will communicate in this way to the Radio frequency:
First doing a testing communication
A/C: XXX Radio, Callsign
G/S: Callsign, go ahead
Directly after the communication test, At the apron, ready for taxiing
A/C: Callsign, X POB, Pilot in command is XX, Parked at XX, 1 hour local training flight, Request aerodrome information for take-off
G/S: Callsign, In use, runway XX, Lefthand circuit, mind para’s
A/C: Runway XX, roger the para’s, Callsign
At the holding short point for a runway, ready for departure
A/C: Callsign, lining up runway XX
G/S: Callsign, lining up
At 700 ft, and leaving the circuit area
A/C: Callsign, leaving the circuit area
G/S: Callsign, leaving (have a great flight)
Module 11: VFR Inbound flights
Now that we have processed everything we need to know about outbound flights, let’s take a look into VFR inbound flights.
Before diving into every aspect of an inbound flights, let’s take a look at the rules that apply:
Long before inbound on the local ATC area, radio contact must be made with the ground station of the area controller
It is possible to receive a short version of the approach procedure, like a midrunway-baseleg instead of a threshold-baseleg. In the Netherlands, this is only possible on Runways 04 and 22 of Schiphol. Especially for a Cessna 172, this runway is more than long enough to land on. (2014 meter)
Uncontrolled airfields
On uncontrolled airfields we mostly have a specific frequency available for all planes to communicate. This will mostly the Radio suffix. Also we announce to the Radio/aerodrome monitoring what we are doing and they will give us the required information. This information consists of:
Wind direction and strength
Threats in the vicinity or mind gliders/para’s
Other aviation activities in the area
Taxi procedures
In VFR inbound flights we will communicate in this way to the Radio frequency:
In the area but around 5 minutes to landing
A/C: XXX Radio, Callsign
G/S: Callsign, go ahead (or direct information)
A/C: Callsign, back on your frequency, approaching *point from the *direction, 2 minutes inbound, request aerodrome information for landing
G/S: Callsign, in use runway XX, Righthand circuit (sometimes mind para’s or gliders)
A/C: Runway 08, roger para’s, callsign
Overhead calling point
A/C: XXX Radio, Callsign, overhead *calling point
G/S: Sometimes you will get no response, or a short response like “Roger” or overhead
Joining Downwind leg
A/C: Callsign, Mid downwind for XX, full stop (or touch and go)
G/S: Sometimes you will get no response, or a short response like “Roger” or a complete readback
Turning Base-leg (optional)
(not required to call out, but for attention if traffic ready for take-off)
A/C: XXX Radio, Callsign, turning base-leg
G/S: Sometimes you will get no response, or a short response like “Roger”
Turning final-leg
A/C: XXX Radio, Callsign, turning final, full stop (or touch and go)
G/S: Sometimes you will get no response, or a short response like “Roger”
Runway vacated
A/C: XXX Radio, Callsign, runway vacated
G/S: Sometimes you will get no response, or a short response like “Roger”
Module 12: Amsterdam Information and Dutch Mil Info
In this module we will dive deeper into the greatest Flight Information Centers of the Netherlands:
Amsterdam Information: Mostly Amsterdam and Rotterdam and North sea
Dutch Mil Info: The east part of the Netherlands
These frequencies are Flight Information Centers (FIC), and do provide information which can be really important for your flight. They don’t do flight seperation but can warn you for potential other traffic or emergency situations.
However, contacting and listening these frequencies is not mandatory, but highly recommended
The FIC can provide extra information when contacting them, like:
Regional QNH: Every aircraft in the FIC area get’s the same QNH for the whole area to be on the same relative altitude
Reporting other traffic, military practice operations or special events
Asking information like no-fly zones or CTR crossing clearance for military fields
Contacting Dutch Mil Info
We can join the Dutch Mill channel by dialing in the frequency 132.350 MHz.
A/C: Dutch Mil Info, Callsign
G/S: Callsign, go ahead
Now we have to report what we are doing exactly, who we are, where we headed etcetera:
A/C: Callsign, Cessna 172, X POB, VFR training flight (or dep/arr), our location, requesr Flight Information Service (Flight Info)
G/S: Callsign, QNH 1009 (and potentially some other information)
As we got a QNH which is mandatory to readback, we will do this:
A/C: QNH 1009, Callsign
Leaving Dutch Mil Info
We can now leave this frequency as we want to land on an airfield, or we don’t need the FIC anymore. They like you if you sign off like expected.
A/C: Callsign, location, approaching aerodrome, request frequency change to XXX
G/S: Callsign, frequency change approved (have a nice day)
Then we will respond:
A/C: Frequency change approved, Callsign (and we can add Goodbye or nice day if we are nice).
Module 13: Crossing CTR’s and Radio Direction Finding
In a country, we have multiple control zones (CTR). These are controlled zones of airports which controls the area around the airport such as traffic separation.
This is an example of a CTR. The circle is a circle of 5 nautical meters (9,2km). In the circle, we have two rectangle which are the departure and arrival blocks.
When we have to cross a CTR, a clearance of the ATC is needed. This means we have to ask for clearance around 2 minutes prior to crossing. This can look like this:
A/C: Cessna 172, X POB, VFR Texel to Eelde, 5 miles west of your CTR, request cross zone, cross straight from Franeker to Burgum, overhead the field at 2000ft, PSV
G/S: PSV, roger, cleared to cross Leeuwarden CTR at 1500ft, QNH 1017, straight from Franeker to Burgum, overhead the field
Now we got the clearance, we will read this back:
A/C: cleared to cross Leeuwarden CTR at 1500ft, QNH 1017, Franeker to Burgum, PSV
Then we have to announce the entering and exiting the CTR:
A/C: PSV, over Burgum, leaving CTR at 1500ft
G/S: PSV, roger, frequency change approved (goodday)
A/C: Frequency change approved, PSV, nice day
The route can be different, it can be a straight line or a angle. Mostly, the tower will direct you overhead because this is the safest route in terms of departing or arriving traffic. Also, they will assign you a specific altitude.
Radio Direction finding
This part can sound a little fun in terms of Transponders, GPS, the Mobile period and Skydemon. But in previous years when a VFR pilot is lost, they could request a radio direction finding from ATC. They will do a test from which direction the radio signal of the plane is coming. Then they could give the plane a heading with a specific class:
Class A accurate within ± 2°
Class B accurate within ± 5°
Class C accurate within ± l0°
Class D accurate less than 10° (useless, as this can be up to 180°)
This might sound rediculous but was the normal way of doing in the 80s and 90s. These days, this will never happen in developed countries but we need to know this as some parts of the world doesnt have GPS/internet/mobile phones.
We can request this by:
A/C: QDM QDM, Rotterdam Tower PH-JSV, request QDM PH-JSV (We have to mention QDM and our callsign twice)
G/S: PH-JSV, Rotterdam Tower, QDM 050 Class B
A/C: QDM 050 Class B PH-JSV
This way we will know that we are ar a heading of 50 degrees of Rotterdam, which will be somewhere north-east. As the radio range can be up to 300 km, this is a tip but not a very obvious one.
And sometimes, we will be asked to count till 10 so we transmit, and the ground station can receive that signal to perform the QDM finding.
Special clearances
Sometimes, we will get a special clearance. This can be to give way to a security car on the taxi way or other traffic or a request for the braking action on the runway.
If we are requested to get a clearance but with an limitation, like line up behind a landing plane, we will have to repeat this limitation twice:
G/S: PSV, behind the landing Cessna 172, cleared for take-off, behind
A/C: Behind the landing Cessna 172, behind, cleared for take-off
What also can happen, is that we get a special instruction to our take-off clearance. This could be to follow the runway heading (runway 24 is 240 degrees, or West-South-West/WSW).
G/S: PSV, runway 24, cleared for take-off, runway heading, until 1000ft, then left turn out
A/C: Cleared for take-off, runway 24, runway heading, 1000ft, then left out, PSV
We also could get a request to stop our take-off/about:
G/S: PSV, hold position, cancel, I say again, cancel take-off
A/C: Stopping, PSV (or repeat cancelling take-off)
Its possible to receive a clearance without flying the circuit (like at the beginning or end of the day to speed things up). We call this a “straight-in” approach.
In VFR flights, it could be possible that radar assistance is needed. This due to incoming overcast or bas visibility. The radar communication works with heading and degrees (absolute) or the clock system (relative) to point out other traffic to and ATC will use radar to identify your plane.
It can also be that we are separated by ATC:
G/S: PSV, turn left heading 050 for separation
A/C: left heading 050, PSV
We will first be asked what our magnetic heading is, because this defers from the true north. This is the heading what the middle compas shows:
Other important notes (to be categorized in the modules)
If heading for a required call-out point, like “Tango” or “Sierra”, we must call-out this around 2 minutes before reaching
The first time reaching out to ATC, the ATIS weather letter must be mentioned
If almost on the runway without landing clearance, stay at 0,5 meters altitude above the runway and else a go-around is required
The call-out of other aircraft making a full-stop or touch and go is no insurance they actually do
A Long landing is a landing on around the second half of the runway
A intersection take-off is a take-off on the second half of the runway
VFR doesn’t use the IFR waypoints around the world, but we can use them as reference point to ATC
Holding short Sierra 1 for runway 23, Papa Bravo Papa
Eelde Tower, Papa Bravo Papa, request departure
Behind the landing Boeing 747, line up and wait, behind
Cleared for take-off, runway 23, Papa Bravo Papa
Eelde Tower, Papa Bravo Papa, overhead Tango
Wilco report Victor, Papa Bravo Papa
Eelde Tower, Papa Bravo Papa, overhead Victor
Eelde Tower, request leaving your frequency for Dutch Mil
Frequency change approved, goodday, Papa Bravo Papa
Dutch Mil info, Papa Hotel Sierra Bravo Papa
Dutch Mil info, Papa Bravo Papa, overhead Assen, 1200 feet, VFR to Rotterdam, request flight information services
QNH 1023, Papa Bravo Papa
Traffic in sight, Papa Bravo Papa
Divert to heading 270 to avoid traffic, Papa Bravo Papa
Dutch Mil Info, Papa Bravo Papa, requesting flight plan change to Schiphol due to bad visibility
Frequency change approved, thank you, Papa Bravo Papa
Schiphol Tower, Papa Hotel Sierra Bravo Papa
Schiphol Tower, Papa Bravo Papa, Piper Seneca, 2POB, changed destination to Schiphol due to bad visibility, original destination Rotterdam, request for landing, full stop
Cleared to enter CTR, QNH 1002, Wilco Victor, Papa Bravo Papa
Schiphol Tower, Papa Bravo Papa, overhead Victor, 1000ft
Wilco report downwind, Papa Bravo Papa
Schiphol Tower, Papa Bravo Papa, joining downwind, 1000ft
Cleared to land runway 22, copied the wind, Papa Bravo Papa
Schiphol Tower, Papa Bravo Papa, runway 22 vacated via Golf 5
121.805, Papa Bravo Papa
Schiphol Ground, Papa Hotel, Sierra Bravo Papa, request taxi to parking
Taxi to Kilo apron via G5, taxiway Golf Kilo apron
Schiphol Ground, Papa Bravo Papa request switching off
Switching off, thank you, Papa Bravo Papa
Assignment 2 and 3 done on MSFS
Assignment 4
Spelling is correct
Beek Delivery, Papa Hotel Whiskey Alpha Alpha
Beek Delivery, Papa Hotel Whiskey Alpha Alpha, type is Cessna 172, 2 POB, VFR Beek to Schiphol, Request startup
Startup approved, Papa Alpha Alpha (or Startup at 25, Papa Alpha Alpha)
Beek Delivery, Papa Alpha Alpha, ready to taxi
119.480, Papa Alpha Alpha
Beek Tower, Papa Hotel, Whiskey Alpha Alpha
Beek Tower, Papa Alpha Alpha, ready to taxi
Taxi to and hold short Whiskey 4 for runway 03, Papa Alpha Alpha
Beek Tower, Papa Alpha Alpha, holding short Whiskey 4, ready for departure
Cleared for take-off runway 03, maintaining runway heading till 1300ft, wilco 1300ft
Beek Tower, Papa Alpha Alpha, maintaining 1300ft
Wilco Golf, Papa Alpha Alpha
Beek Tower, Papa Alpha Alpha, overhead Golf, 1300ft
Wilco Bravo, Papa Alpha Alpha
Beek Tower, overhead Bravo and leaving the CTR
Frequency change approved, Papa Alpha Alpha
Dutch Mil Info, Papa Hotel, Whiskey Alpha Alpha
Dutch Mil Info, Papa Alpha Alpha, request flight information services
Sqauwking 7005, QNH 1032, Papa Alpha Alpha
Dutch Mil Info, Papa Alpha Alpha, request to leave your frequency for Eindhoven Tower
Frequency Change Approved, Papa Alpha Alpha
Eindhoven Tower, Papa Hotel Whiskey Alpha Alpha
Eindhoven Tower, Papa Alpha Alpha, request crossing your CTR at 2500ft from Zulu to Tango
Crossing approved, maintaining 2800ft, Papa Alpha Alpha
Eindhoven Tower, Papa Alpha Alpha, Overhead Tango, leaving your CTR
Frequency change approved, Papa Alpha Alpha
Dutch Mil Info, Papa Alpha Alpha, request flight information services
Sqauwking 7005, QNH 1032, Papa Alpha Alpha
Dutch Mil Info, Papa Alpha Alpha, request to leave your frequency for Schiphol Tower
Frequency change approved, Papa Alpha Alpha
Schiphol Tower, Papa Hotel Whiskey Alpha Alpha
Schiphol Tower, Papa Alpha Alpha, overhead Maarssen, 3000ft, request for landing runway 22
Descending to 1500ft, wilco Victor, Papa Alpha Alpha
Schiphol Tower, Papa Alpha Alpha, overhead Victor
Wilco Sierra (geen idee), Papa Alpha Alpha
Schiphol Tower, Papa Alpha Alpha turning downwind for runway 22, full stop
Cleared to land runway 22, Papa Alpha Alpha
Schiphol Tower, Papa Alpha Alpha, runway vacated via Golf 5
121.805, Papa Alpha Alpha
Schiphol Ground, Papa Hotel Whiskey Alpha Alpha
Schiphol Ground, Papa Alpha Alpha, request taxi to Kilo apron
Taxi to Kilo apron via Golf 5, taxiway Golf, taxiway Kilo, Papa Alpha
Giving way to the Cessna Citation X, Papa Alpha Alpha
Schiphol Ground, Papa Alpha Alpha, request switching off
Switching off, goodday, Papa Alpha Alpha
Assignment 7
Spelling is correct
De Kooy Ground, Papa Hotel Sierra Bravo Alpha
De Kooy Ground, Papa Bravo Alpha, type is Piper Cherokee, 2 POB, VFR to Rotterdam, Request startup
Startup approved, Papa Bravo Alpha
De Kooy Ground, Papa Bravo Alpha, Ready to Taxi
120.130, Papa Bravo Alpha
De Kooy Tower, Papa Hotel Sierra Bravo Alpha, ready to taxi
Taxi to and hold short runway 03, Papa Bravo Alpha
De Kooy Tower, Papa Bravo Alpha, holding short runway 21, ready for departure
Cleared for take-off runway 03, squawk 7020, Papa Bravo Alpha
De Kooy Tower, Papa Bravo Alpha, leaving your CTR
Frequency change approved, Papa Bravo Alpha
Schiphol Tower, Papa Hotel Sierra Bravo Alpha
Schiphol Tower, Papa Bravo Alpha, request for landing, touch and go
Wilco Victor, Papa Bravo Alpha
Schiphol Tower, Papa Bravo Alpha, overhead Victor
Wilco Bravo, Papa Bravo Alpha
Schiphol Tower, Papa Bravo Alpha, Overhead Bravo, 1000ft
Wilco downwind, Papa Bravo Alpha
Schiphol Tower, Papa Bravo Alpha, turning downwind for runway 22, 500ft
Cleared to land, runway 22, Papa Bravo Alpha
Schiphol tower, Papa Bravo Alpha, going around and leaving the CTR at Hoofddorp, 1000ft
Proceed to Hoofddorp and leave, Papa Bravo Alpha
Schiphol Tower, Papa Bravo Alpha, leaving the CTR
Frequency change approved, Papa Bravo Alpha
Rotterdam Tower, Papa Hotel Sierra Bravo Alpha
Rotterdam Tower, Papa Bravo Alpha, request entering your CTR at 1500ft, inbound in 3 minutes
Wilco entering, Papa Bravo Alpha
Rotterdam Tower, Papa Bravo Alpha, entering your CTR, 1500ft
Rotterdam Tower, Papa Bravo Alpha, request for landing via Hotel arrival, 1500ft
Wilco Hotel, Papa Bravo Alpha
Rotterdam Tower, Papa Bravo Alpha, overhead Hotel
Wilco Whiskey, Papa Bravo Alpha
Rotterdam Tower, Papa Bravo Alpha, overhead Whiskey, 1500ft
Holding at (ombekend punt), Papa Bravo Alpha
Cleared for landing, runway 06, Papa Bravo Alpha
Rotterdam Tower, Papa Bravo Alpha
End of the page 🎉
You have reached the end of the page. You can navigate through other blog posts as well, share this post on X, LinkedIn and Reddit or return to the blog posts collection page. Thank you for visiting this post.
This category contains my briefings for informing pilots and passengers during flights.
Taxi briefing
This page contains an outline of an VFR taxi briefing for an general aviation aircraft.
1. ANWB
Aircraft
During the pre-flight inspection, we have searched for possible reasons to not fly. We could have seen things we don’t like and we don’t want to take risks with, so our taxi briefing actually starts here.
NOTAMs
We review again the possible NOTAMs that apply for our flight, and how they can affect our flight.
Weather
We will again take a look at the weather for a proper risk assessment. The weather can change very fast sometimes, so we review at this point of the weather is still within our aircraft and personal limits.
Briefing (what we will do)
In the briefing part, we will brief our co-pilot and passengers on what to do to all be on the same page and to minimize questions in more critical phases of the flight.
2. Taxi-ing
We will start taxi-ing by testing the brakes of the aircraft at both sides. Then we will make a turn onto the taxiway where we will do our taxi checks. Here we check if every primary flight instrument works as expected.
We will also note all emergency equipment we must have on board.
In short:
Brake tests
Route to run-up area/hold short
Taxi checks
3. Passenger briefing (only with passengers)
We must also brief passengers on various features and things:
Seats and Belts
Silence
Sterile cockpit meaning
Radio first
Sickness
Call out
Waste bags
Smoking
Never allowed within 100 meters of an aircraft
Emergency
Brace
Exit aircraft to the tail because of the propellor
4. Taxi checks
On the taxiway, we will perform some taxi-checks, checking our primary instruments which must work without airspeed.
4.1 Left turn
When we perform a left turn, we check and call-out the following
Symbol left
Ball right
Compasses decrease
Attitude Direction Indicator stable
4.2 Right turn
When we perform a right turn, we check and call-out the following
Symbol right
Ball left
Compasses increase
Attitude Direction Indicator stable
The checks summarized
We checked all instruments who are not dependent of airspeed, as these are very critical in flights. These belong to the basic 6 of aviation.
Turn coordinator angle
Turn coordinator ball
Directional gyro compass
Magnetic compass
Attitude Direction Indicator
That were all taxi checks and briefings.
End of the page 🎉
You have reached the end of the page. You can navigate through other blog posts as well, share this post on X, LinkedIn and Reddit or return to the blog posts collection page. Thank you for visiting this post.
This page contains an outline of an VFR take-off briefing for an general aviation aircraft.
We do the take-off briefing as part of the Before take-off checklist. We brief our co-pilot and passengers to be both at the same page. This as the take-off is a very critical part of a flight.
I will outline every subject and describe what must be briefed.
1. Route
We will park the plane in a 45 degree angle to view the Base and Final legs.
We then start the take-off roll with these speeds:
Rotate at 55 knots
Climb to 200ft with 65 knots (flaps 10)
Climb to 700/1000ft with 75 knots (flaps up)
2. Non-flyable failure
When a non flyable failure occurs, we will do one of these steps:
Stop at or before rotation (or 55 knots)
After rotation, we land the aircraft on the same runway when having enough runway (33 meter per second average)
After rotation, with not enough runway we perform a Emergency landing in a 30 degree angle, preferably into the wind
3. Flyable failure
When a flyable failure occurs, we will complete a circuit and we will safely land the aircraft.
4. Threat and Error Management
We also assess possible risks and threats after the briefings. These are events at the airport which can make our take-off harder than in perfect conditions. Examples of these risks are:
Wind (crosswind, gusts, tailwind)
Fast developing weather
Birds
Traffic
Low sun
Parachutes
Glider planes
Helicopters producing wake-turbulence
In cases of parachutes/gliders we will go around at the opposing side of the runway.
5. Runway memory items
When lining up, we need to perform the runway memory items:
Carb heat: OFF
Transponder: Alt
Landing lights: On
Pitot heat under 10 degrees
Compass runway heading
6. Ground roll
During ground roll we need to call out some points to ensure a positive climb:
Airspeed alive at 40 or more knots
Engine RPM stable and at a value of 2500RPM (take-off/climb RPM)
Rotate
7. After take-off memory items
Shortly after take-off (around 200ft), we will do the after take-off memory items
Flaps up
Carb heat: OFF
Landing light: Off
Engine Instruments: Green
End of the page 🎉
You have reached the end of the page. You can navigate through other blog posts as well, share this post on X, LinkedIn and Reddit or return to the blog posts collection page. Thank you for visiting this post.
This category contains my flying journey crossing the USA on Microsoft Flight Simulator 2024.
I thought of a new idea, crossing the whole USA in several legs in a GA aircraft. Normally I fly the Cessna 172 but this will be a never ending story if I choose that plane to cross the USA. I picked a plane with double the cruising speed, the Cessna 208 Grand Caravan. As I like playing Microsoft Flight Simulator but already completed the career mode, I wanted to fly for a new goal.
YouTube Playlist
At the moment of writing, I’m still busy flying the legs, and uploading them to the YouTube playlist below when finished.
Kluane Lake, St. Elias Mountains, Whitehorse, Inside Passage, Misty Fjords, Fraser Valley
Pacific Northwest / California Coast
Seattle, Puget Sound, Oregon Coast, Oregon Dunes, Redwoods, Mendocino, Sonoma, San Francisco
Sierra / Desert Southwest
Yosemite, Mammoth Lakes, Eastern Sierra, Death Valley, Los Angeles, Las Vegas, Hoover Dam/Lake Mead
Canyon country
Grand Canyon, Lake Powell, Horseshoe Bend, Monument Valley, Four Corners, Arches, Canyonlands, Moab
Rockies / High Plains
Telluride, Gunnison, Aspen, Vail, Denver Front Range, Cheyenne, Nebraska Sandhills, Black Hills, Mount Rushmore, Badlands
Texas
Palo Duro Canyon, Lubbock/Caprock, Dallas, Waco, Austin, San Antonio, Hill Country, Houston/NASA
Gulf / Florida
Galveston, Louisiana wetlands, Baton Rouge, New Orleans, Gulf beaches, Mobile Bay, Pensacola, Panama City Beach, Forgotten Coast, Orlando, Palm Beach, Miami
Route
The route itself with all the airfields and estimated flight times with these parameters:
Plane: Cessna 208 Grand Caravan
Flying speed: ~ 160 knots
Altitude: ~ 2500ft AGL (above ground)
Leg
From
To
Departure field
Arrival field
Estimated flight time
Distance (NM)
Distance (km)
1
PANC
PATK
Anchorage
Talkeetna
00:26
68.9
127.6
2
PATK
PAIN
Talkeetna
McKinley National Park
00:34
90.7
168.0
3
PAIN
PAFA
McKinley National Park
Fairbanks
00:26
70.6
130.8
4
PAFA
PABI
Fairbanks
Allen AAF / Big Delta
00:28
74.1
137.2
5
PABI
PFTO
Allen AAF / Big Delta
Tok Junction
00:31
83.8
155.2
6
PFTO
PAOR
Tok Junction
Northway
00:13
35.5
65.7
7
PAOR
CYXQ
Northway
Beaver Creek
00:17
44.2
81.9
8
CYXQ
CYDB
Beaver Creek
Burwash
00:30
81.0
150.0
9
CYDB
CYHT
Burwash
Haines Junction
00:21
55.7
103.2
10
CYHT
CYXY
Haines Junction
Whitehorse
00:27
72.9
135.0
11
CYXY
PAGS
Whitehorse
Skagway
00:28
75.4
139.6
12
PAGS
PAJN
Skagway
Juneau
00:26
70.2
130.0
13
PAJN
PAPG
Juneau
Petersburg
00:40
107.0
198.2
14
PAPG
PAKT
Petersburg
Ketchikan
00:36
96.1
178.0
15
PAKT
CYPR
Ketchikan
Prince Rupert
00:29
77.8
144.1
16
CYPR
CYXT
Prince Rupert
Terrace
00:25
66.3
122.8
17
CYXT
CYYD
Terrace
Smithers
00:20
52.9
98.0
18
CYYD
CYPZ
Smithers
Burns Lake
00:19
50.6
93.7
19
CYPZ
CYXS
Burns Lake
Prince George
00:44
118.8
220.0
20
CYXS
CYWL
Prince George
Williams Lake
00:39
104.9
194.3
21
CYWL
CYKA
Williams Lake
Kamloops
00:40
107.4
198.9
22
CYKA
CYCW
Kamloops
Chilliwack
00:41
109.5
202.8
23
CYCW
CYXX
Chilliwack
Abbotsford
00:07
18.3
33.9
24
CYXX
CYYJ
Abbotsford
Victoria
00:18
47.8
88.5
25
CYYJ
KBFI
Victoria
Seattle Boeing Field
00:30
80.8
149.6
26
KBFI
KAST
Seattle Boeing Field
Astoria
00:39
104.8
194.1
27
KAST
KONP
Astoria
Newport Municipal
00:36
95.0
175.9
28
KONP
KOTH
Newport Municipal
North Bend/Coos Bay
00:26
70.3
130.2
29
KOTH
KCEC
North Bend/Coos Bay
Crescent City
00:37
98.3
182.1
30
KCEC
KACV
Crescent City
Arcata/Eureka
00:18
48.5
89.8
31
KACV
KFOT
Arcata/Eureka
Rohnerville/Fortuna
00:10
25.5
47.2
32
KFOT
KLLR
Rohnerville/Fortuna
Little River
00:30
79.5
147.2
33
KLLR
KSTS
Little River
Charles M. Schulz Sonoma County
00:24
63.1
116.9
34
KSTS
KHAF
Charles M. Schulz Sonoma County
Half Moon Bay
00:23
61.6
114.1
35
KHAF
KMPI
Half Moon Bay
Mariposa-Yosemite
00:44
117.2
217.1
36
KMPI
KMMH
Mariposa-Yosemite
Mammoth Yosemite
00:22
57.6
106.7
37
KMMH
O26
Mammoth Yosemite
Lone Pine
00:27
72.7
134.6
38
O26
KBFL
Lone Pine
Bakersfield
00:32
84.8
157.0
39
KBFL
KWJF
Bakersfield
Lancaster / Gen. Fox
00:22
58.5
108.3
40
KWJF
KVNY
Lancaster / Gen. Fox
Van Nuys
00:13
34.6
64.1
41
KVNY
KIYK
Van Nuys
Inyokern
00:35
92.9
172.1
42
KIYK
L06
Inyokern
Furnace Creek
00:28
73.8
136.7
43
L06
KHND
Furnace Creek
Henderson Exec.
00:26
69.3
128.3
44
KHND
1G4
Henderson Exec.
Grand Canyon West
00:24
64.0
118.5
45
1G4
KGCN
Grand Canyon West
Grand Canyon Natl Park
00:30
81.2
150.4
46
KGCN
KPGA
Grand Canyon Natl Park
Page Municipal
00:25
67.5
125.0
47
KPGA
UT25
Page Municipal
Monument Valley
00:22
60.1
111.3
48
UT25
KBDG
Monument Valley
Blanding Municipal
00:18
48.3
89.5
49
KBDG
KCNY
Blanding Municipal
Canyonlands Regional
00:27
71.5
132.4
50
KCNY
KTEX
Canyonlands Regional
Telluride Regional
00:37
99.3
183.9
51
KTEX
KGUC
Telluride Regional
Gunnison-Crested Butte
00:22
57.7
106.9
52
KGUC
KASE
Gunnison-Crested Butte
Aspen-Pitkin County
00:16
41.5
76.9
53
KASE
KEGE
Aspen-Pitkin County
Eagle County
00:10
25.3
46.9
54
KEGE
KAPA
Eagle County
Centennial
00:36
95.8
177.4
55
KAPA
KCYS
Centennial
Cheyenne
00:36
95.2
176.3
56
KCYS
KAIA
Cheyenne
Alliance Municipal
00:39
105.0
194.5
57
KAIA
KCUT
Alliance Municipal
Custer County
00:40
107.0
198.2
58
KCUT
KRAP
Custer County
Rapid City Regional
00:12
30.6
56.7
59
KRAP
KCDR
Rapid City Regional
Chadron Municipal
00:27
72.5
134.3
60
KCDR
KSNY
Chadron Municipal
Sidney Municipal
00:39
104.4
193.3
61
KSNY
KAKO
Sidney Municipal
Colorado Plains Regional
00:21
56.6
104.8
62
KAKO
KLIC
Colorado Plains Regional
Limon Municipal
00:22
57.8
107.0
63
KLIC
KLAA
Limon Municipal
Lamar Municipal
00:32
85.7
158.7
64
KLAA
KGUY
Lamar Municipal
Guymon Municipal
00:38
100.4
185.9
65
KGUY
KAMA
Guymon Municipal
Amarillo
00:33
88.5
163.9
66
KAMA
KPVW
Amarillo
Plainview/Hale County
00:24
63.1
116.9
67
KPVW
KLBB
Plainview/Hale County
Lubbock
00:12
30.7
56.9
68
KLBB
KSWW
Lubbock
Sweetwater / Avenger Field
00:37
99.1
183.5
69
KSWW
KABI
Sweetwater / Avenger Field
Abilene Regional
00:15
39.9
73.9
70
KABI
KMWL
Abilene Regional
Mineral Wells
00:32
85.0
157.4
71
KMWL
KADS
Mineral Wells
Addison
00:24
62.7
116.1
72
KADS
KACT
Addison
Waco Regional
00:32
83.9
155.4
73
KACT
KEDC
Waco Regional
Austin Executive
00:28
74.9
138.7
74
KEDC
KSAT
Austin Executive
San Antonio
00:26
70.0
129.6
75
KSAT
KBAZ
San Antonio
New Braunfels
00:09
24.6
45.6
76
KBAZ
KARM
New Braunfels
Wharton Regional
00:38
102.3
189.5
77
KARM
KEFD
Wharton Regional
Houston Ellington
00:21
56.2
104.1
78
KEFD
KGLS
Houston Ellington
Galveston
00:10
25.8
47.8
79
KGLS
KLCH
Galveston
Lake Charles
00:37
99.8
184.8
80
KLCH
KBTR
Lake Charles
Baton Rouge
00:41
110.2
204.1
81
KBTR
KNEW
Baton Rouge
New Orleans Lakefront
00:24
65.2
120.8
82
KNEW
KGPT
New Orleans Lakefront
Gulfport-Biloxi
00:20
54.3
100.6
83
KGPT
KMOB
Gulfport-Biloxi
Mobile Regional
00:17
46.0
85.2
84
KMOB
KPNS
Mobile Regional
Pensacola
00:21
56.1
103.9
85
KPNS
KECP
Pensacola
NW Florida Beaches
00:27
72.4
134.1
86
KECP
KAAF
NW Florida Beaches
Apalachicola
00:21
55.0
101.9
87
KAAF
KCTY
Apalachicola
Cross City
00:38
100.4
185.9
88
KCTY
KOCF
Cross City
Ocala
00:20
53.8
99.6
89
KOCF
KISM
Ocala
Kissimmee Gateway
00:25
67.3
124.6
90
KISM
KFPR
Kissimmee Gateway
Treasure Coast Intl
00:28
73.8
136.7
91
KFPR
KLNA
Treasure Coast Intl
Palm Beach County Park
00:21
56.4
104.5
92
KLNA
KTMB
Palm Beach County Park
Miami Executive
00:22
59.8
110.7
Map
A map of all those points mapped to give a simple overview: