Flight Planning & Performance (FPP)
For a live overview of my flight lessons, visit: https://flighttools.justinverstijnen.nl/flightlessontracker
This page can contain a collection of personal notes, steps to remember, finished and unfinished content. Please excuse brevity.
Do not use specific information given like fuel flow, landing/take-off distances for your flights. Always refer to the POH of your exact plane for flight preparation. My information is just for references that I used.
Introduction to Flight Planning and Performance (FPP) (1)
Before we step into an airplane we are required to know the aircraft performance in our particular situation. We can ask ourselves questions like:
- How much runway distance do we need for take-off and landing?
- How long does our climb phase take to our cruising altitude?
- What will our cruising speed?
- What will be our fuel usage?
- What will be our gliding distance?
Now these are not questions we will guess or something but we carefully calculate using numbers and graphs from the pilot operating handbook (POH) of our particular plane type.
In this module we will dive deeper in these questions and look at how we can make these calculations.
Air density
The air density is a unit of how much air molecules a certain part of the air contains. We will pronounce this as kg/m³. In the International Standard Atmosphere which is the baseline reference for our pilots, the definition of this is at mean sea level that one cubical meter air (1000 liters) weighs 1,225 kilograms. So 1,225 kg/m³.
Air density is determined by a few factors like air pressure and temperature and derives from the general gas equation:
- Air Pressure (P): the air pressure in Pa (hPa x 100)
- Gas constant (R): this is a ratio between pressure, density and temperature. We mostly use the number 287 for this, the ratio for dry air.
- Air temperature (T): the air temperature at your airfield or cruising altitude in Kelvin, which is degrees celsius + 273.
Density (ρ) = P / (R x T)
An example calculation using todays numbers:
METAR EHLE 031055Z AUTO 24010KT 9999 FEW016/// BKN019/// BKN022/// 18/14 Q1010 TEMPO 6000 -SHRA SCT018CB BKN022
- Pressure: 1010 hPa x 100 = 101000 Pa
- Gas constant: 287
- Air temperature: 18 degrees celcius + 273 = 291
101000 : (287 x 291) = 1,209 kg/m³
This tells us that today the air is less dense than ISA, meaning we can expect worse aircraft performance. A result of the less density is the higher temperature (18 degrees instead of 15 according to ISA).
Density Altitude
To make this calculation somewhat easier for pilots to make, we have something called the Density Altitude. This is an altitude indication of how your aircraft will perform according to ISA. This makes these calculations much easier as we talk in altitudes instead of density like 1,225kg/m³. For example, if the density altitude is 3000ft we can expect performance as we are on 3000ft. This doesn’t mean we are actually on that altitude but is the altitude corrected for the actual air density.
Every 1c degree deviation of ISA temperature, we take 120ft as rule of thumb. If the air is colder than ISA this is a negative number, resulting in a lower altitude as the air is more dense. To calculate the density altitude we use the following formula:
Pressure altitude + (ISA DEV x 120) =
In the Netherlands, this density altitude often doesn’t make huge differences, but in countries with high elevations this can make huge differences in flight performance. Especially if you don’t take it into account. Let’s make up an example of Sedona Airport in the USA, the training airport when playing Microsoft Flight Simulator.
METAR KSEZ 032035Z AUTO 03008KT 9999 CAVOK 37/16 Q1018 NOSIG(corrected for European readers)
As this airport has an elevation of 4825 ft, we are a huge portion away from sea level. The airport also is in the rocky mountains range making the temperatures huge.
To calculate density altitude, we need the pressure altitude first. This is the “ISA” altitude corrected for active air pressure. This is 4825 - 150ft = 4675 ft. As we have 5 hPa higher air pressure than ISA this is a little win. Now the density altitude.
37 degrees - 15 = 22 degrees of ISA deviation.
4675 + (22 x 120) = 7.315 ft Density altitude, which is almost 3.000ft higher
Mass and Balance (2)
The weight of an aircraft is a key factor to determine the flying performances. With the weight, we can calculate almost every V speed and the distance required for climb, take-off and landing. An aircraft is designed to operate in a specific weight range because exceeding this would result in unflyable planes with performance and controls not working as intended.
The key point here are:
- Mass: The weight force, at 1G this is equal to the weight but increases or decreases if G forces do
- Balance: The center of gravity point which must lie within limits
Why calculating Mass and Balance is being so important is partly described in this video, where the center of gravity of the plane shifted fatally to the aft part of the plane: https://www.youtube.com/watch?v=hvZEr3IkLJI
As mass and weight are mostly the same (if not talking about G forces), I continue to use the word weight.
Weight limits
We have two primary reasons why planes have maximum weights where they are certified for:
- Structural limits: An increase of weight means the planes’ stressing factor is also increased, like the design-load.
- Performance limits: The performance of planes are heavily dependent on the weight, like take-off and landing distances but also the V speeds like stall speed, best climb speed, glide speed etc.
Aircraft manufacturers use these terms to indicate the limits of weight for their aircrafts:
| Limit name | Abbreviation | Description |
|---|---|---|
| Maximum ramp weight | This is the overall maximum weight of the plane excluding calculated taxi-fuel. This is the limit of air plane before even moving to the runway. | |
| Maximum take-off weight | MTOW | This is the maximum weight the aircraft can be at take-off. Above this weight the forces must work really hard, exceeding structural limits where the plane is not designed for. |
| Maximum zero-fuel weight | MZFW | This is the maximum weight of the aircraft excluding usable fuel. |
| Maximum landing weight | MLW | This is the maximum weight at landing. When landing, the full weight of the plane must get on the ground, possibly harder than needed. This often results in the maximum landing weight being lower than the take-off weight. |
Exceeding these weights will result in the plane being classified as un-airworthy.
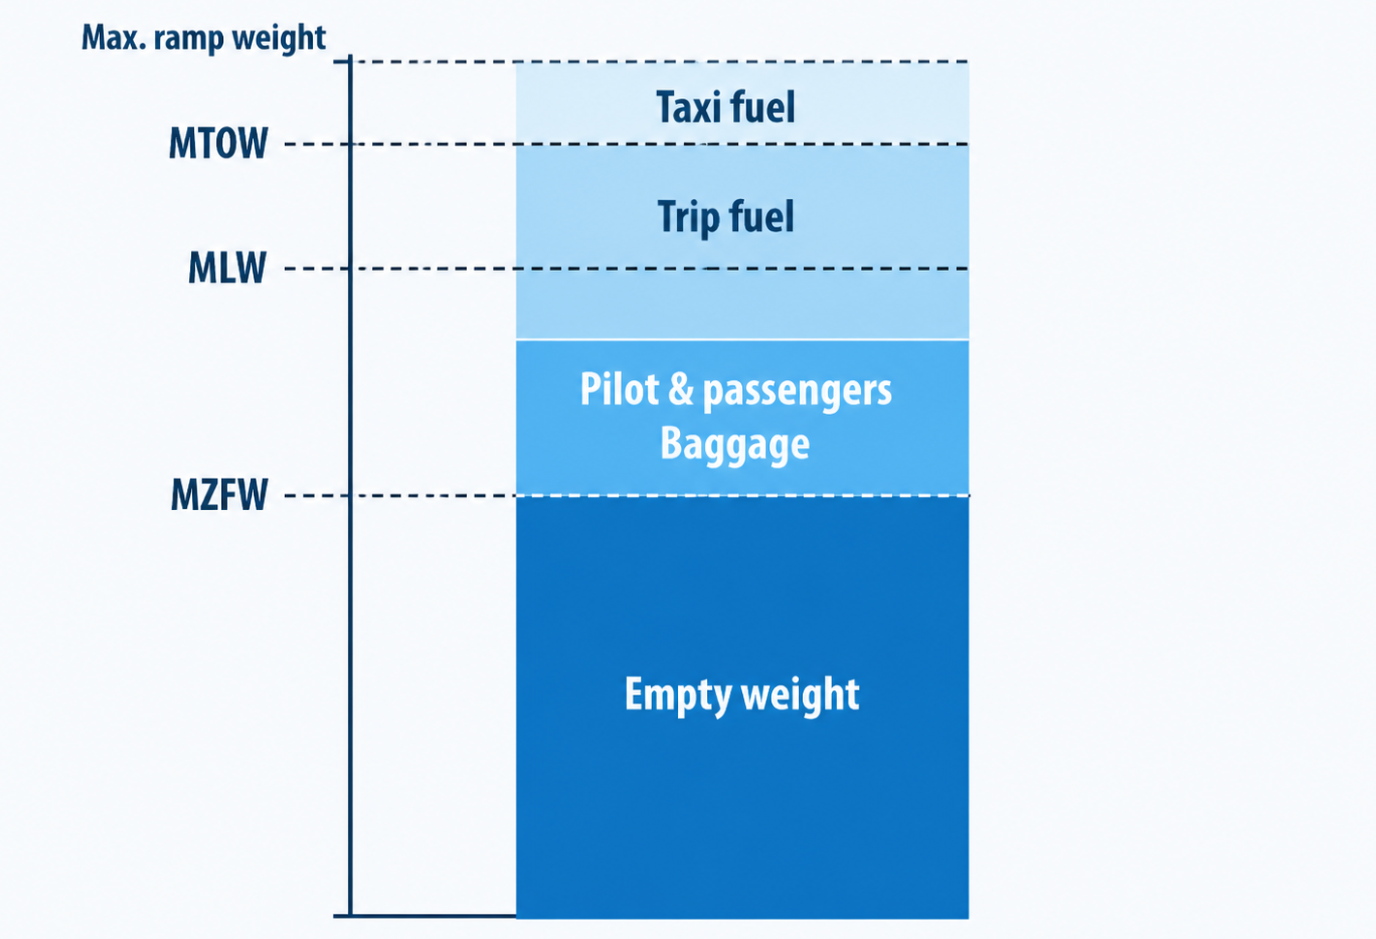
When performing fuel and weight calculations and realising that we cannot take-off from a runway with a certain mass, you must re-do your calculations in terms of weight and fuel. To lower the amount of runway needed, you need to decrease the weight.
Determining the weight
To determine an aircrafts weight, we have to calculate the actual weight of an aircraft. This is basically a sum of all known weights.
| Weight name | Abbreviation | Description |
|---|---|---|
| Basic empty weight | BEW | The basic weight of a plane without usable fuel, including unusable fuel. It also includes structure, engine etc.This is a number weighed by the maintenance company (CAMO). My training Cessna 172 for example is more or less 700kg. |
| Crew and passengers weight | POB | The persons’ weight of every pilot and passenger combined. Sometimes its better to “overguess” than actually asking people ;). |
| Baggage weight | The weight of the baggage. | |
| Fuel weight | The weight of the usable fuel which we calculate based on the type of fuel. |
The sum of all those weights give us the actual of gross weight and will decrease during flight as the fuel is being consumed.
Fuel weight
We calculate the weight of the fuel in our plane by picking default numbers based on the fuel we use. This is based on fuel density where we calculate the volume multiplied by density:
- Density of AVGAS/MOGAS/Car gasoline - 0,72kg/liter or 6lg/USG
- Density of Jet-A1: 0,84kg/liter or 7lb/USG
And we can use these numbers for conversion:
- 1 Pound (lb): 0,4536 kg
- 1 US gallon: 3,785 liter
- 1 Imperial gallon: 4,546 liter
- 1 quart (qt) = 0,95 liter (a quarter gallon)
Tip: use my Unit conversion tool https://flighttools.justinverstijnen.nl/unitcalculator
Fuel terms
To calculate fuel, we have different categories where we use different parts of fuel. We must have enough fuel on board for the complete flight, possible diversion and even more than that. As fuel calculations are very important we determine the amount using these terms:
| Fuel category | Used for |
|---|---|
| Taxi fuel | Taxiing to the runway excluding taxi after landing |
| Trip fuel | Take-off, climb, cruise, descend, approach and landing |
| Reserve fuel | Three types of reserve fuels needed in some situations |
| Contingency fuel | (+~5%) Fuel for unforeseen circumstances like wind, deferring routes, holding patterns |
| Alternate fuel | The fuel needed from destination to alternate including go around at destination, climb, cruise, descend, approach and landing on alternate. |
| Final reserve fuel | The minimum fuel that must be on board after landing. VFR flights this must be at least 30 - 45 minutes. This may also never be touched. |
| Extra fuel | All extra fuel on board for possible connected flights or flights to aerodromes without fuel station. |
| Block fuel | The total amount of fuel when departing from your parking place/ramp. |
We base the forseen fuel consumption on the numbers of the pilot operating handbook.
Center of Gravity
The center of gravity (CG) is the central point of the gravity force. This point must be between the boundaries of the plane, as this has effect on the aircrafts performance. This center of gravity in general aviation aircraft is often determined in numbers of inches from a reference point. This reference point is called the “datum”. The reference point are mostly:
- The firewall (wall between engine and cockpit)
- Forward point of the fuselage/propellor
- Wing leading edge
The pilot operating handbook will describe what the datum of your particular plane is. This point must be the same for that same aircraft at all flights.
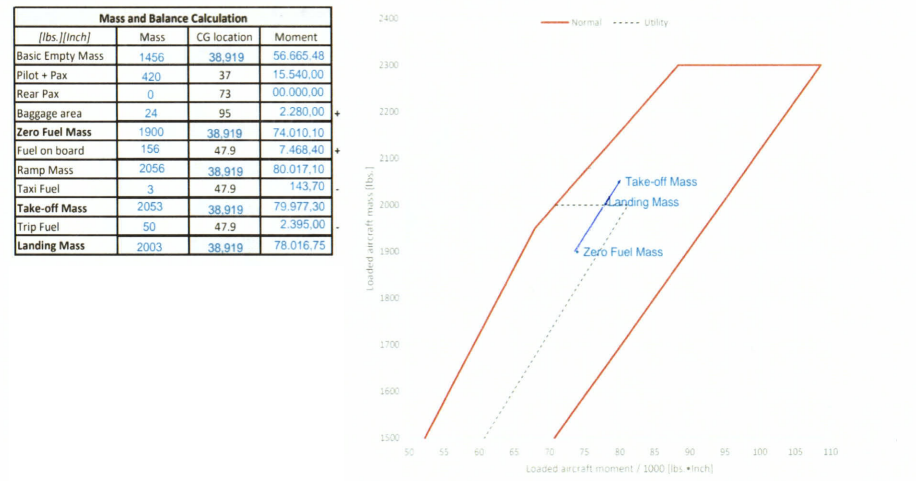
Here I created a mass and balance sheet for a Cessna 172 in my second flight lesson, fully within the technical limits of the aircraft.
- Normal category flights must stay within the red lines
- Utility/aerobatic flights must stay within the grey dotted lines
This states what the forward and after limits of the plane are in terms of center of gravity and how much weight we may carry. The whole flight, your weight and balance must be within the performance envelopes. This is the red area on the graph above.
To calculate the mass and balance, note all weights like done in the picture above and lookup the CG locations of your plane in the POH. Then its simply a multiply-sum where the weight must be multiplied by the CG location which gives the moment-number -> the resulting turning effect. Always use a method with a table and graphic to be sure about your aircrafts limits.
Weight, Arm and Moment
To determine the center of gravity the moments are very important. We will talk about this three terms here:
- Weight: The force applied by an object due to its mass and gravity
- Arm: The distance from the reference point or pivot point to the line of action of the force
- Moment: The resulting turning effect produced by a force acting at a distance from a reference point or pivot point
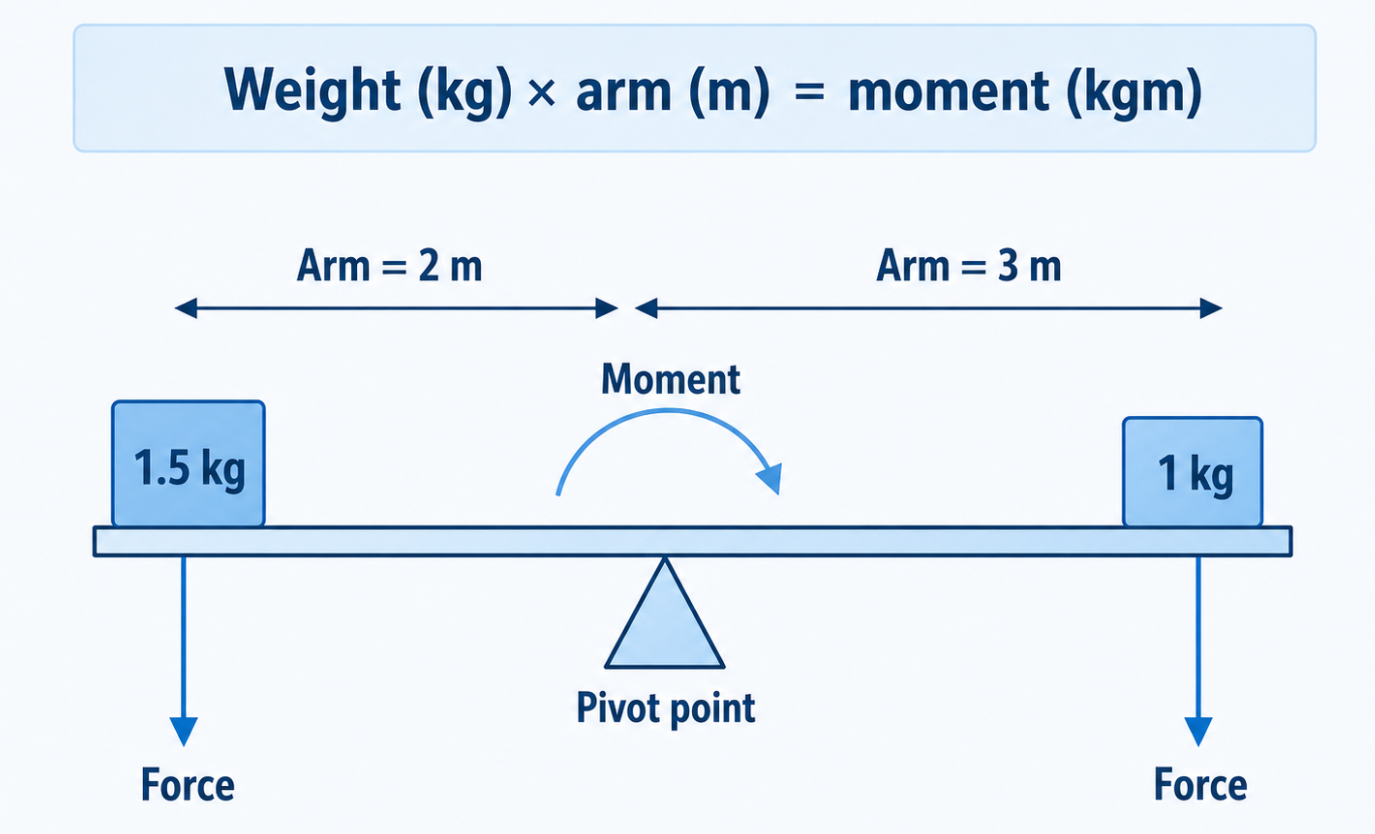
Arm and moment in picture.
During the flight, the center of gravity always will shift somewhat because of thefuel consumption. This effect can be bigger when the tanks are further away from the center of gravity. When having wingtanks, this effect is small but be aware to stay within the envelope of the mass and balance scheme. This is also the reason we always calculate the zero fuel weight.
Take-off and landing performances (3)
Calculating take-off and landing performances is crucial to us pilots as we want to know if we can land on a particular airport and runway with particular circumstances. To overcome shortage of runway, we calculate the distance we need according to the numbers in the POH. As the weather is never completely the same, we use the International Standard Atmosphere as reference point.
Take-off distances
The take-off consists of 2 different phases:
- Take-off run/Ground roll: The first part where we power the engines to create enough speed and lift to get of the ground.
- Initial climb: The first climbing phase where we need to clear an altitude above the ground (AGL) of 50 ft or 15 meters.
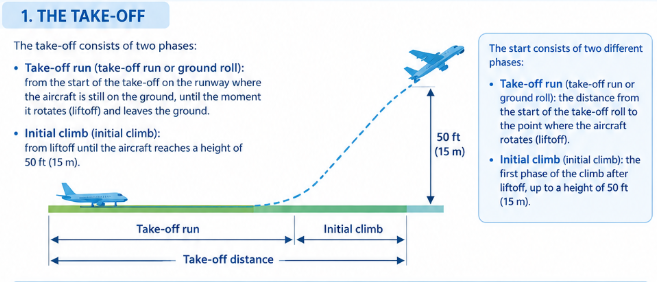
In the middle of the whole take-off we have Vr speed which we start rotating to get in the air. This is the aircrafts’ designed speed when taking-off is possible. We also know a Vlof speed which is the speed the plane comes loose of the ground, which is mostly close to Vr speed. We use this speed often in soft field take-offs to quickly get off the ground and win speed using ground effect.
Available take-off runway lengths
Determining the take-off performance is part of flight preparation. The needed distances must fit within the available distances at that time. We use three different terms to indicate the available runway length:
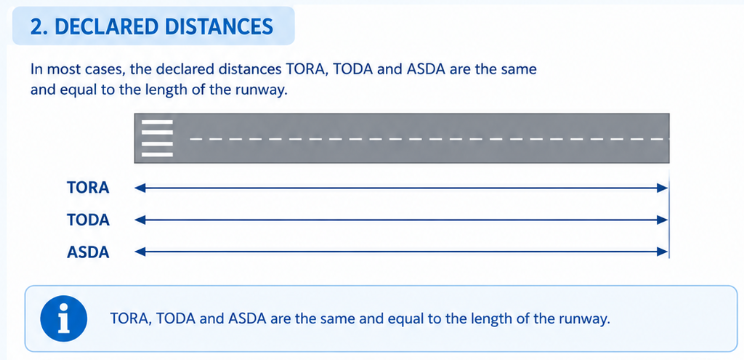
- Take-off run available (TORA): The distance available for the the take-off run.
- Take-off distance available (TODA): The distance available for the take-off run and climb to 50ft.
- Accelerate-stop distance available (ASDA): The distance available for a rejected take-off.
In the most simple cases, these three values are exactly the same, but this is not always the case.
Stopway and Clearway
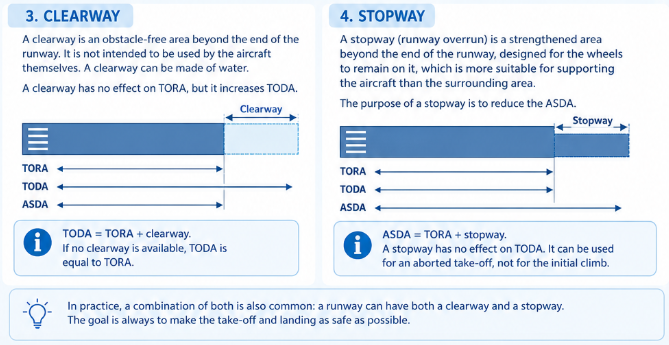
Much airports around the world have additions to the runways for safety and ease of use. The 2 categories are:
Stopway : A paved (verhard) addition to the runway only used for rejected take-offs (ASDA)
- Sometimes on bigger airports this contains EMAS.
- TORA + Stopway = ASDA
Clearway : A clear-of-objects addition to the runway which can only be used for the climb to 50ft (TODA). This can also be sand or even water.
Sometimes, the stopway and clearway are combined as the image below states.
Landing distances
We devide the landing phase into two phases:
- Airborne distance: This starts at a distance of 50ft above the runway till touchdown
- Landing ground roll: Begining from touchdown all the way till the plane has come to a complete stop
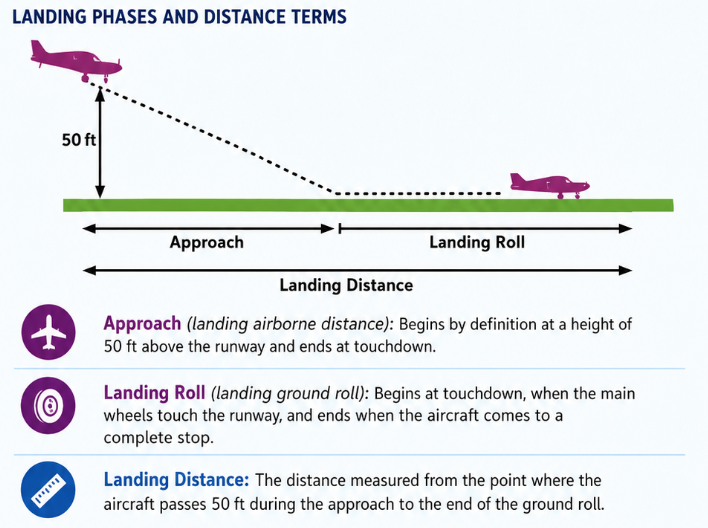
The landing distance is therefore calculated starting from that 50ft point all the way till the end of the ground roll. The landing distance available (LDA) is the distance from runway threshold till the end of the runway which can be found in the AIP. Some airports have a displaced threshold where the runway doesnt start at the beginning of the runway material.
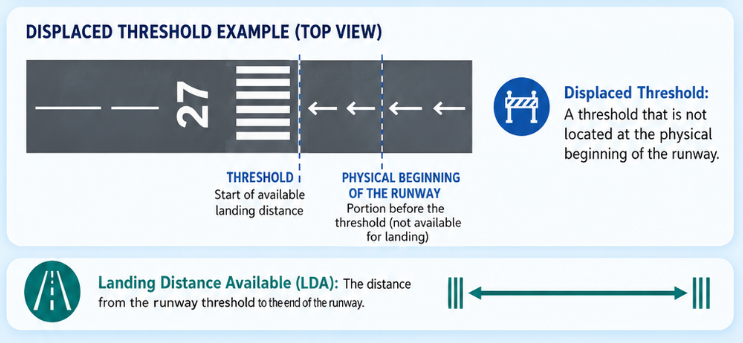
The part before the threshold can be used for the take-off but not for landing. This does also count for a stopway and clearway.
Take-off and landing distance factors
https://flightblog.justinverstijnen.nl/ppl-theory-fpp/#density-altitude
There are multiple factors influencing the take-off and landing distances which are:
- Weight (Take-off weight)
- Wind
- Density altitude (density of the air, Dense = more lift)
- Approach-speed (landings)
- Runway state (Dry, Damp, Wet or Contaminated)
- Runway slope
- Flaperons (Flaps)
Weight (Take-off weight)
An increase of weight requires us to make more speed, therefore increasing the take-off distance. As the weight factor increases, we also need to produce more lift and also requiring in a higher speed (Vlof). You can find the impact of weight on the take-off distances in the POH.
A rule of thumb we can use in general aviation aircraft is: an increase of 10% weight extends the required distance with 20%.
When landing, the weight will also increase our landing distance. More weight means a longer distance to stop that kinectic energy. More weight sometimes results in a higher approach speed. When landing after a flight, we have less fuel so also less weight. This lowers the gross weight. A good best practice is to use the take-off weight for your landing calculation, so you calculate with the numbers from the start.
Wind
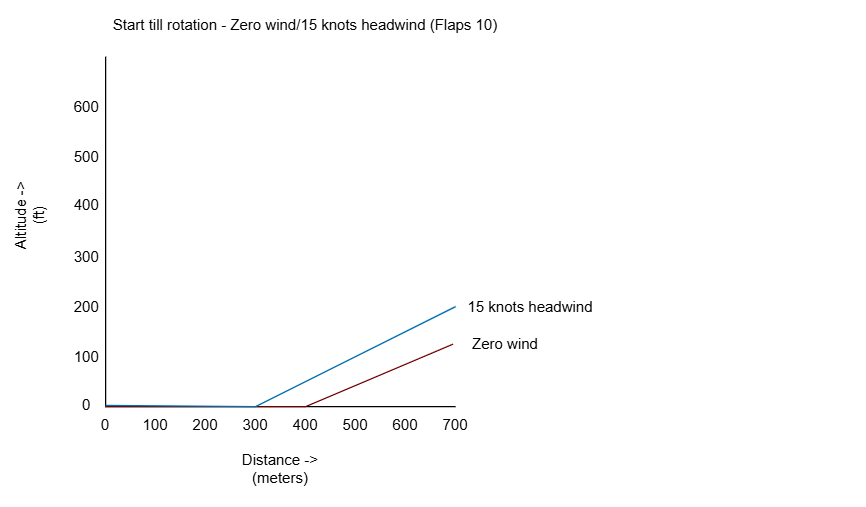
The wind also is a major factor in take-off distances. As an aircraft uses air masses to fly through, we get more of that air by flying into the wind, having Headwind. Therefore increasing our TAS and decreasing ground speed, resulting in needing less take-off distance.
- Headwind -> less ground speed: Decreases take-off and landing distances
- Tailwind -> more ground speed: Increases take-off and landing distances
To give an indication of the differences check out the picture below, altough with headwind we will be able to reach a much steeper climb:
Density altitude
The density of the air is also an important factor of the take-off and landing distance required. As we know, the density of the air is a factor in the lift formula:
- Lift = 1/2 ρ V² CL S
| 1/2 ρ V² | CL | Surface |
|---|---|---|
| The dynamic pressure of the incoming airflow (TAS) | Lift Coefficient | The surface of the wing |
The Rho (ρ) describes the density of the air. Altough the Rho and Airspeed are somewhat related as they both are in this formula:
- If density (ρ) decreases, Airspeed (V) must increase
- If density (ρ) increases, Airspeed (V) can decrease
Factors which influence the Density altitude and so our distances, which can obviously be a combined factor:
- High temperatures, warm air expands having less room for air molecules per m³
- Low air pressures due to high elevation or low pressure areas
In general aviation aircraft, the pressure altitude is enough as the tables and graphics in POH’s already contain this correction for temperature.
To learn more about Density Altitude, check out: https://flightblog.justinverstijnen.nl/ppl-theory-fpp/#density-altitude
Approach Speed
The approach speed is often referred as the stall-speed multiplied by 1,3. In some cases we need a higher approach speed than normal, like when having more weight, flapless landing or weather conditions like gusting winds.
Runway state
The state of the runway is also an important factor for our required distances. The state is determined by three parameters:
- Runway material: Paved, Grass, Sand etc.
- Runway contamination: Dry, Damp, Wet and Contaminated
- Runway action: Number between 1 and 6 where pilots determine the brake-action score
As the surface of course is also a factor on our total needed distance for take-off and landing. A grass runway has a longer ground-roll than a asphalt runway for example.
Slope
A slope in the runway, especially in mountain-rich area’s is also a major factor in take-off and landing performance. This slope is described in a percentage. This percentage is based on the difference between elevation of the threshold and end, divided by the runway length multiplied by 100. If this is a difference of more than 2 percent, this will be mentioned on the airport-charts and AIP.
Taking off while going up on the slope results in a slower take-off needing more of the distance. Taking off downslope results in a shorter distance as gravity will help us gaining speed.
Flaperons (Flaps)
When performing short-field or soft field take-offs, flaps are recommended to use. Flaps increase lift, needing less runway for lifting off. This also decreases our ground roll, but increases some drag on our plane. This will result in a less steep climb-out and slower climb speed. We mostly retract them at around 200ft AGL.
Track and Crosswind components
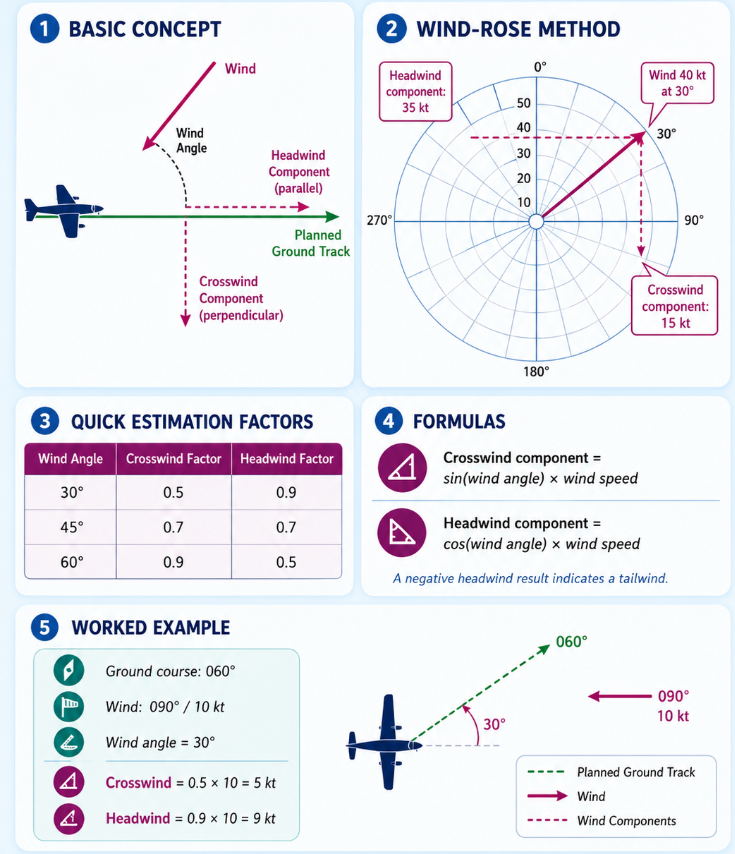
Winds can be divided into two different components when flying an aircraft:
- Track wind component: The wind directly on your track (wind is determined from the source)
- Crosswind component: The wind that comes from the sides, setting you on a different track
Sine and Cosine
The sine and cosine are trigonometric functions to calculate a value of an angle.
- Cosine (X) represents the horizontal side of the angle divided by the hypotenuse
- Sine (Y) represents the vertical side of the angle divided by the hypotenuse
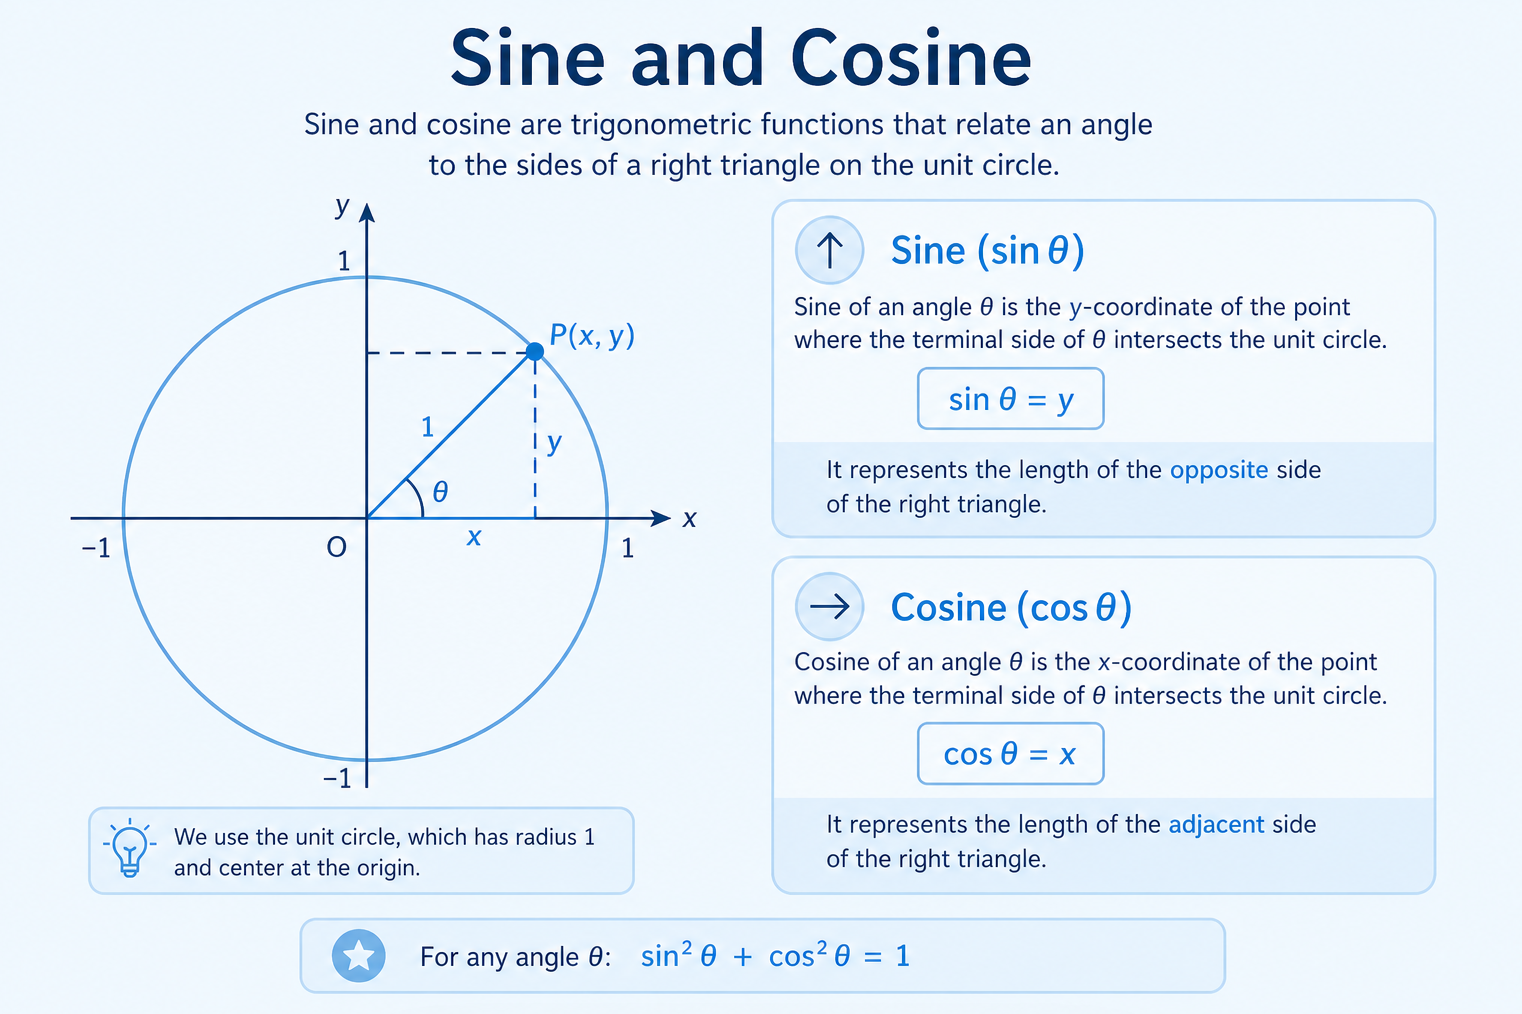
In aviation we mostly use the much easier version described above, but now you have seen the theory about these two functions.
Calculating Take-off and landing distances based on tables
To calculate and determine our take-off and landing distances, we need the numbers from the pilot operating handbook (POH) of the plane. Hiere all numbers are described in the two phases of take-offs and landings:
- Ground roll
- 50ft off the runway before landing or while climbing
For all of those calculations the numbers in the POH are the base numbers, or minimum required in best conditions based on the actual pressure altitude according to ISA and a selected temperature. On top of those numbers we add factors like described, which can look like these:
Take-off
| Penalty description | Increase basic required take‑off distance |
|---|---|
| Every 100 ft aerodrome elevation above AMSL | +1% |
| Every °C above OAT | +1% |
| Headwind (per knot) | −1% |
| Tailwind (per knot) | +20% |
| Runway slope (uphill, per 1%) | ≥ 5% |
| Grass runway – dry | +25% |
| Grass runway – wet | +30% |
| Soft ground | ≥ 25% |
| Snow | ≥ 25% |
| Gravel | +7% |
| Flapless take-off | +60% |
| Generic take-off penalty (Always applies) | +25% |
This prevents discovering at 45 knots that the runway is too short. Worst‑case thinking is essential.
Landing
| Penalty description | Increase basic required landing distance |
|---|---|
| Every 100 ft aerodrome elevation above AMSL | +0.5% |
| Every °C above OAT | +0.5% |
| Headwind (per knot) | −1% |
| Tailwind (per knot) | +20% |
| Runway slope (downhill, per 1%) | ≥ 5% |
| Grass runway – dry | +30% |
| Grass runway – wet | +38% |
| Soft ground | ≥ 25% |
| Snow | ≥ 25% |
| Gravel | +7% |
| Flapless landing | +60% |
| Generic landing penalty (Always applies) | +43% |
As we can see, much factors can determine the distances and basic required is almost never possible. However, these are summed up easily and including all factors while POH’s will offer you tables like these:
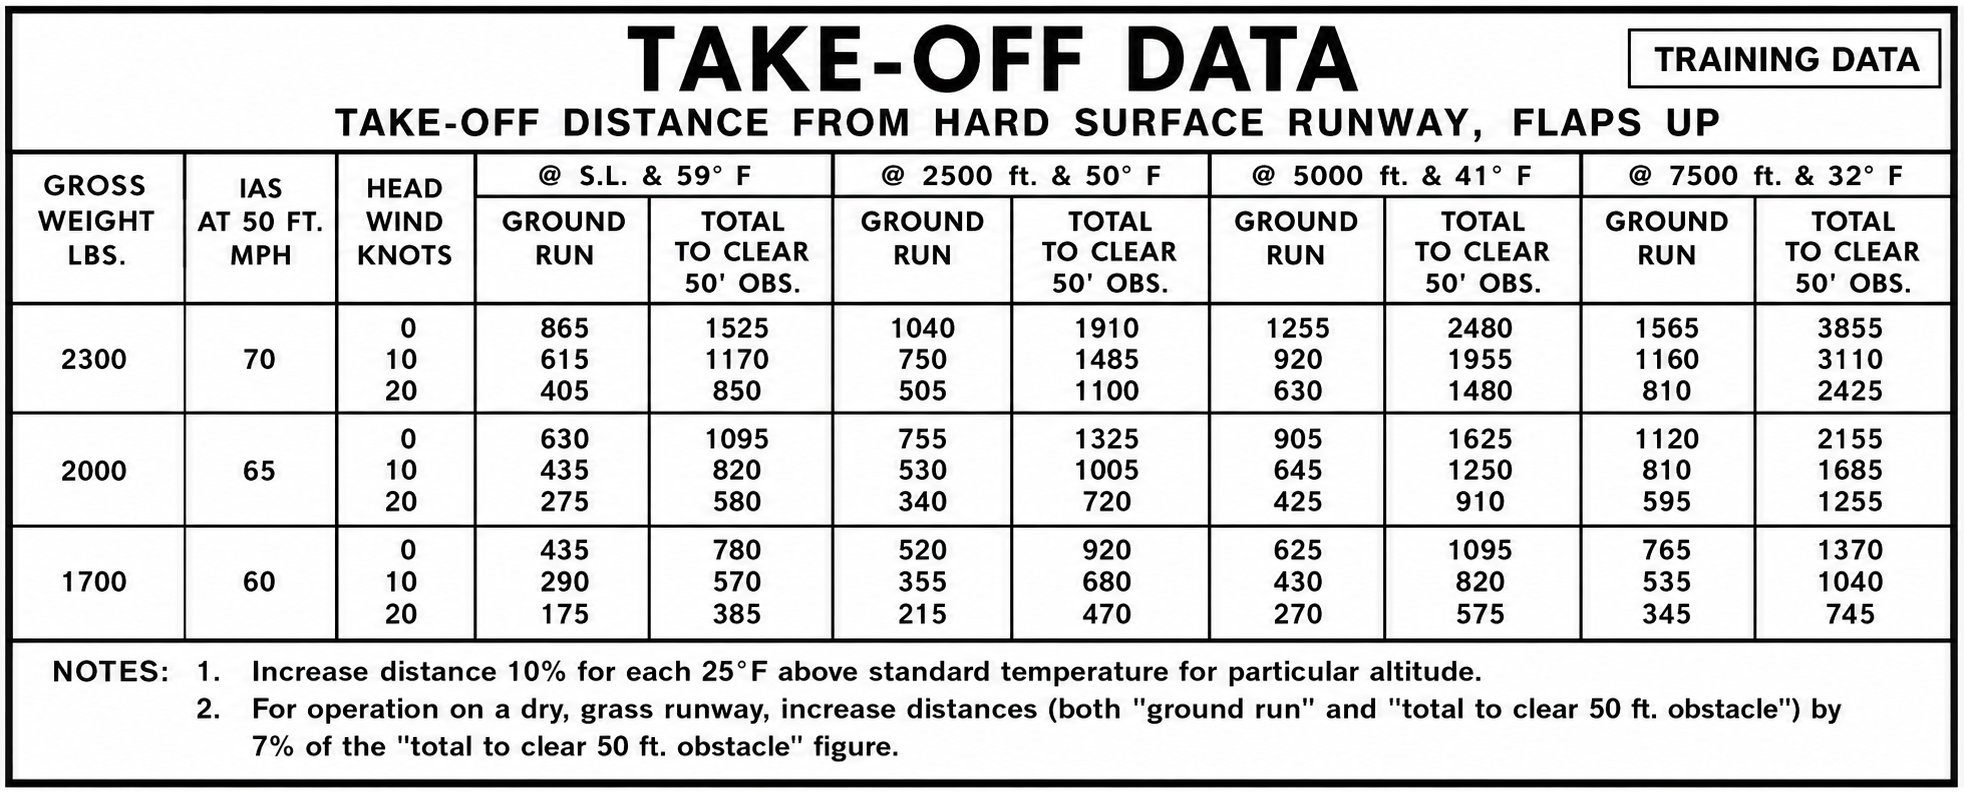
Calculating take-off distances based on graphs
A skill we need to posess is calculating take-off distances using these graphs. An example can be found here:
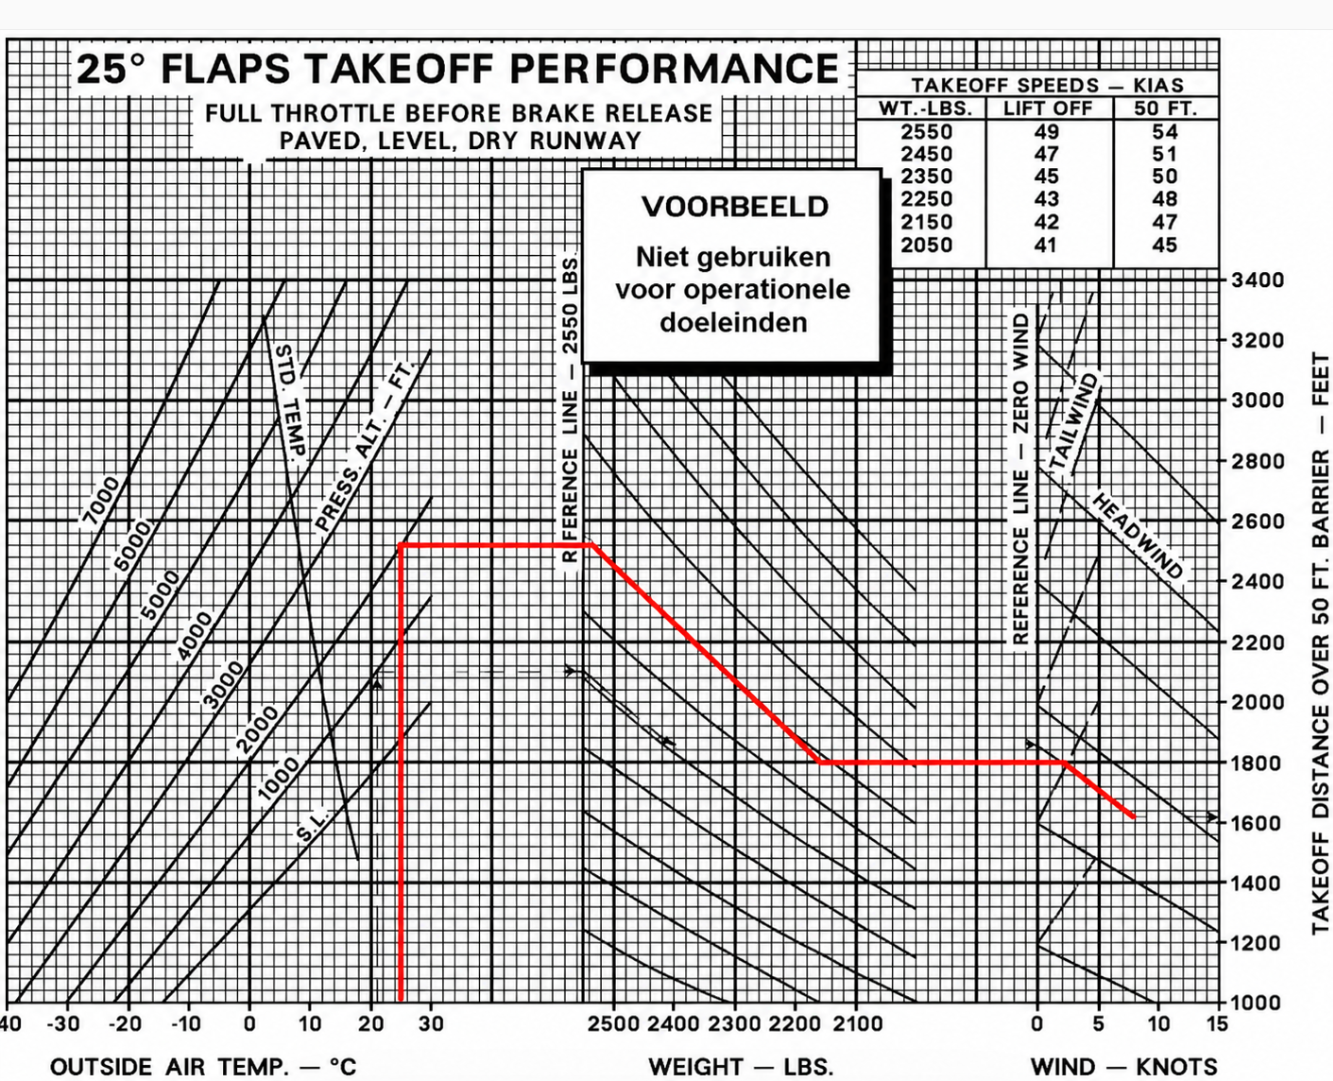
The variables used are:
- Runway temperature: 25°C
- Airfield elevation: 2500 ft
- Pressure altitude: 2041 ft
- Density altitude: 3731 ft
- QNH: 1030 hPa
- Headwind: 5 KT
- Take-off weight: 2150 lb
- Flaps: 25 degrees
We start at the left, co-relating the temperature to the pressure altitude. This corrects the pressure altitude to the actual outside temperature (hey the Density altitude). Then we shift from there in a straight line to the weight coloumn. We pick the first line there and follow that to the actual weight. Then from that weight we set a straight line to the wind component. As we have 5 knots headwind, our take-off distance will be decreased so the line has to go down. We join the first downward line to take some margin into account, leaving us with a total take-off distance of 1640ft which is 500 meters.
You can also parralel the lines but this approach gives us some extra margin.
Performance during cruise (4)
During the cruise phase, which means we are flying horizontal and level flight with constant speed, all forces of flight are in balance:
- Lift equals weight (L=W)
- Thrust equals drag (T=D)
Added to these forces is the first law of Newton, stating that an item which contains no net force, will be still or in a one-pairing movement.
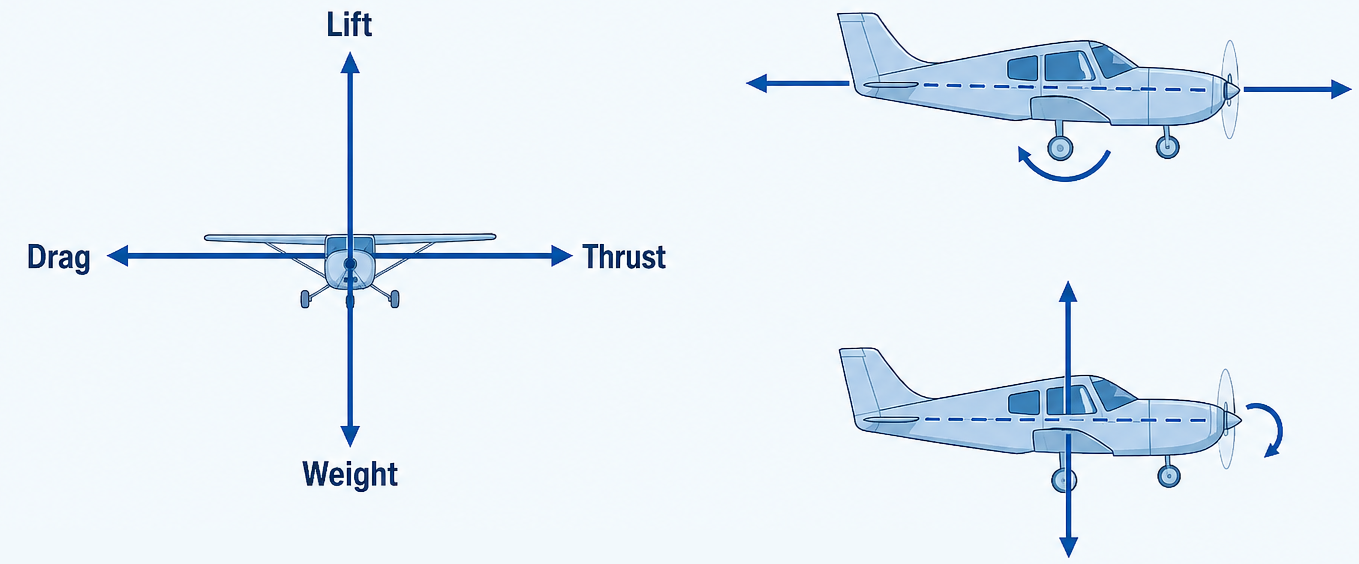
Lift and weight have different application points. Lift on the pressure point of the wings and weight on the center of gravity. However, lift and weight are a pair of forces, causing the plane to be nose-heavy. This pair is compensated by the tail-heavy pair thrust and drag. The sum of the force-pair must be 0, which results in a horizontal and level flight. However in practice, there is not a complete balance between the forces. The remaining pair is compensated by the horizontal stabilizer.
Flight performances
To determine flight performances we have multiple definitions available which all have their own meaning:
- Endurance: The time which a plane can be in the air with the available fuel (duration), meaning we fly at the lowest fuel usage per hour and at low RPM
- To fly for max endurance, fly V max endurance
- Range: The distance which a plane can fly with the avialble fuel (distance), meaning we fly at the lowest fuel usage per kilometer/mile.
- To fly for max range, fly V max range
- Radius of action (Actieradius): The distance the plane can fly with the fuel and also return back to the starting point
Cruising performance factors
The cruising performance of an aircraft is determined by factors like:
- Wind
- Flaps
- Weight and Balance
- Altitude
- Outside Air Temperature
Wind
The wind will only affect the range, not the duration of the flight. As we know the E6B flight computer by now, we now that when wind comes from behind, the wind helps us get to the destination faster and headwind will slow us down:
- Ground speed = TAS + tailwind (lower Vmax range)
- Ground speed = TAS - headwind (higher Vmax range)
If we want to fly max range, we must fly with tailwind. This brings us further on the chart. If flying both A–B and B–A routes, the negative effect of headwind is greater than the positive effect of tailwind.
Flaps
Flaps increase the parasite drag and require more engine RPM, decreasing the range and endurance. We mostly will not use flaps in cruising conditions.
Weight and Balance
The weight and balance will influence the endurance and range in their own ways:
- More weight means needing more lift, also needing a higher AoA but this will also increase induced drag and ultimately needs more thrust to counter-act
- A frontal center of gravity must be compensated by the horizontal stabilizer by a downward lift-force. This must be counter-acted by more lift on the wings, increasing drag, increasing thrust
- A AFT center of gravity will result in less drag and needing less thrust
Air density
At higher altitudes, we have less air density. However, we need more engine RPM to fly with less air density. Less air density also means less air molecules hitting your wings and less lifting force. We must have more true airspeed (TAS) to compensate for this and this will cost more engine RPM.
Performance calculations
To make a navigation-plan we must calculate the needed fuel consumption including cruise speeds in TAS. In the POH of the aircraft you can find tables, telling you exactly the fuel consumption in different scenarios which you can use for the calculation.
The biggest factors are:
- Density altitude (pressure altitude + temperature factor)
- Engine RPM setting
- Manifold pressure in constant speed propellor planes
Then we reference the tables in the POH for the actual numbers. Some general rules and guidelines to use these tables for your calculations:
- Pick numbers between altitudes/temperatures if actual numbers are not available
- Expect worse than needed
- Round off to the worse side rather than to the best side
- The BHP is the gross crank-shaft power
Fixed Pitch propellor
For Fixed-pitch propellor planes like the Cessna 172, this table looks like this:
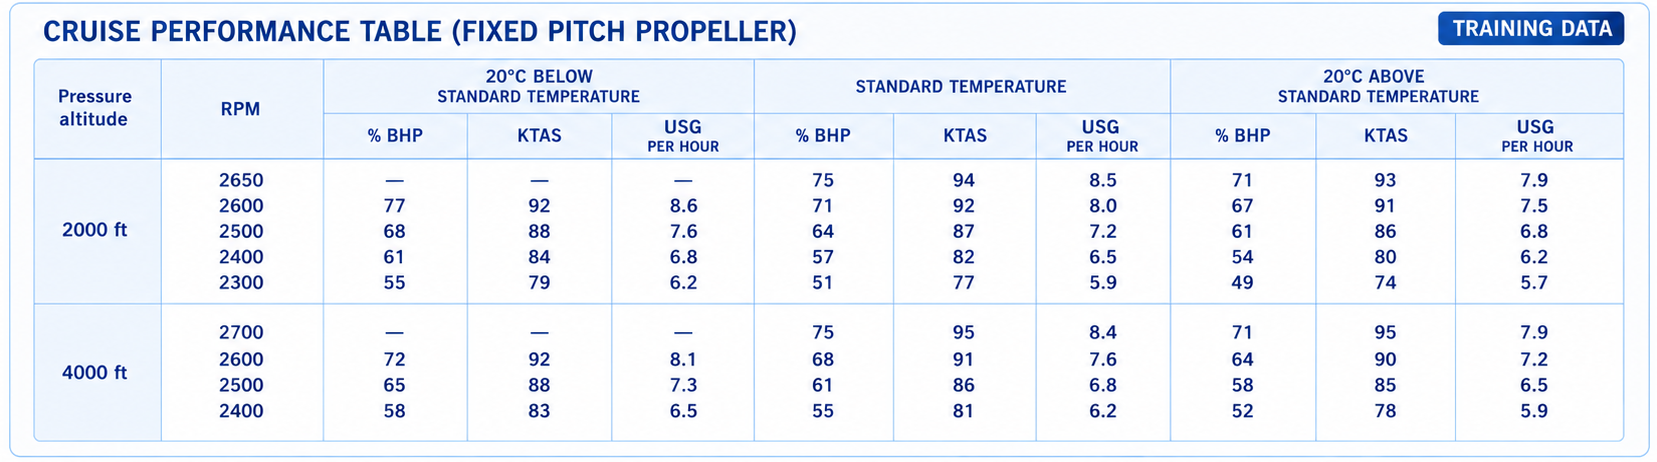
Let’s dive deeper into how to use this table for your fuel caulculation:
Pressure altitude: 3000ft
Temperature: 18 degrees celsius
Engine RPM: 2500
Time: 2 hour and 10 minutes (130 minutes)
We pick 7 USG/h according to the table, which is the in between for 2000ft 7,2 USG/h and 4000ft 6,8 USG/h. As the fuel cosumption gets less with higher temperatures, I stick with 15 degrees for ease and to calculate the worse numbers. Then we calculate the usage per minute to multiple it with the amount of minutes:
7 USG/h : 60 minutes/h x 130 minutes cruise time = 15,16 USG fuel usage in 2 hour and 10 minutes in these conditions.
Constant speed propellor
For Constant speed propellor planes like the Cessna 208 Grand Caravan, this table looks like this:
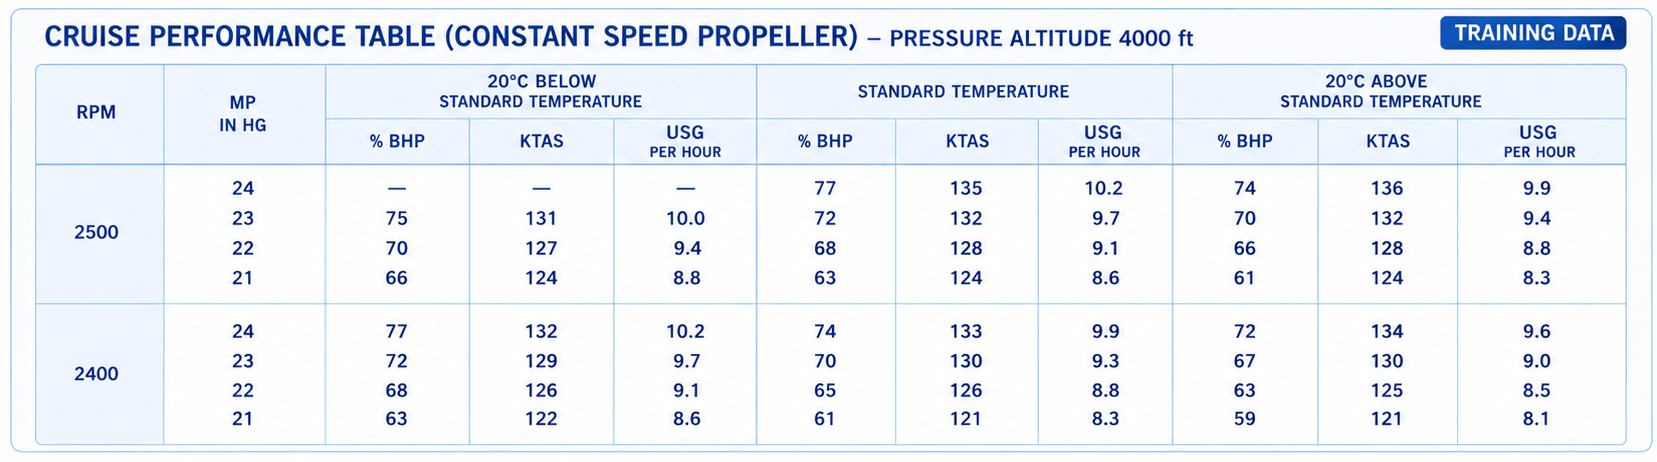
Let’s dive deeper into how to use this table for your fuel caulculation:
Pressure altitude: 4000ft
Temperature: 7 degrees celsius
Engine RPM: 2400
Manifold Pressure (MP): 22 inHg
Time: 1 hour and 50 minutes (110 minutes)
We pick 8,92 USG/h according to the table at the standard/ISA section The difference between ISA’s 8,8 and 20 degrees less is 0,3 USG/h, so let’s pick 0,3 and divide it with 20 to get the USG difference per degree. Then we multiply this with 8 for our actual temperature deviation, meaning we need to add 0,12 USG/h to our ISA hourly usage (8,8 + 0,12 = 8,92). Then we calculate the usage per minute to multiply it with the amount of minutes:
8,92 USG/h : 60 minutes/h x 110 minutes cruise time = 16,35 USG fuel usage in 1 hour and 50 minutes in these conditions.
You see, sometimes we must interpolate the numbers on the scale or pick the worse numbers for the overview.
Performance during climb and glide (5)
During a straight climbing flight with a constant speed, we have a balance in forces. The weight of the plane is always vertically pointed to the middle point of the earth. The lift-force always points perpendicular to the incoming air flow and up into the air. Higher pitch also means a tilted lift force.
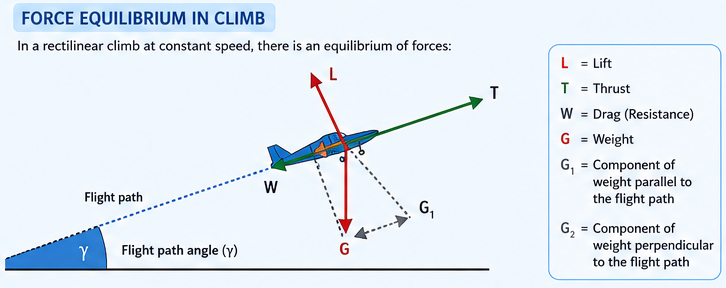
In climbing flights we have a split into two weight components:
- L=G1
- T=D+G2
During climb the lift is smaller than the weight, because G1 is less than G. This lift shortage is compensated due to the thrust is slightly upward, adding a vertical component. This added upward component results in needing some less lift.
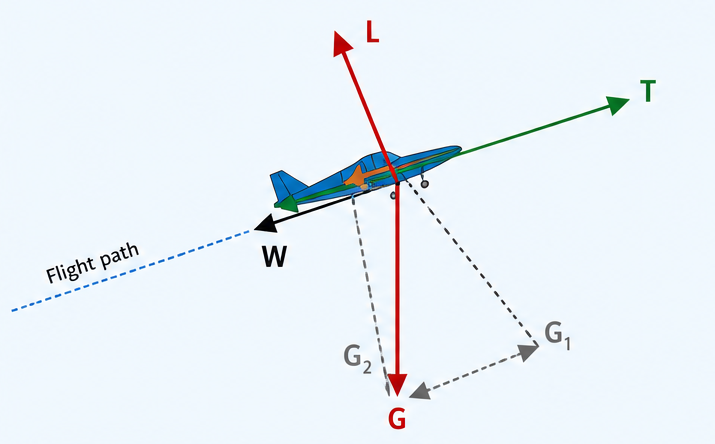
The thrust factor must not only compensate the drag but also a part of the weight. The weight also go a component on the longitudal axis in the same direction of the drag force.
Climb performance
The performance must be determined according to two criteria:
- Climb angle: This is the angle in degrees of how steep the plane climbs (on digital cockpits like the Garmin G1000 this are the lines on the screen)
- The climb speed in feet per minute (ft/min)
The climbing angle can be calculated with this formula:
sin = thrust - drag : weight
The climb angle is so the difference between thrust/drag and the weight. We also can determine the angle of climb in two different ways:
- Climb angle : The angle of climb relative to the incoming airflow
- Flight path angle : The angle relative to the ground
With no winds these two numbers are equal, but with a lot of headwind, the flight path angle becomes smaller meaning a steeper flight path. With tailwind, this angle will be more flattened.
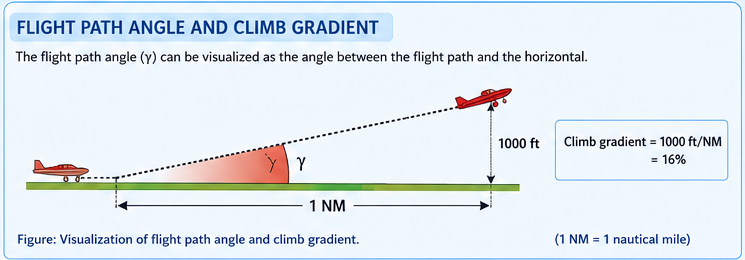
The climb gradient is the transition of the climb seen over a certain distance, like over a nautical mile. If we climb 1000ft per nautical mile (6076ft), we climbed 16% of a nautical mile in a minute. (1000 ft / 6076 ft × 100 = 16,46%)
The climbing speed/rate of climb is the vertical speed of a plane. This means as this is 1000ft, we will be 1000ft higher if maintaining that vertical speed for a minute.
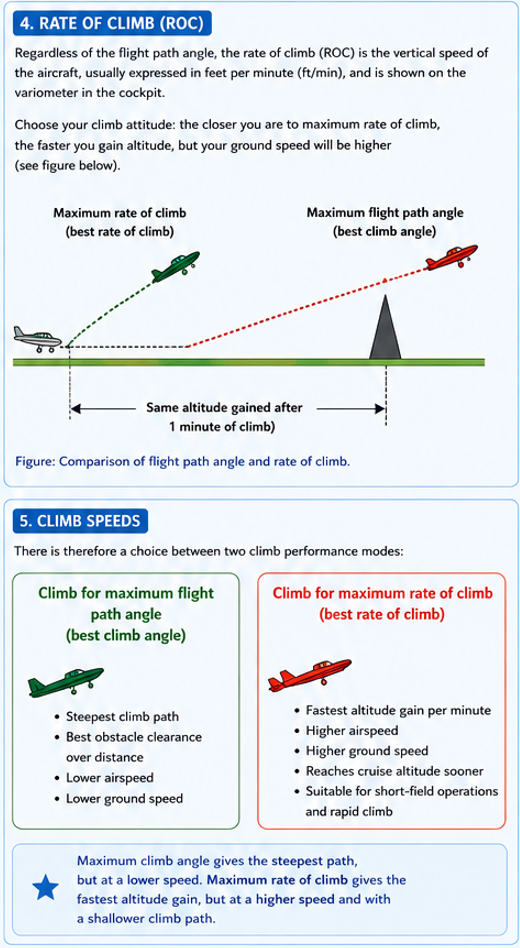
Green: Vx speedRed: Vy speed
Climb performance factors
The climb angle and rate of climb doesnt have static values but are determined by these factors:
- Air density
- Weight
- Flaps
- Extended/Retracted landing gear
- Wind
- Bank angle
Let’s describe them all.
Air density
The air density is determined by air pressure and temperature, as we already know by now.
- High air density means high air pressure and good aircraft climb performance
- Low air density means low air pressure and worse aircraft climb performance
The engine and propellor will perform worse with lower air pressure, as there are less air molecules to move and use to fly through. We also generate less lift, needing a higher AoA to maintain a certain amount of lift. Just enough to counteract our weight.
When climbing, we eventually hit a upper altitude limit of the plane. At that point, we climbed so much that the aircraft structure cannot generate more lift and thrust to get higher. For a Cessna 172 this is around 13.000ft. We know two certain limits:
- Theoretical ceiling: 0ft per minute (0 ft/min) (fpm)
- Practical ceiling: 100ft per minute (100 ft/min) (fpm)
These numbers are the result you can read on the vertical speed indicator when close to the limits. As we can almost never hit the actual ceiling, the practical ceiling is also the service ceiling described in the POH of the aircraft.
Weight
As we also already know, more weight means we need to generate more lift which therefore means more induced drag. This results in a lower rate of climb. When the plane becomes lighter after burning some fuel, the climb performance will be better.
Flaps and landing gear
Flaps and an extended landing gear will increase the parasite drag of the plane, which then will result in a slower rate of climb and a higher engine RPM.
Wind
Winds will influence the flight path angle and the climb gradient:
- Headwind: Less groundspeed and higher climb gradient
- Tailwind: More groundspeed and lower climb gradient
The wind only does change the speed opposing the ground, and as we can travel more or less distance to the ground, the gradient will be different.
Bank angle
As we bank, the lift vector will also tilt, needing more lift. In turns we will use some back pressure on the yoke to counteract this. In turns with a constant speed, you will notice a speed drop as result of extra drag. In climbing turns we use a limit of 15 degrees which is a nice compromise between climb speed, loss of some lift and turn speed.
Forces while descending
The forces of flight while descending are somewhat similar to climbing but then reversed. The gravity (G2) force gets a little thrust component and helping us to gain speed. This is why we descend with almost no power. During descends, the lift force ia slo a lot smaller because the negative AoA.
Forces while gliding
The forces while gliding, so with zero engine power, are slightly the same as descending, but we don’t have a small thrust power left. We have only some thrust left in the form of weight. This is why we sometimes call:
- Altitude : Potential energy (more altitude can be converted into speed because of this)
- Speed : Kinectic energy
Glide performace
During gliding flights, in most cases during an engine failure, we have two parameters to measure the gliding performance:
- Glide angle
- Glide gradient
In practice, we must immediately pitch to gain and maintain our best glide speed: Vbg. In a Cessna 172 this is around 65-68 knots. The point of minimum drag and most lift, the bottom part of the total drag curve. We want to keep as much options possible and therefore increasing the gliding distance is crucial for the options to land our aircraft. Maintaining the Vbg speed means that we have the smallest gliding angle opposing the ground.
Glide performance factors
The factors which can influence our glide flight are:
- Indicated Airspeed (IAS)
- Wind
- Flaps/Landing Gear
- Weight
Wind
Winds are very important when aiming for the highest gliding distance. We want to get tailwind, so we take advantage of the wind gaining more distance. When we actually want to land, then headwind is more favorable.
Headwind: Decreases glide distance
Tailwind: Increases glide distance
Flaps/Landing gear
Flaps and the landing gear will increase the parasite drag of the plane. Keeping those extended will therefore decrease our gliding distance significantly. We need to keep these retracted as long as possible.
Weight
The smallest gliding angle will be reached while maintaining one certain AoA, the one with the maximum L/D ratio. The angle however says nothing about the speed. More weight means an increase in the Vbg (best glide speed). A heavier plane therefore keeps a higher airspeed, meaning in reaching the surface faster.
End of the page 🎉
You have reached the end of the page. You can navigate through other blog posts as well, share this post on X, LinkedIn and Reddit or return to the blog posts collection page. Thank you for visiting this post.
Support the blog
