PPL Theory - Meteorology (MET)
Categories:
For a live overview of my flight lessons, visit: https://flighttools.justinverstijnen.nl/flightlessontracker
This page can contain a collection of personal notes, steps to remember, finished and unfinished content. Please excuse brevity.
Do not use specific information given like fuel flow, landing/take-off distances for your flights. Always refer to the POH of your exact plane for flight preparation. My information is just for references that I used.
The atmosphere (1)
The atmosphere is the layer around the earth, which is around 100 to 200km from the ground up. Worldwide, we use the International Standard Atmosphere which is a mean set of conditions which will be somewhat different depending on the weather conditions, location etc. This is a mean of the conditions at 45 degrees north latitude.
In the standard atmosphere, we use these characteristics:
- 0ft is at the mean sea level
- The air density is 1,225 kilograms per cubical meter
- The air pressure is 1013,25 hPa (millibar) or 29.92 inches of mercury (inHg)
- The temperature at sea level is 15 degrees celsius
- In the troposphere, the temperature decreases with 2 degrees celsius for every 1000ft up (2 degrees per 300 meters)
- The tropopause is at 36.000ft (11km) and the temperature is -56,5 degrees celsius
- The troposphere and stratosphere contains 78% carbon dioxide (co2) and 21% oxygen
This is a set of conditions, but some numbers can defer in the real world, due to the location or different seasons. Now, lets take a look at the different layers in our atmosphere:
| Layer | Altitude | Characterstics | Temperature gradient (ISA) |
| Thermosphere | 280.000ft and up 85km and up | Thin air and high temperature due to solar radiation. Auroras happen in this layer | Increases with altitude |
| Mesosphere | 160.000ft - 280.000ft 50km - 85km | Meteors burn up in this layer, coldest layer | 0c to -90c |
| Stratosphere | 36.000ft - 160.000ft 11km - 50km | Contains the ozone layer, stable air with some jet streams at the bottom | -56,5c to 0c |
| Troposphere | 0 - 36.000ft 0 - 11km | Bottom layer at the ground of earth and where weather/clouds take place | 15c to -56,5c |
Let’s take a further look into every layer in depth:
Thermosphere
The thermosphere is the first layer of the atmosphere and the one with the hisgest temperatures due to solar radiation. This layer also contains aurora’s and are the best visible from the (magnetic) north pole and south pole.
Mesosphere
The mesosphere is the layer above the Stratosphere and is the layer where the ozone layer resides. This layer is the part of the atmosphere where most meteors will burn up heated from the thermosphere, the layer above the Mesosphere.
Stratosphere
The stratosphere is the layer above the troposphere and starts very cold, but at the height it is around 0 degrees celcius. This is also the layer where the Concorde used to fly to achieve supersonic speeds, due to the low air density. The layer contains some jet streams.
Troposphere
In the troposphere, the lowest layer that spans from ground to around 36.000ft up is where all weather takes place. Here are the most winds, clouds and storms. When going from the ground up into the air in the troposphere layer, the temperature will decrease by 2 degrees celsius for every 1000ft you ascend. At around 36.000ft, the temperature is around -56,5 degrees celcius.
The temperature loss happens because of the loss of radiation coming from the earth. The sun warms up the earth, and earth radiates that heat back up into the air.
Ionosphere
We also have an additional layer called the Ionosphere. This is a layer where gasses will be ionized by the high level of solar radiation. The result of this is a somewhat conductive layer of electrons and ions where HF frequencies profit from. These will follow the curvature of the earth because of this Ionosphere, where normal frequencies follow a straight line colliding to the earth after around 300km. Also GPS can get some propagation errors because of the radiation in the Ionosphere.
This collective layer lays over the upper part of the mesosphere and thermosphere, residing between 60km and 500km altitude. However, its not classified as layer in our atmosphere but one with an important goal.
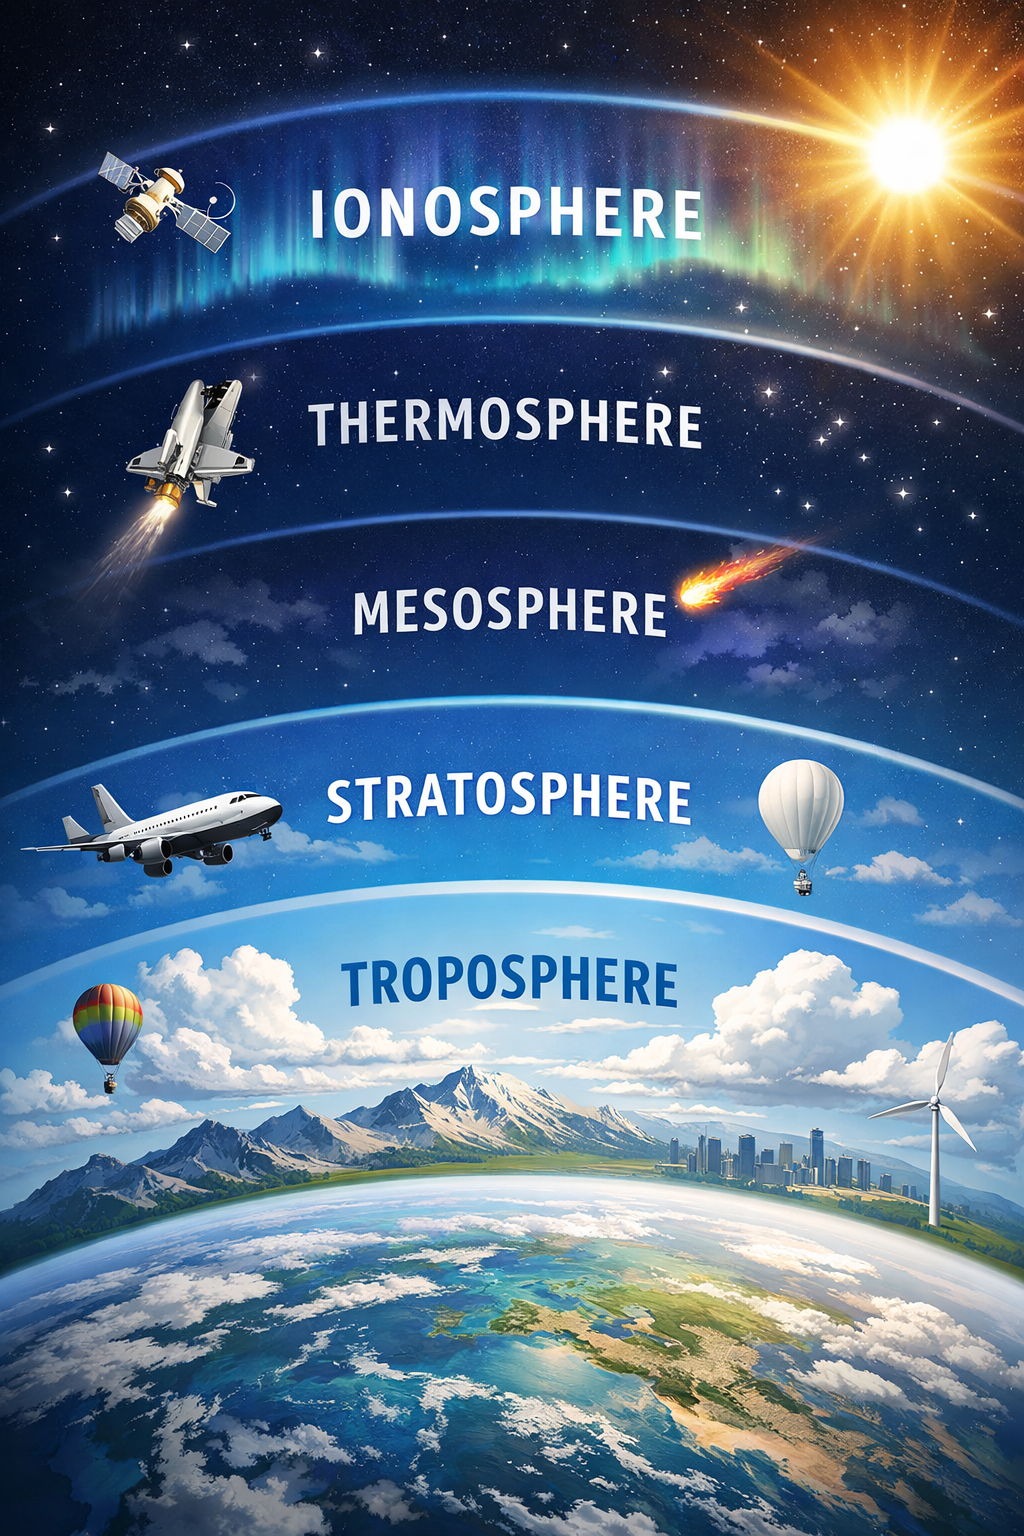
The balloon in the stratosphere is obviously an AI error. :)
Air Pressure
Air pressure is a result of the mass/weight of the air. Because there is so much air above the earth which compresses close to the ground, areas with a lot of air molecues will be created. You can see this as a tower of jenga you played before. The weight of all the bricks pushes on the lower layers of bricks.
On earth we have several high pressure areas and low pressure areas which are an result of temperature differences. High pressure areas always wants to go to low pressure areas, just like when you pump up a tire and let go the vent. The air from the high pressure area inside the tyre will go to the outside, low pressure area.
- In high pressure areas: cold air falls to earths surface, and cold air has more air molecules
- In low pressure areas: warm air from the surface rises, and warm air has less air molecules
So air pressure actually indicates the volume of air molecules in the area. The higher the pressure, the higher the volume of air molecules.
High pressure (H) and low pressure (L) areas are not absolute numbers, but relative to each other. For example:
- 979hPa (L) vs. 1013hPa (H)
- 1013hPa (L) vs. 1035hPa (H)
Air Pressure when elevating
When going up into the air, the air pressure will decrease like seen in the graphic below:
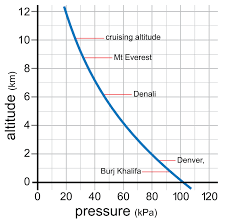
For reference, we will use this numbers:
- Every 30 feet up in the air represents an hPa loss in air pressure
- Example: 1013 hPa on sea level (0ft AMSL) means a mean pressure of 1000 hPa at 390ft altitude
As this is an exponential relationship, this will guide you through the first 10.000ft (3,048km) in altitude, after that this trick does not longer work correctly of course. Some good rules of thumb:
- 5.000ft altitude: 75% (3/4) from ground pressure
- 18.000ft altitude: 50% (2/4) from ground pressure
- 34.000ft altitude: 25% (1/4) from ground pressure
For more information about Pressure and Density altitude, check out: https://justinverstijnen.nl/ppl-theory-nav/
Warmth and temperature (3)
The sun is the engine of Earth’s weather systems. Because the sun radiates its heat onto the Eart, we have nice temperatures. Without the sun, we would live in a mean temperature of around -200 degrees celsius.
The sun radiates its warmth to the earths surface and that will warm up the air above it. This is the main reason why temperature decreases with an altitude increase (going up is going cooler).
For transport of warmth in Earths atmosphere we have different terms:
- Radiation
- Convection
- Turbulence
- Advection
- Conduction
Let’s take a look at them all:
Radiation
Radiation is the transport of warmth using electromagnetic waves. This is mostly sunlight that reaches the earths and uses infrared and UV radiation. Objects and air which absorb radiation will increase in temperature.
Convection
Convection is the vertical transport of warm air caused by the differences in air density. An result of convection is (thermal) updraft, the component of how gliders can stay in the sky.
Convection happens when the layer of air above the earths surface warms up greatly, and this warmer air will rise because of the lower density. Hot air balloons fly because of the principle of convection.
Turbulence
Turbulence contains unorganized horizontal and vertical airmass movements. These are caused by several inconsistences:
- The wind blowing at a certain speed while hitting non-flat objects like buildings and mountains
- Windshears
- Thermal instability
- Fronts
- Jetstreams
Also warm air can move around the atmosphere by turbulence, but the main difference is that in this case, the air density is not the main reason of transport.
Advection
Advection sounds really like turbulence, but then organized and on great scale. Advection is a result of horizontal movement of air by the wind and air pressure differences. Wind and air mass is advection.
Conduction
Conduction is the transport of warmth by using physical contact. A warm object will conduct its warmth to a colder object using conduction. Because air is not a great warmth conductor, this happens the least of all transports but in combination with Convection its measurable.
To summarize all these forms of transport:
| Form of transport | Definition | Memory aid | Dutch translation |
| Radiation | Transport by electromagnetic waves | The sun | Zonnestraling |
| Convection | Transport of vertical warm air | Hot air balloon | Convectie |
| Turbulence | Unorganized movements of air masses | Bumpy airplane ride | Turbulentie |
| Advection | Organized movements of air masses | Clean airplane ride | Advectie |
| Conduction | Transport by physical contact | Wires | Geleiding |
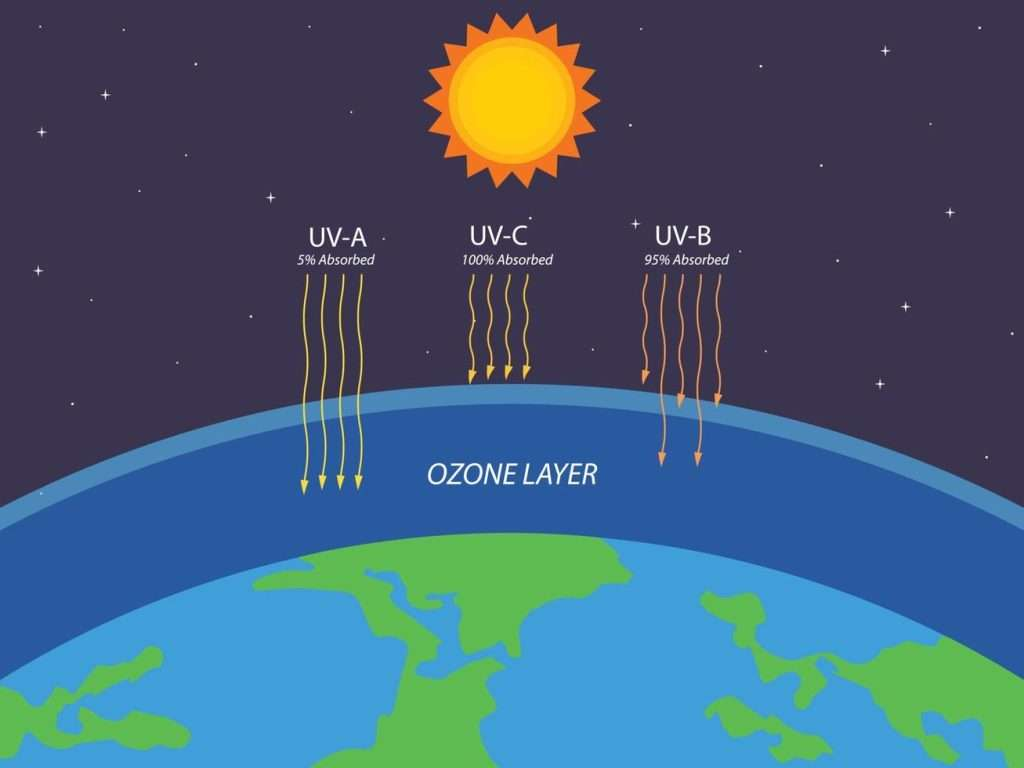
Greenhouse effect (Broeikas effect)
The greenhouse effect is an effect caused by sunlight going through the ozonelayer, which is a layer in the Stratosphere containing water vapor, and heating up the ozone layer.
Moisture in the Atmosphere (4)
In the atmosphere, there is a very small percentage of moisture. This is around 0 to 5% of all the air, mostly a result of water vapor of surface water. The moisture in the atmosphere is the cause of all weather types, like clouds, thunder, fog, mist and thunderstorms.
Water exists in the atmosphere in 3 types:
- Ice
- Water
- Water Vapor
The picture below shows all the phase transitions from ice, to water and or to steam:
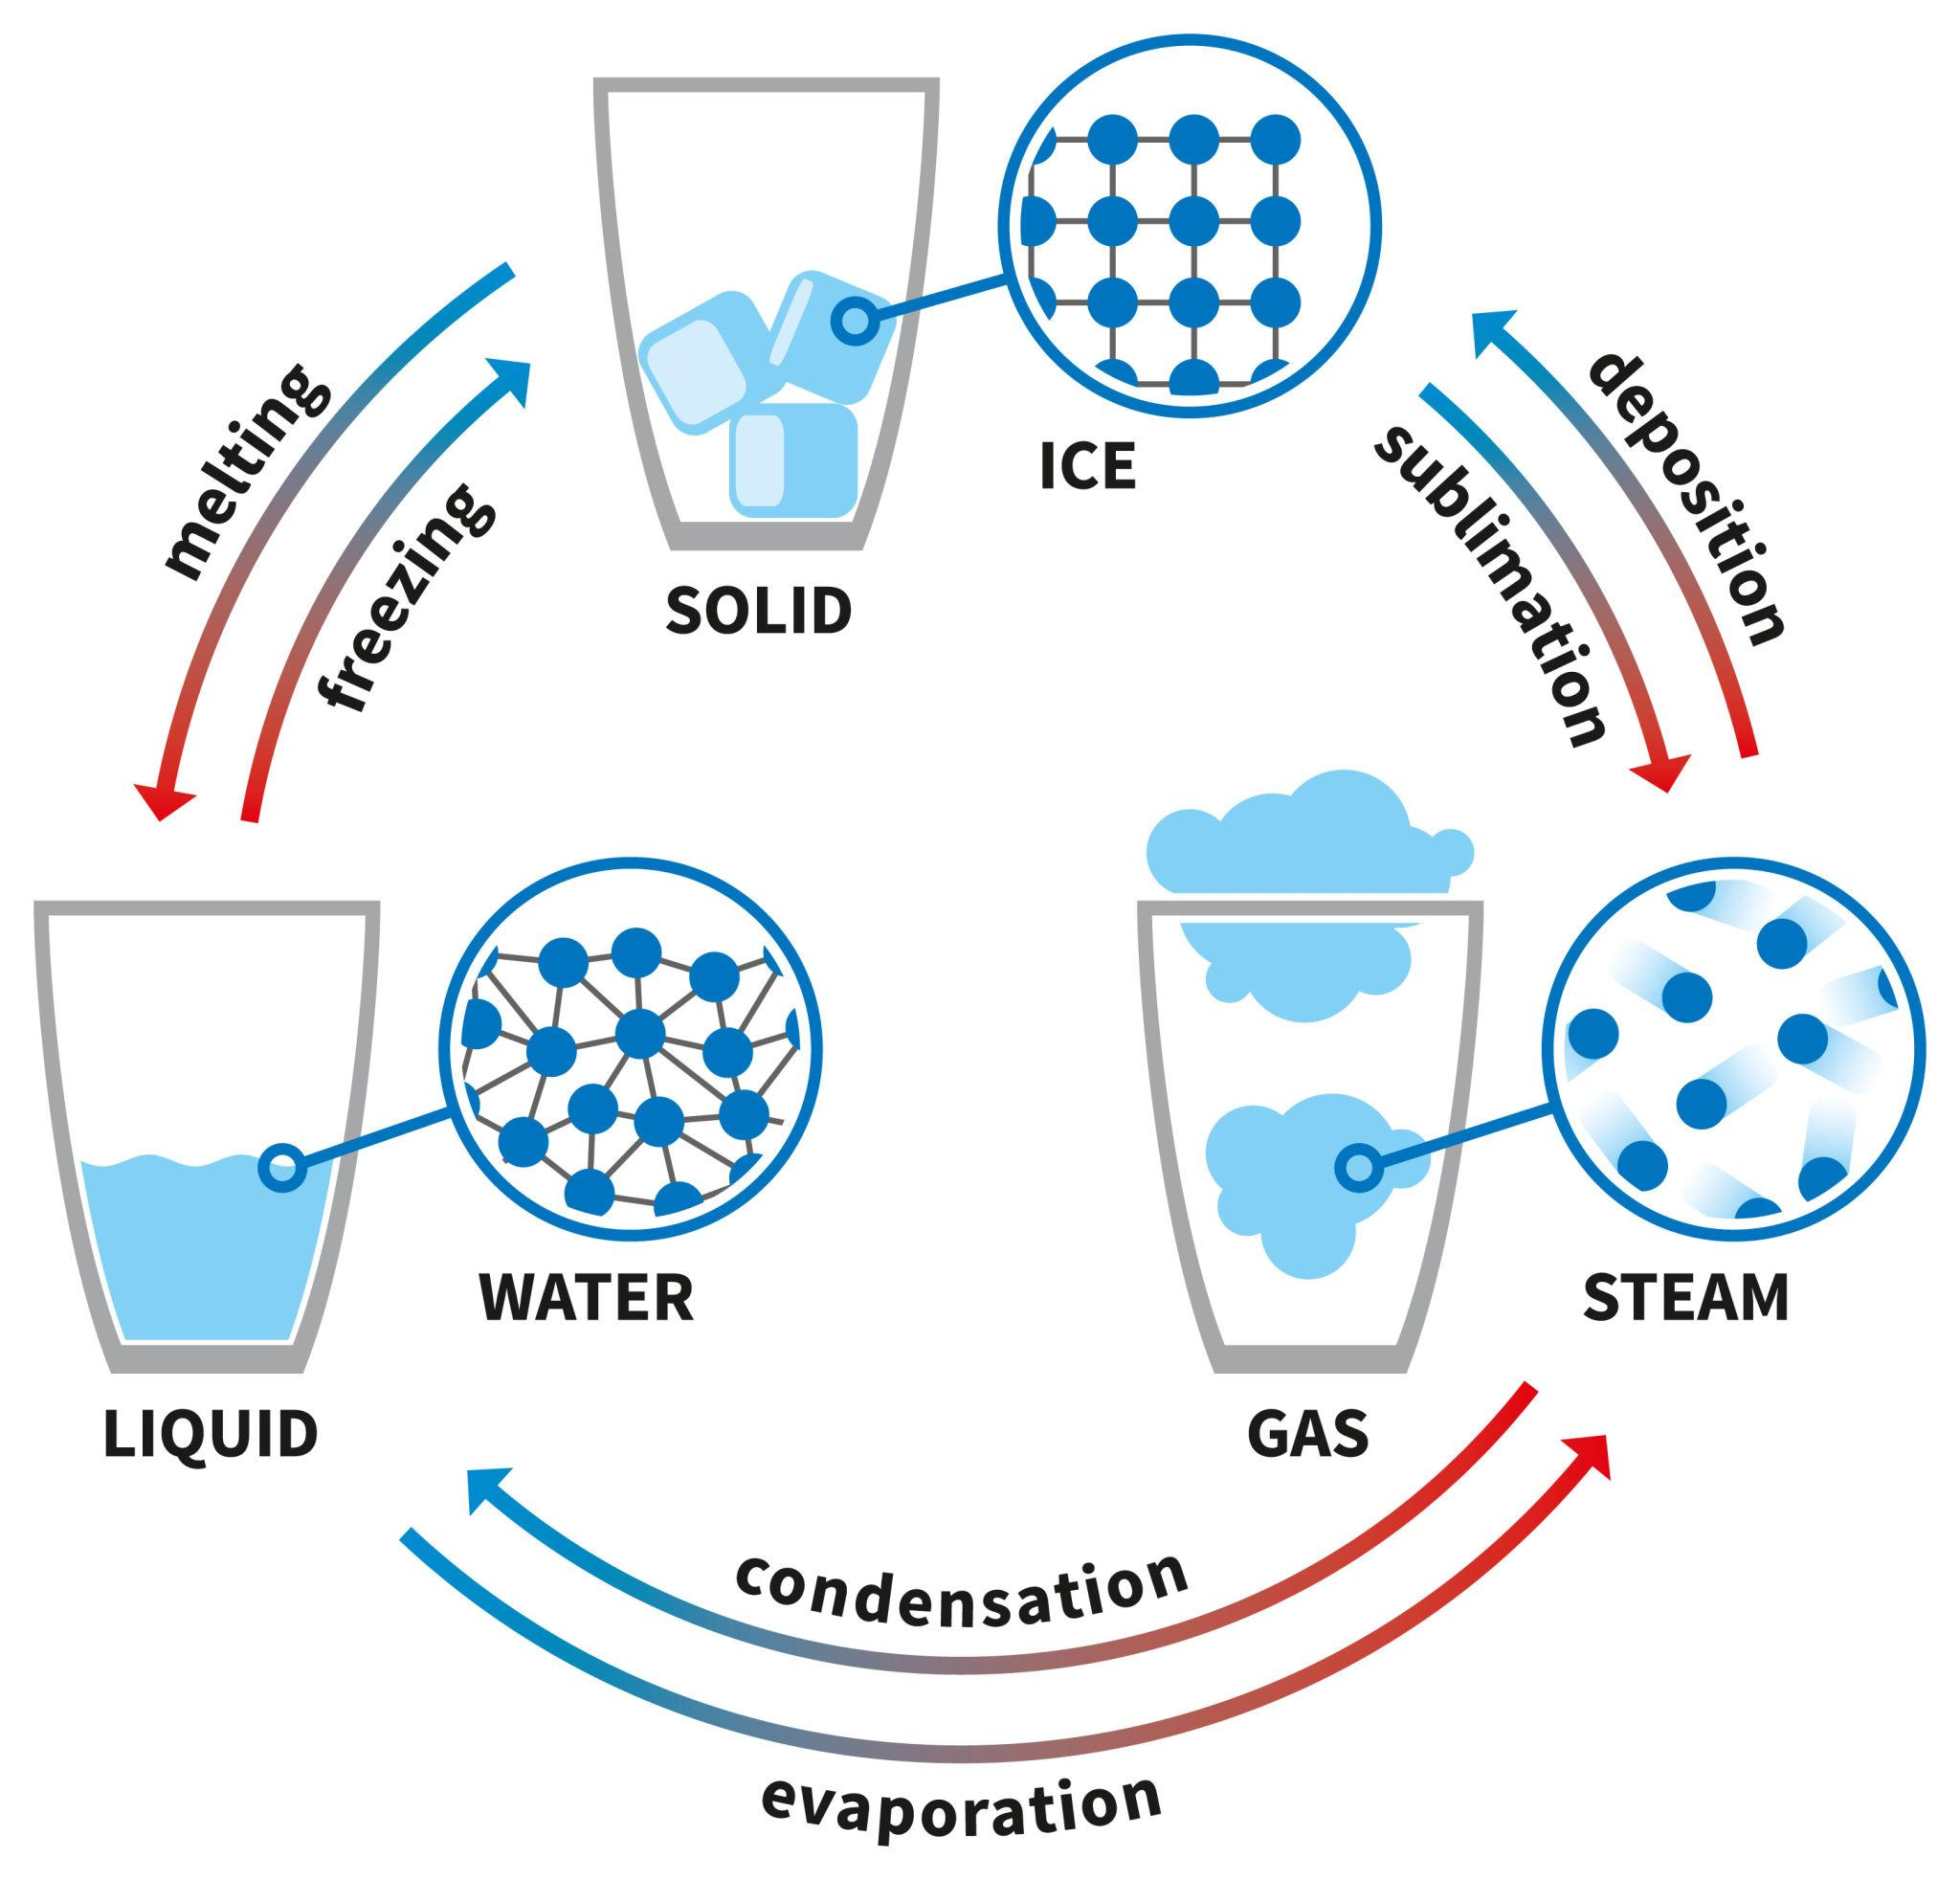
These terms will mean:
- Freezing: a simple one, water (liquid) going to ice (solid) is called freezing
- Dutch translation: Bevriezen
- Melting: another simple one, ice (solid) going to water (liquid) is called melting
- Dutch translation: Smelten
- Condendation: Gas (steam) going to water (liquid) is called condensation. An example is a cold beer just from the fridge which becomes wet at the outside of the bottle
- Dutch translation: Condenseren
- Evaporation: Water (liquid) going to Gas (steam) is called evaporation. An example is a wet t-shirt on a line in sunlight. The water will use the energy of the sun to evaporate.
- Dutch translation: Verdampen
- Sublimation: Ice (solid) going directly to Gas (steam) is called sublimation. An example is a brick of (dry) ice where smoke (steam) will appear from
- Dutch translation: Sublimeren
- Deposition: Gas directly going from its steam form to ice (solid). Examples are ice on your car or plane or the white layer on grass and trees in winter days (rijp)
- Dutch translation: Verrijpen
Easy to remember the terms:
- Freezing happens below 0°C
- Melting happens above 0°C
- Condensation happens when air temperature equals dew point
- Deposition happens below 0°C when air is saturated
- Sublimation happens below 0°C in dry air
- Evaporation happens at any temperature when air is not saturated
Relative Humidity and Dew Point
Warmer air can hold more amounts of moisture. This is because the warmer air expands and is less dense, so more room for moisture. To measure the amount of moisture in the air, we can use 2 methods:
- Relative humidity
- Dew point
Relative humidity
The relative humidity is a percentage that states how much percentage moisture is in the air based on the air temperature. While this is a percentage, it doesnt tell us something clear. This is because:
- 75% relative humidity at 30 degrees celsius will feel very humid and wet
- 75% relative humidity at 3 degrees celsius will feel very dry
This is because the mass of air is filled with 75% of moisture, but a higher temperature means a bigger storage of moisture. A low temperature will hold much less because its more dense. As we actually want to have numbers that tells us everything about the state outside, we have invented the Dew point.
The relative humidity is mostly the highest at night/early morning and lowest at 4 o’clock at noon.
Dew point
The dew point is an second temperature that is determined at the temperature and humidity. IIt tells us the amount of moisture in the air, by a sort of calculation from the actual temperature with an humidity percentage calculated up to 100% where the air is fully saturated by moisture. For example:
- Air temperature 25 degrees celcius
- Humidity is 50%
- At those conditions, the relative humidity is 100% at about 13 to 14 degrees celcius
- 13 to 14 degrees celcius is your dew point
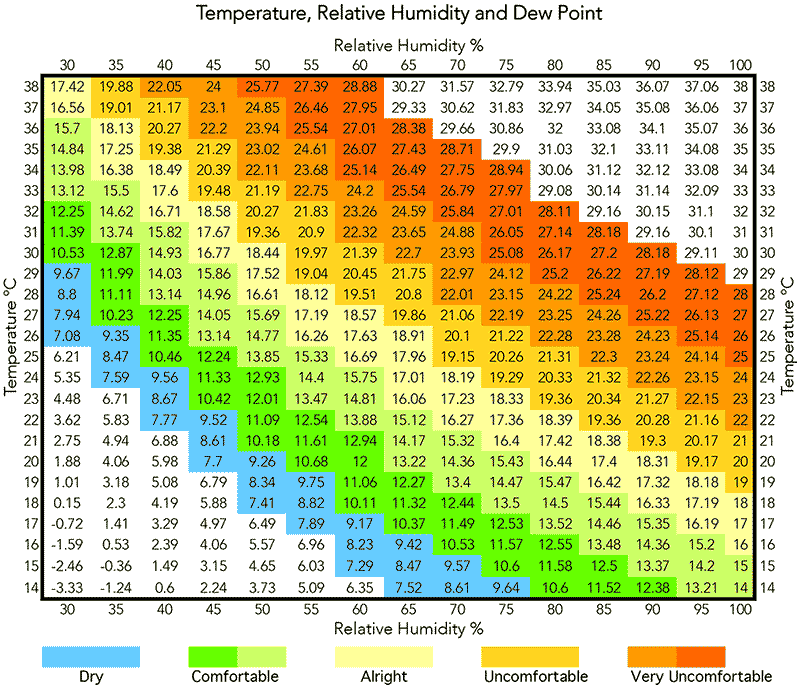
So the dew point tells us much more about the current air condition, and can be used to predict the height of cloud layers. Here I have a table that tells more about air temperatures and humidity and how it will actually feel:
Vapor pressure (dampspanning)
Vapor pressure is the pressure by vapor created by molecules in the air when evaporated. This is indicated in hPa. This is also one of the conditions used to calculate the relative humidity.
Vapor pressure is calculated from air temperature and relative humidity. For example:
- Air temperature: 20 °C
- At this temperature the saturated vapor pressure is about 23 hPa.
- The actual vapor pressure is 16 hPa.
- To calculate the relative humidity: (16/23)×100= ~70%
- Relative humidity = ~70%
Rule of thumb cloud base with Dew Point
We have a rough rule of thumb used in aviation to estimate the cloud base:
Temperature - dewpoint / 2.5 = answer ×1.000 is the cloud base in ft above ground level (AGL)
For example, the air temperature is 25 degrees and the dew point is 7 degrees.
25 - 7= 18 / 2.5 = 7,2 x 1.000 = 7200ft AGL
Vertical balance in the atmosphere (5)
So we have horizontal movements of air masses called the wind, but we also have vertical movements. Vertical movements have also a great impact on the weather. The stability of the atmosphere decides if vertical movements happen or they are suppressed.
Stability
Stability means how the atmosphere reacts when air is pushed up or down vertically. We can have an unstable or stable atmosphere:
- Unstable atmosphere: Air that is lifted keeps rising on its own, which can lead to clouds, showers, or thunderstorms. As long as the air is warmer than its surrounding air, the warm air will rise
- Cloud types: Cumuliform
- Stable atmosphere: Air that is lifted tends to sink back to its original level. Vertical motion is suppressed, so clouds and storms are less likely.
- Cloud types: Stratiform
Adiabatic processes
When a package of air rises, it will flow to an environment with a lower air pressure. The package of air will then expand, which costs a little energy. This energy source is the temperature. Cooling using temperature is called adiabatic cooling.
An adiabatic process is a change in the temperature of air without any heat exchange with the surrounding environment. You can see this as a temperature change within this air package:
- Air that sinks → is compressed → warms (adiabatic warming)
- This will cause the molecules to move faster and results in a temperature rise
- Air that rises → expands → cools (adiabatic cooling)
- This will cause the molecules to move slower and results in a temperature decrease
As long as the air will not be saturated by water vapor, then this will be called a dry-adiabatic cooling. When the air is saturated by moisture, then this will be logically called wet-adiabatic cooling.
- When dry the temperature decrease for every 1000ft in the air will be around 3 degrees celcius.
- When wet the temperature decrease for every 1000ft in the air will be around 1,8 degrees celcius
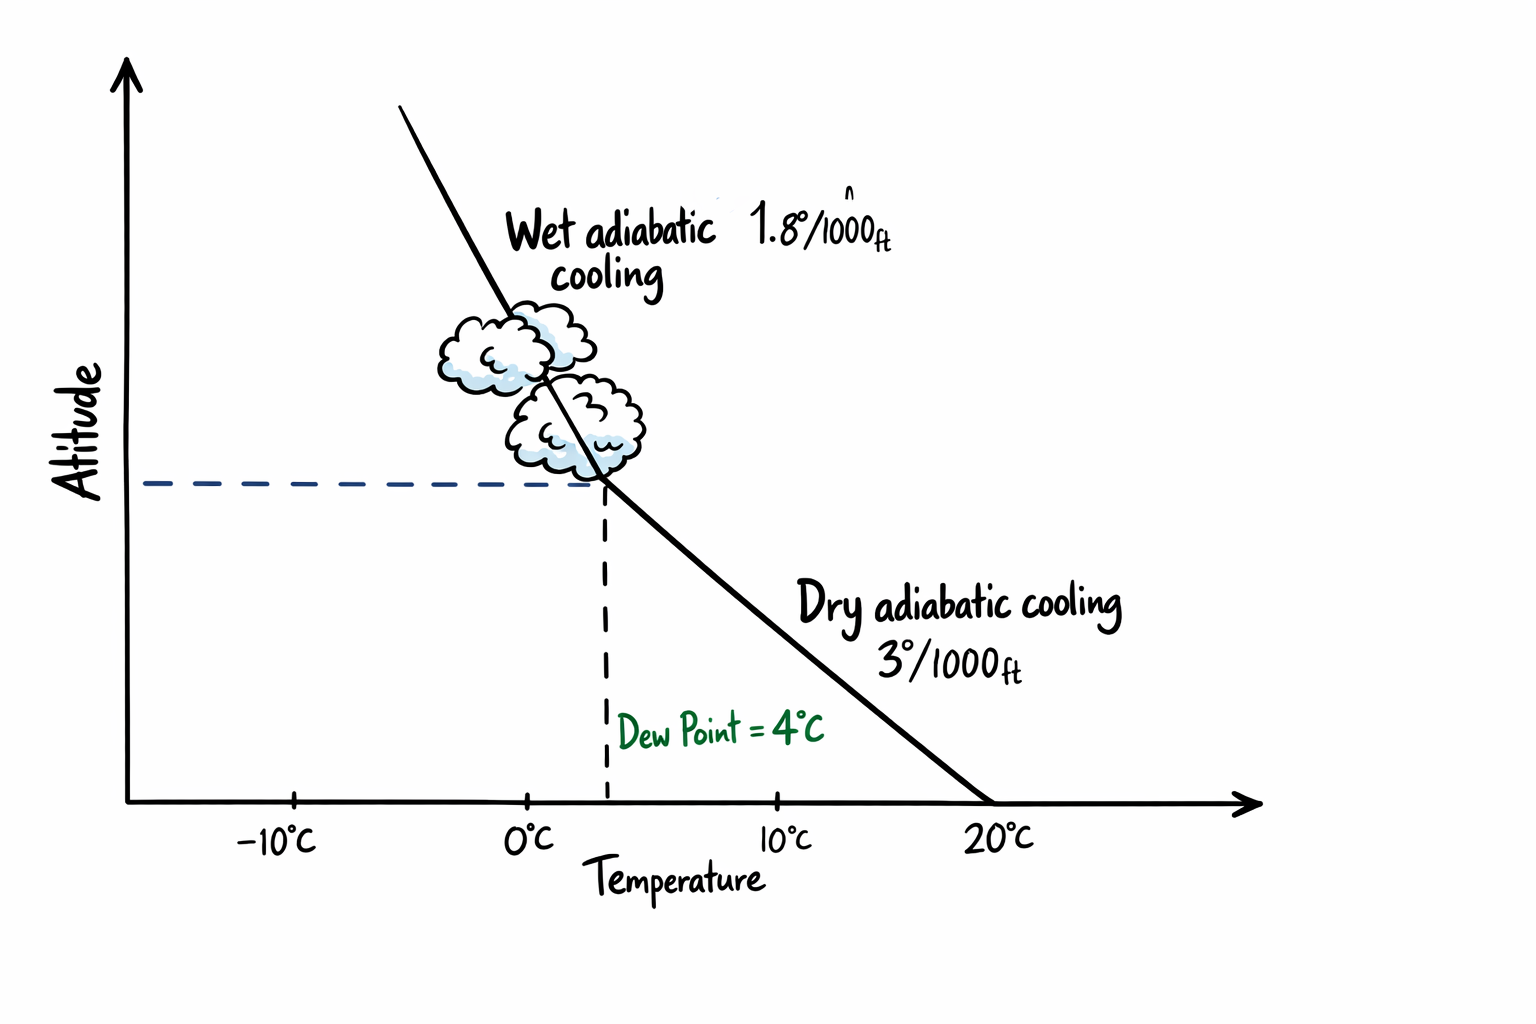
At the moment the air hits the dew point, the air becomes saturated with moist, condenses and a cloud has been born. The cooling rate will also decrease because of the condensing process releases warmth. Check out this moist lifecycle. You can calculate the dew point height with this formula.
Temperature gradient
The temperature gradient is a bit different as ISA describes, because of these adiabatic processes. It can also be that the temperature rises a bit and then decreases every X ft up. This is why we always speak about mean decreases.
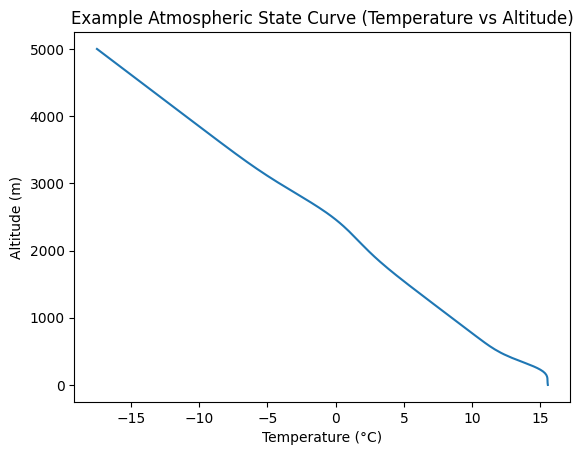
To visualize this exactly, we have something called the “State curve”, the graph of the actual representation of the temperature gradient.
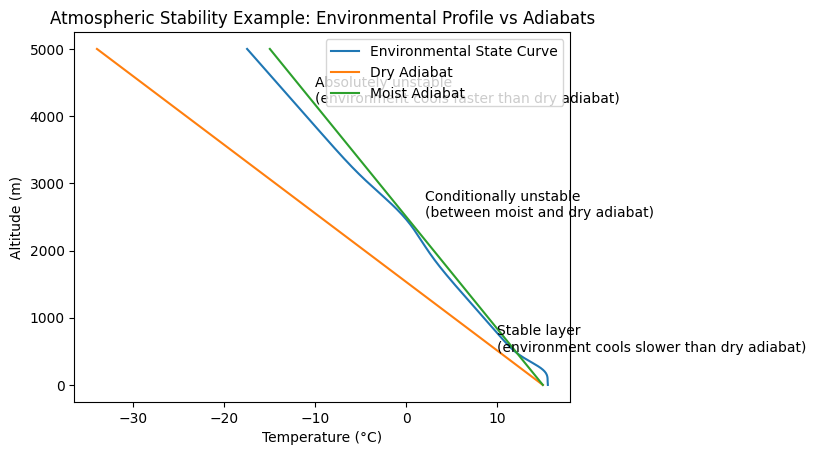
This state curve can present 4 types of stability in the air:
- Absolute instability
- Absolute stability
- Conditional instability
- Indifferential
Absolute instability
When we speak of absolute instability, then the temperature decrease is faster than a dry-adiabatic process. This is as we discussed earlier, more than 3 degrees celcius per 1000ft (1c per 100m). In this situation, the rising air package is warmer than its surroundings, so will continuously rise because of its lighter mass.
Absolute stability
When we speak of stability, the temperature of the atmosphere will cool down slower than a wet-adiabatic process. Here the atmosphere is stable and there is not much air rising. A possible rising package of air will cool down to its environment and will stay in its vicinity.
Conditional instability
In a conditional instable atmosphere, the temperature gradient is between wet and dry adiabatic. Here the air is stable to call it a stable atmosphere but instable enough for a wet-adiabatic process. In the real world, this is the most happening situation.
Processes that influence stability of the atmosphere
We have some processes in the atmosphere that influence the stability, mostly processes that cause warming and cooling.
Radiation inversions
The radiation inversion is when the sun heats up earths surface and the directly layered air. In the evening, the air cools down at earths surface but the air above the surface stays a bit warmer. This causes instability and is the reason fog starts at the ground in the winter/spring mornings. Basically a temperature increase in the temperature gradient, after the inversion, the temperature will decrease per ISA conditions.
Right above an inversion, the wind speeds can drastically change, as the atmosphere is a bit more unstable above the inversion.
Advection
Advection, which is horizontal transport of air, alters the stability of the atmosphere. This will do it in these ways:
| Stability | Cold surface and warm air |
| Instability | Warm surface and cold air |
The main causes of this are that a cold surface will cool the air above it. With a warm surface, the air in the lower areas will warm up, and warm air will tend to rise. This creates convection and if the air contains enough moist, clouds and precipitation.
General circulation and pressure systems (6)
The movements in the atmosphere are primarily caused by pressure differences, which are caused by temperaturedifferences. In the tropical region, there is a lot of sun during the year and gets a lot more sun than the artic regions. This creates a static pattern of air movements which is called the general circulation.
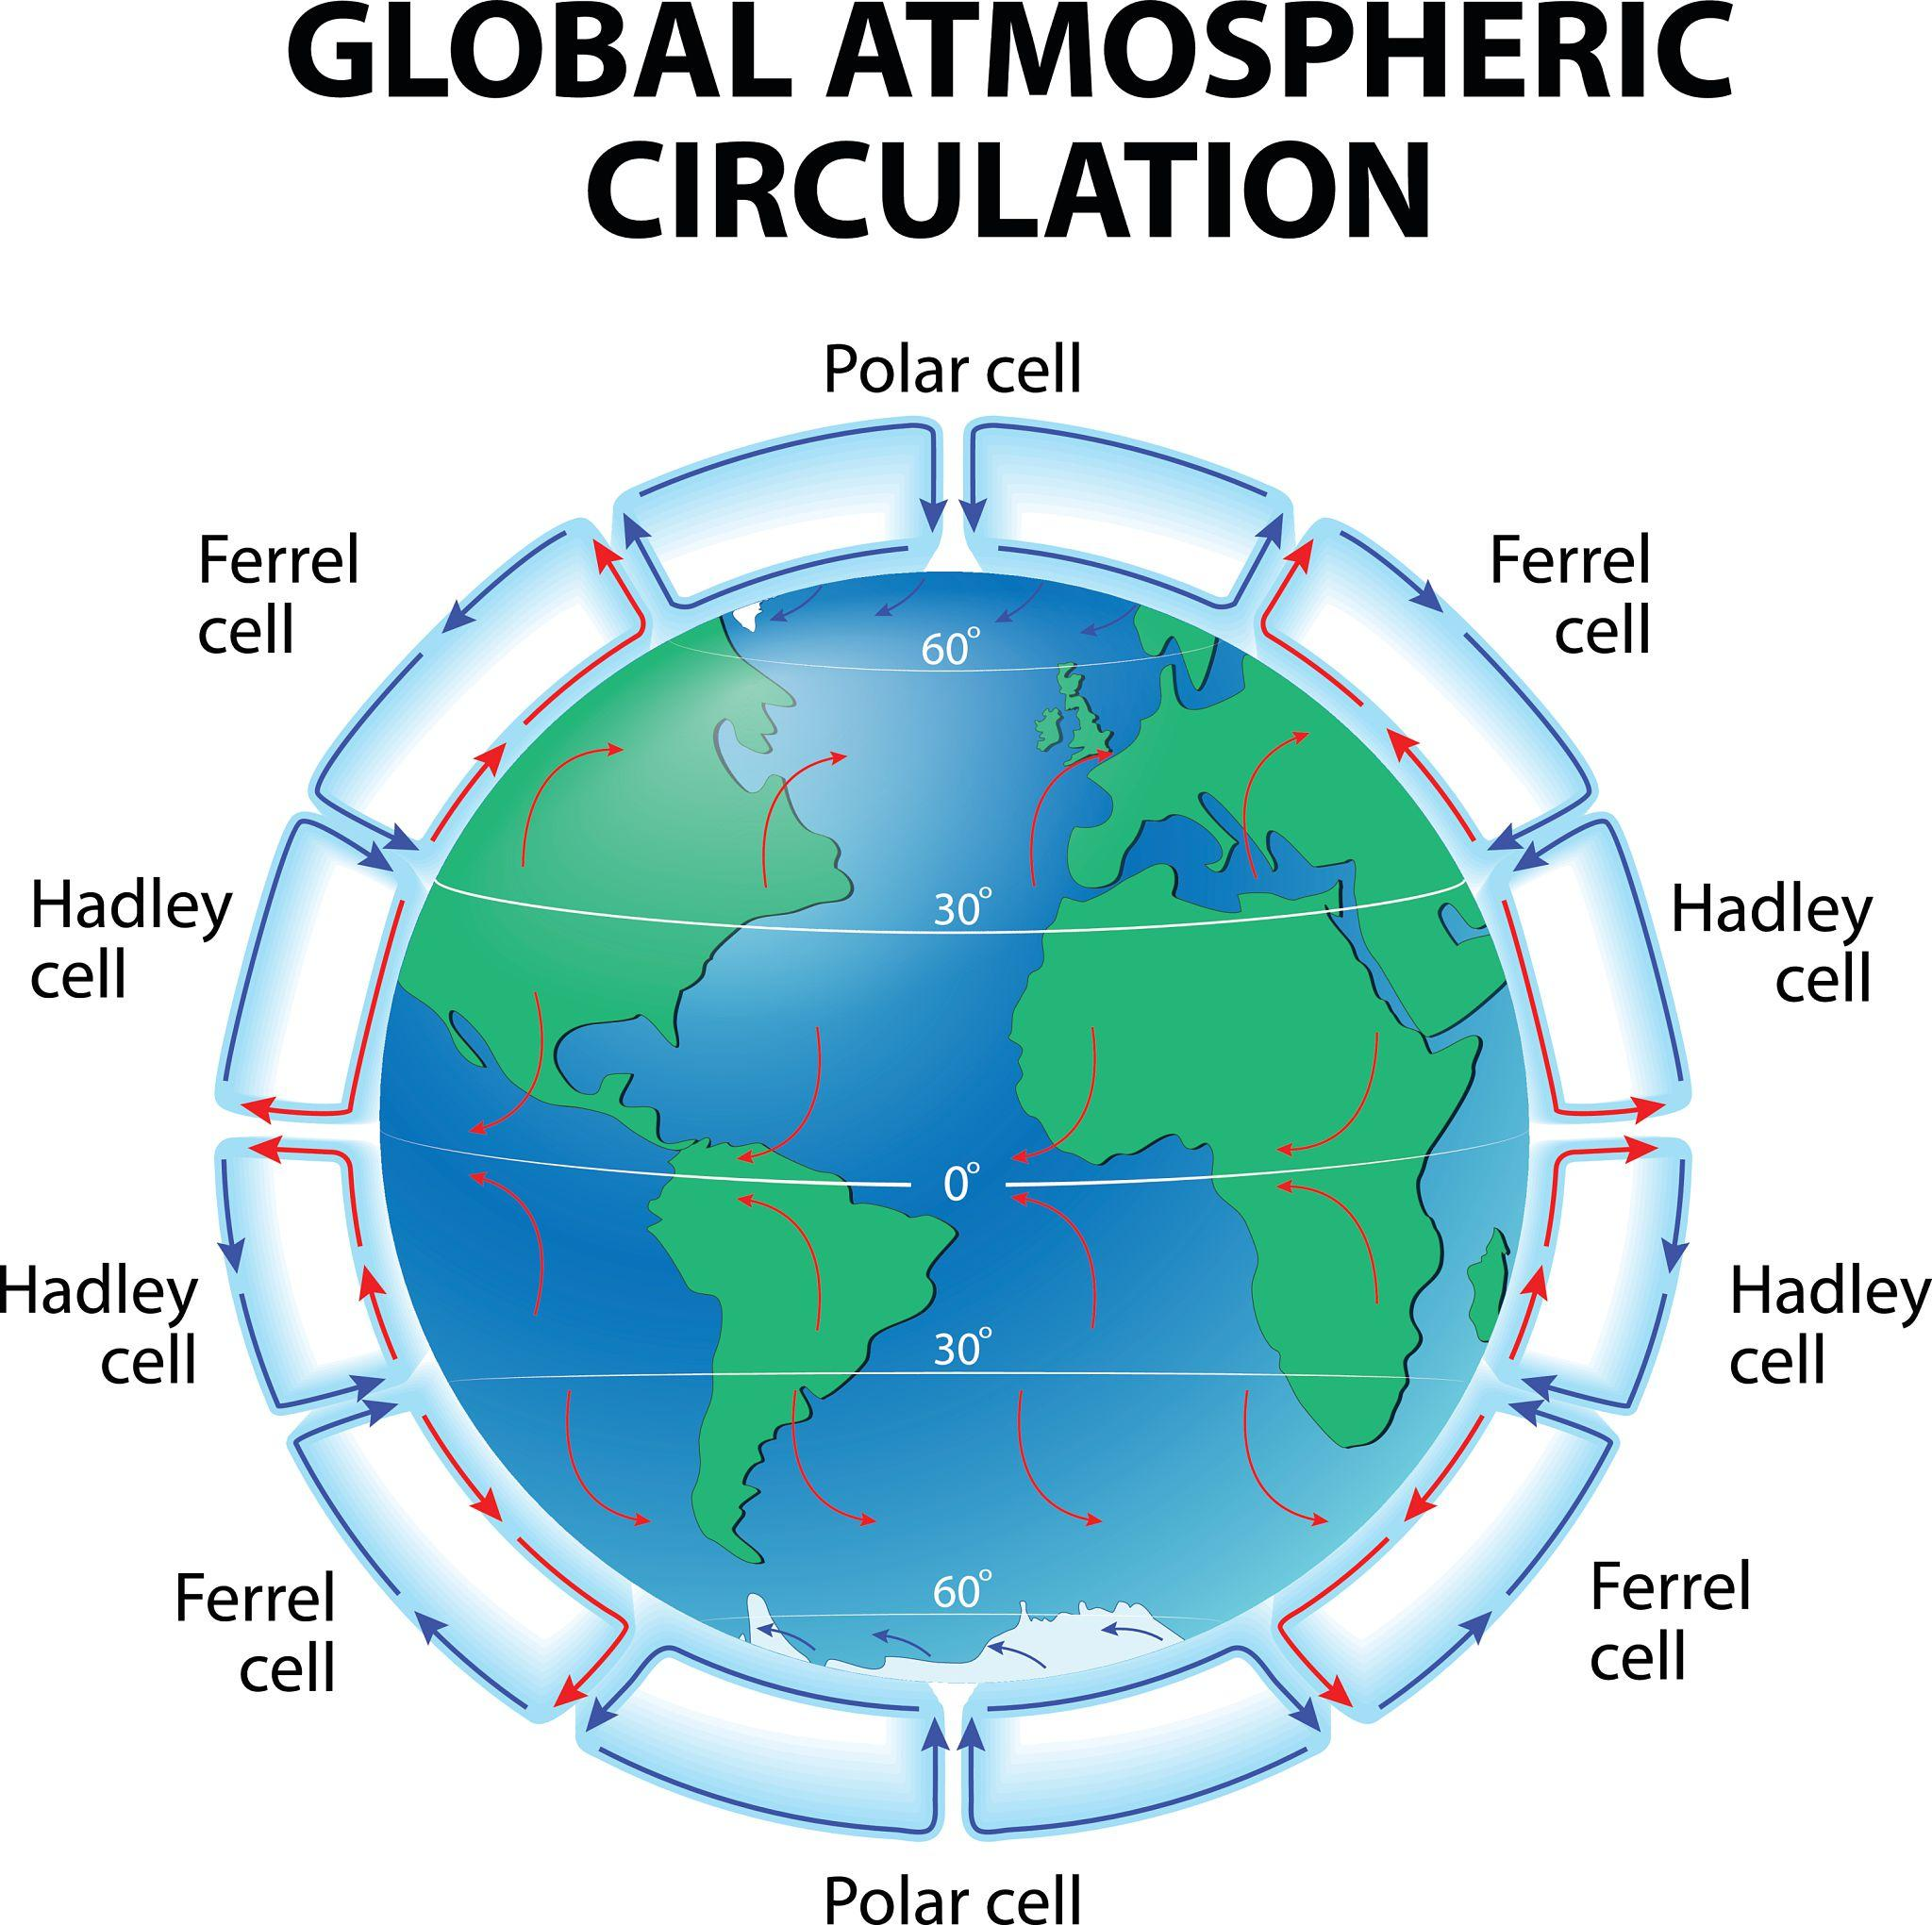
At the equator, the strong sun radiation will cause rising air, and the pressure at the ground decreases. In this ring of low pressure, called the intertropical convergention zone (ITCZ), warm moist air will rise and flows at great altitude to the north and south. After cooling and becoming dry, this dry air falls back to earth at the subtropicals, which are around 30 degrees north and south latitude. This is the line of the Saharas, canaries.
On every half of the glode, there are 3 vertical cells as seen in the picture above. We also call them circulation patterns. These patterns are there all the time, all year.
Air pressure systems
The air pressure at all places around the world is measured by weather stations. Some offices will link all those fields to each other to create a pressure map of the world. Because all weather stations have a different elevation to the mean sea level (in ISA 1013 hPa), this pressure will be calculated to this mean sea level, based on the current conditions. This gives us a new Q-code, the QFF.
- QFF: Actual atmospheric pressure calculated back from ground to sea level
- QNH: Sea level pressure using ISA, where on sea level the altitude should be “0”.
- QNE: QNE is when we set 1013 on our altimeter. Basically the pressure altitude, which we use to fly Flight Levels
- QFE: Actual pressure on the field, being 1000ft above ground level means actually 1000ft in the air
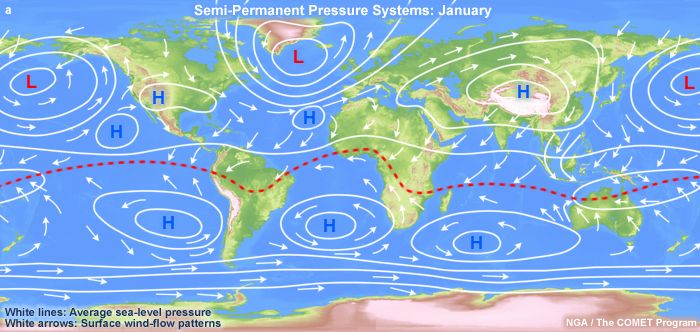
As we can see on the map, the world contains a lot of low and high pressure areas. The “H” or “L” is pointed at the center, or the highest or lowest pressure point of the area.
The curved lines you see are Isobars, which are lines with matching air pressure. The dutch KNMI will use an interval of 5hPa for these lines.
High pressure area outline
A High pressure area always have a ridge (rug) which is a extension of the high pressure area and looks like this:
Low pressure area outline
A low pressure area has a trough (trog) and means the extension of the low pressure area, again where the center of the areas at the “L” represents the area of lowest pressure:
Cols
A col (zadelgebied) is an area that is surrounded by multiple high or low pressure area’s. In this area’s the pressure differences are small. In the chart below, we could see some cols :
- Argentina
- Around Los Angeles
- South Africa
- Japan
Being in a col, you can expect light and variable winds, as the air of the pressure area’s want to go to the lowest pressure area.
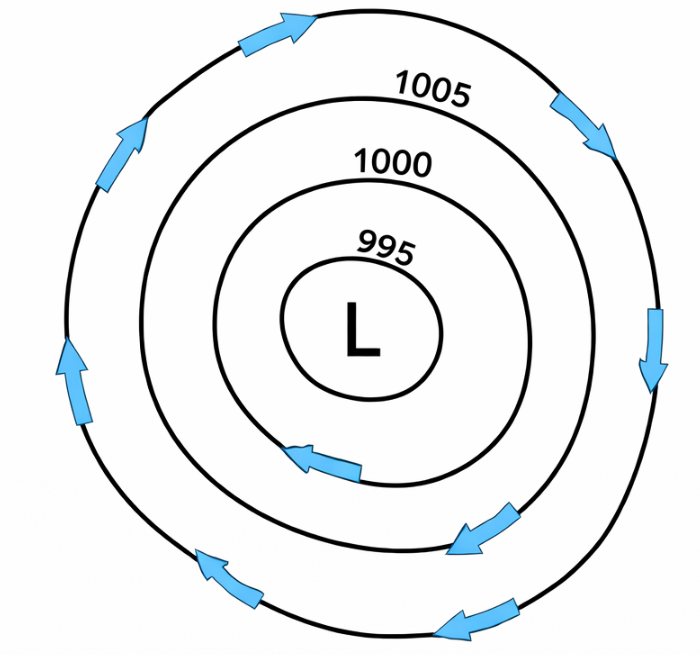
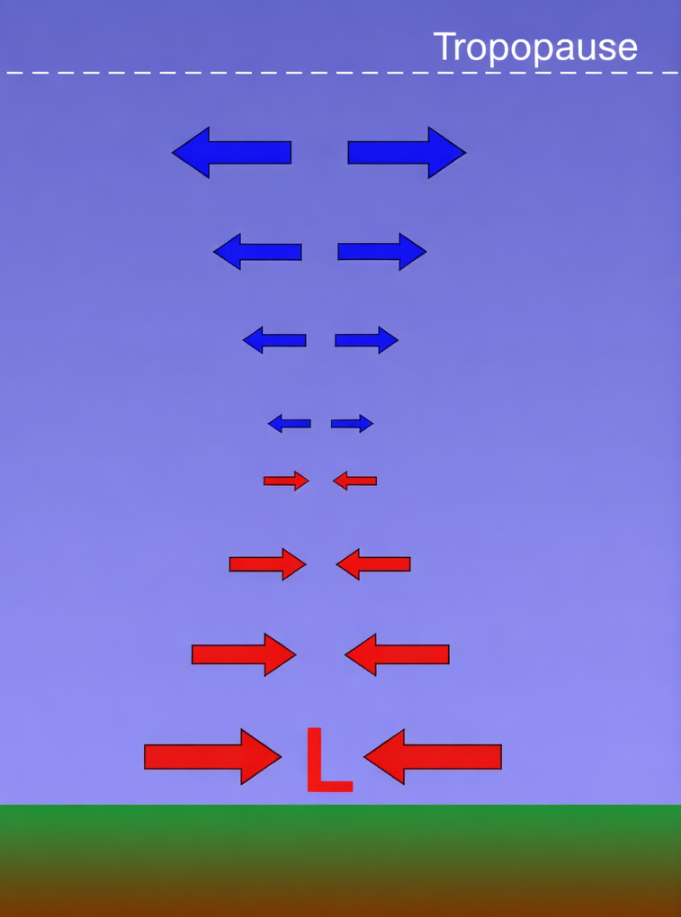
Low pressure areas defined
A low pressure area is an area with closed isobars where at the center is the area of the lowest air pressure. A low pressure area can occur where in the higher atmospheric layers divergence takes place. This means that the air compensates and starts a vertical airflow from the ground up to the tropopause. This will cause the pressure at the ground to lower as the air molecules rise up. The rising air cools down and condensation will happen what causes clouds and precipitation.
A result of the lower air pressure is, because high pressure areas will always flow to low pressure (bicycle tire), that at the ground the air will move to the center of the low pressure area. This process is called convergence.
Other words for low pressure area’s are:
- L
- Depression
- Cyclone
- Minimum
At the globe, the movement of air in a low pressure area can defer:
- At the Northern Hemisphere (0 to 90 degrees north latitude), the air will move counter clockwise
- At the Southern Hemisphere (0 to 90 degrees south latitude), the air will move clockwise
This circulation is called cyclonal, as it rotates the same way of a cyclone (which rotates counter clockwise at the northern hemiphere)
The cause of this difference is the Corioliseffect, a result of the globe which rotates. Air wants to go in a straight line from H to L, but as the earth rotates, these paths are curved. This is also visible at the chart above.
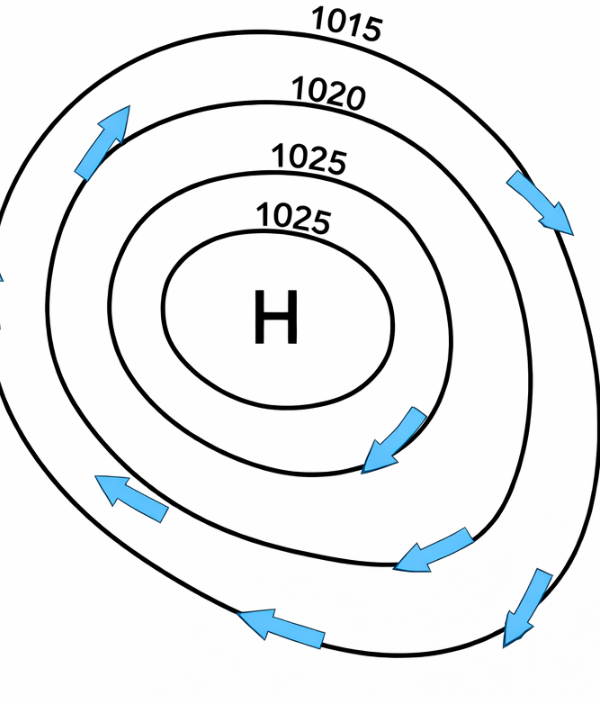
High pressure areas defined
In an high pressure area the pressure at ground level is higher than in the direct area. High pressure areas occur in the general circulation like the Azores islands (West to Spain). High pressure areas can also occur above a cold ground mass. This is called a thermal high pressure area. As the atmosphere cools down, the colomn of air will shrink and air will converge at high altitude. This makes the mass of air heavier and the result of this is the mass of air falling down (subsidence) to the ground. A high pressure area is now born.
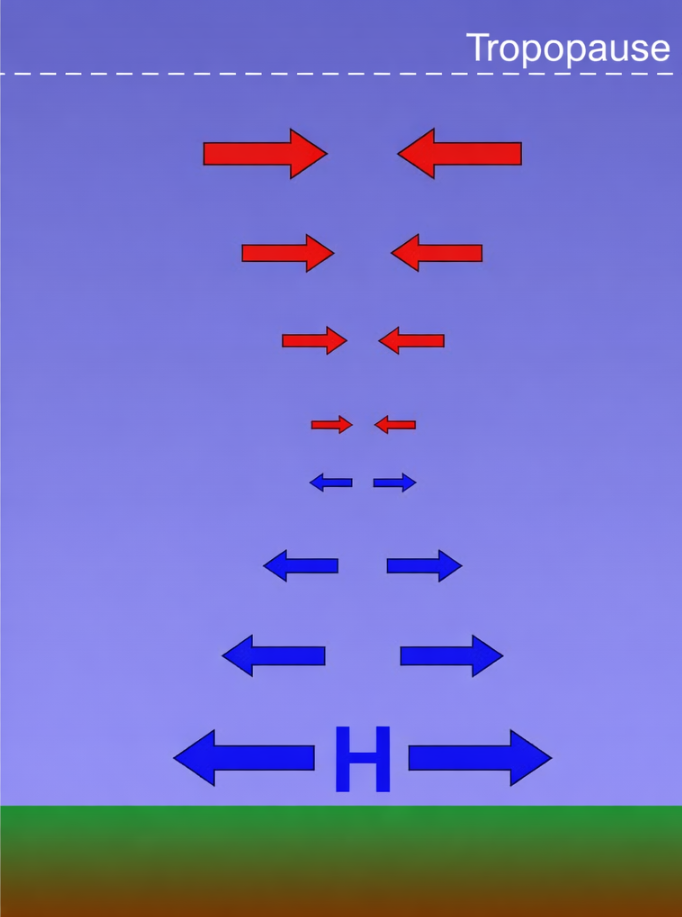
During subsidence, the falling air will heat up and will clear out clouds. Generally there is better weather in a high pressure area than there is in a low pressure area, but this is no warranty.
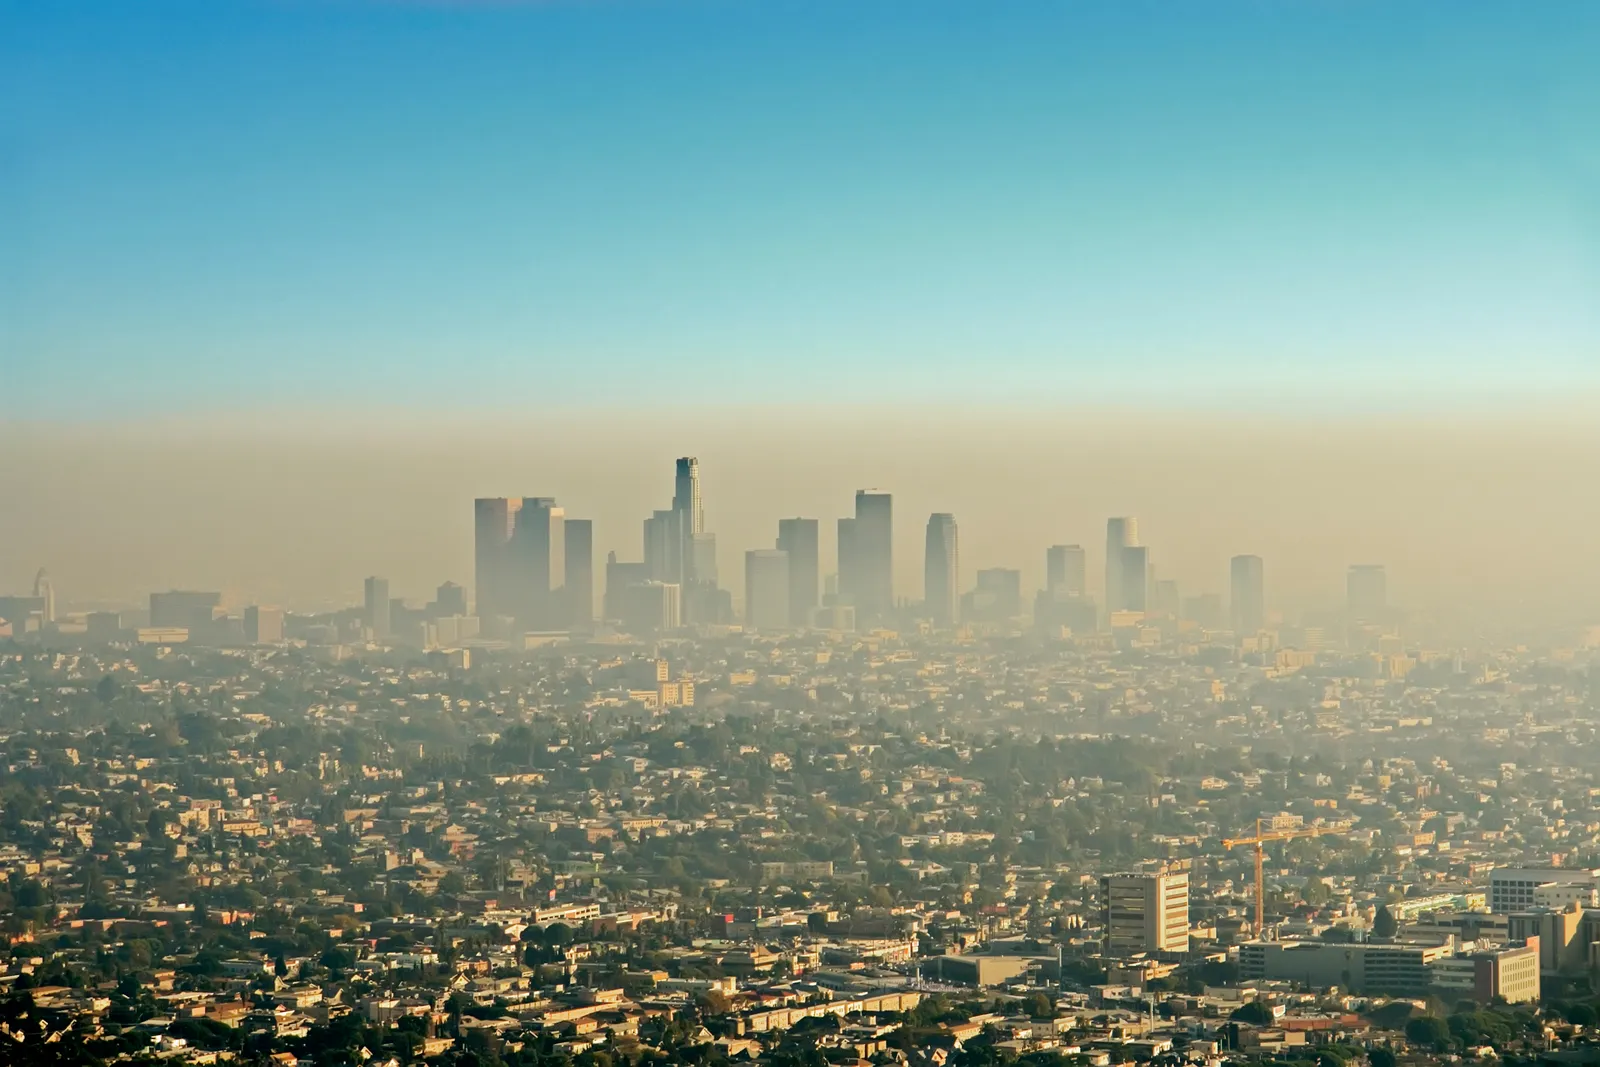
Subsidence can also cause an inversion, which happens a lot. The inversion will stabalize the atmosphere, stopping the vertical movement of air. The result is that water vapor, dust, sand or other air-pollution can not go anywhere and hangs at low altitude. A great example is haze or smog in big cities with warm weather during a high pressure area:
At the globe, the movement of air in a high pressure area can defer:
- At the Northern Hemisphere (0 to 90 degrees north latitude), the air will move clockwise
- At the Southern Hemisphere (0 to 90 degrees south latitude), the air will move counter clockwise
This circulation is called anti-cyclonal, as it rotates the opposite way of a cyclone (which rotates counter clockwise at the northern hemiphere)
Winds (7)
Wind is the horizontal movement of air, caused by air pressure differences around the globe. We get air pressure differences because of temperature differences, where warm air expands and cold air contracts. Warm air causes the air pressure to become less as there are less air molecules per cubical meter and cold air causes the air pressure to become higher as more molecules will be there.
The wind is always measured in the direction where the wind comes from. In aviation we use a degrees measurement, where the number is always rounded to the closest interval of 10.
- A northern wind means the wind blows from north to south, and the wind will come from 360 degrees (we don’t count “0”.)
- A south western wind means the wind blows from the south west to the north east and wind will come from 230 degrees
The windspeed is measured in knots which represents the amount of nautical mile per hour. The wind measured is a mean wind direction over a period of 10 minutes. With small winds, 3 knots or even lower, this could be indicated as “variable”. Gusts are momentary and more powerful forces of the wind and are indicated at the METAR if 10 knots or more above the mean windspeed.
We also have wind power indications, which are based on the beaufort scale but is not used in aviation as its not linear and not precise enough as you can see here:
| Beaufort force | Description | Wind speed (km/h) | Wind speed (knots) |
|---|---|---|---|
| 0 | Calm | 0–1 | 0–1 |
| 1 | Light air | 1–5 | 1–3 |
| 2 | Light breeze | 6–11 | 4–6 |
| 3 | Gentle breeze | 12–19 | 7–10 |
| 4 | Moderate breeze | 20–28 | 11–16 |
| 5 | Fresh breeze | 29–38 | 17–21 |
| 6 | Strong breeze | 39–49 | 22–27 |
| 7 | Near gale | 50–61 | 28–33 |
| 8 | Gale | 62–74 | 34–40 |
| 9 | Strong gale | 75–88 | 41–47 |
| 10 | Storm | 89–102 | 48–55 |
| 11 | Violent storm | 103–117 | 56–63 |
| 12 | Hurricane force | 118+ | 64+ |
You could ask yourself why we measure and indicate the wind like this. If the wind blows to the north, it would be easier to say northern wind. In aviation we want to take-off and land our aircraft from a certain runway and favorite a runway with headwind (not with tailwind). This runway has a number corresponding to the magnetic course/direction it points at. By indicating the wind like this, the number is liked pretty much to the wind direction.
For example:
- If we have runway 18/36, and the wind comes from 310 -> Our favorite direction is 360 (RWY 36)
- If we have runway 09/27, and the wind comes from 330 -> Our favorite direction is 270 (RWY 27)
Taking off and landing with headwind (tegen de wind in) increases our true airspeed and decreases our ground speed, making those maneuvers a lot easier as we have less speed according to the ground.
Wind can do veering and backing, which both have a certain definition:
- Veering: The wind direction changes clockwise (ruimen)
- Backing: The wind direction changes counter clockwise (krimpen)
This will actually say nothing about the wind speed, only the direction.
Coriolis-effect
The coriolis effect is a result of curvy winds as result of the rotation of the earth. This effect has the most presence at the poles and the less at the equator. This happens as air travels to the poles, but the turning speed there is much slower than on the equator.
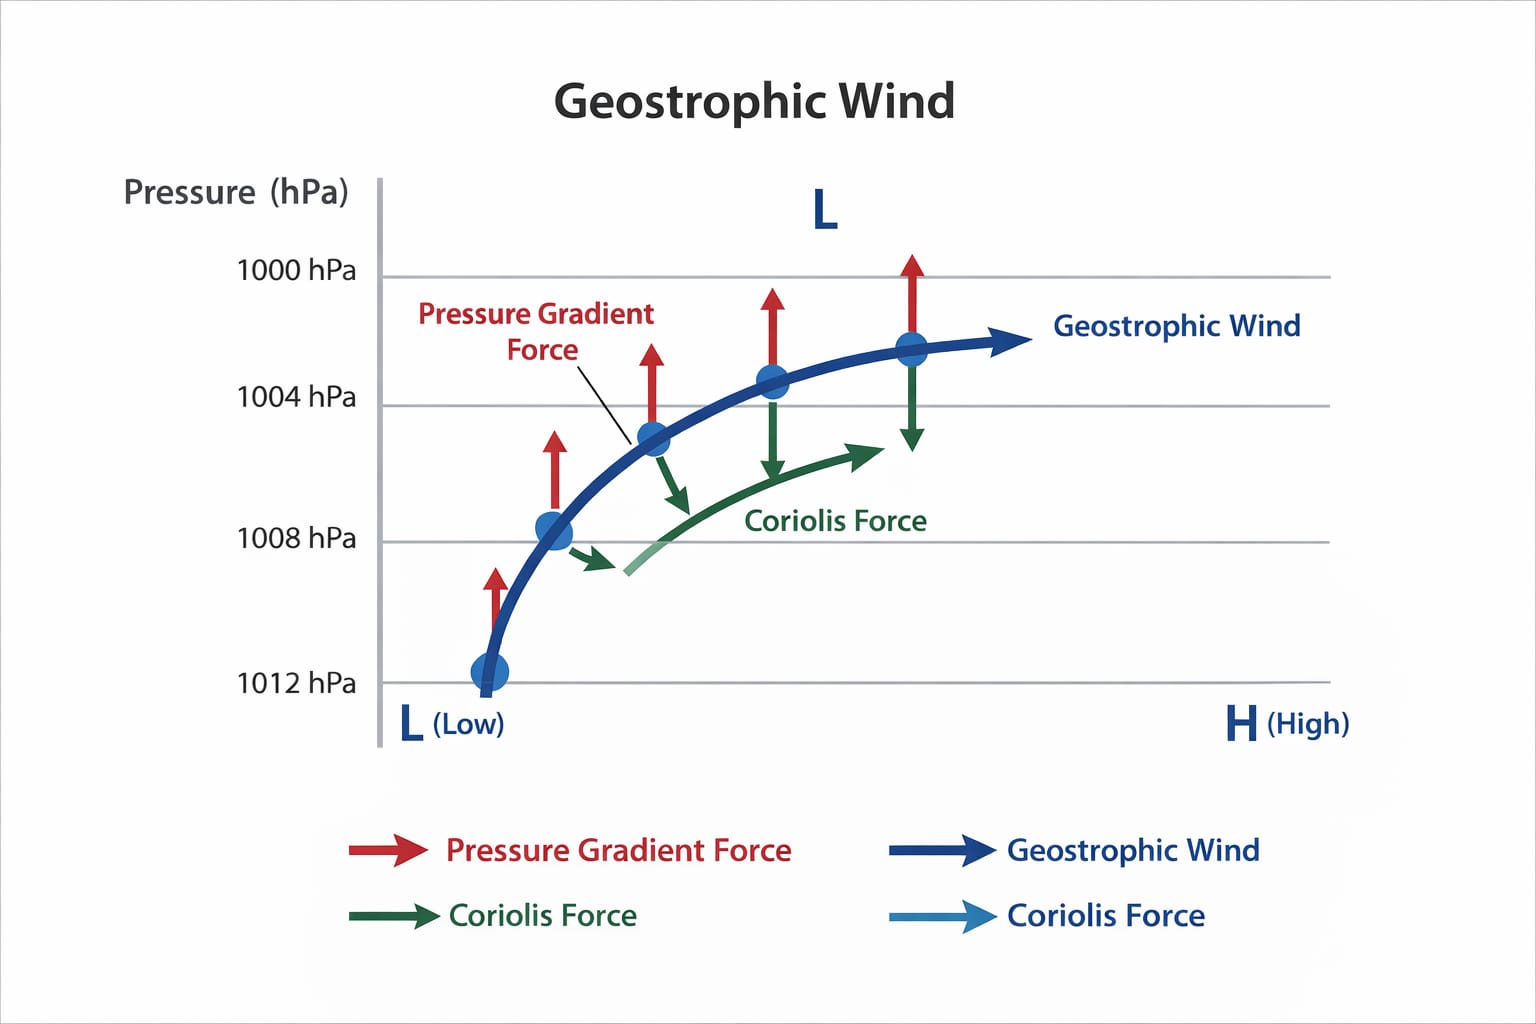
- Cause: The Coriolis force is caused by the rotation of the Earth. Moving air appears to be deflected because the Earth rotates beneath it.
- Direction of deflection
- Northern Hemisphere → deflection to the right
- Southern Hemisphere → deflection to the left
- What it affects The Coriolis force does not start motion, it only changes the direction of moving air.
- It acts perpendicular to the direction of motion and increases with wind speed and latitude (stronger near the poles, zero at the equator).
Winds in High Pressure areas vs Low pressure areas
In this illustration, we can see several different details here about winds and high/low pressure areas. We will look at all details applying to the northern hemisphere. In the southern hemisphere, all details are reversed.
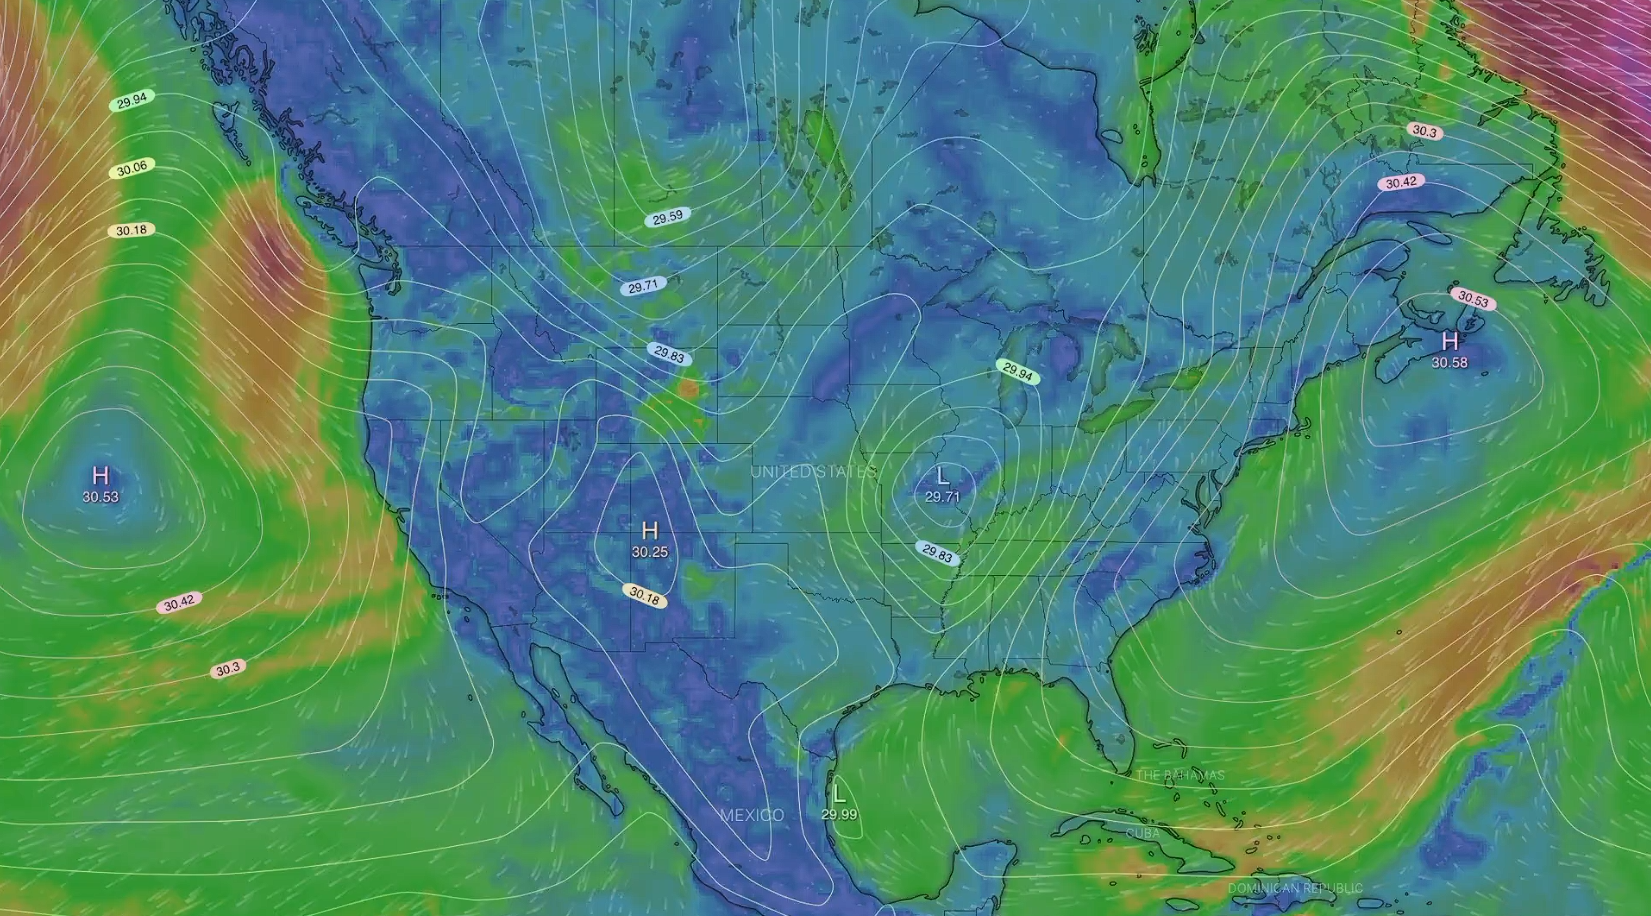
This tool is called Windy.
- Winds in a high pressure ares rotate clockwise from the center out
- Winds in a low pressure area rotate counter clockwise to the center
- Winds blow parralel to the isobars at altitude, on ground this will back (krimpen)
One fact applying to the whole earth is that areas with isobars close to each other represents areas of high wind speeds. Just look at cyclones which are a low pressure area (the L south west of Iceland):
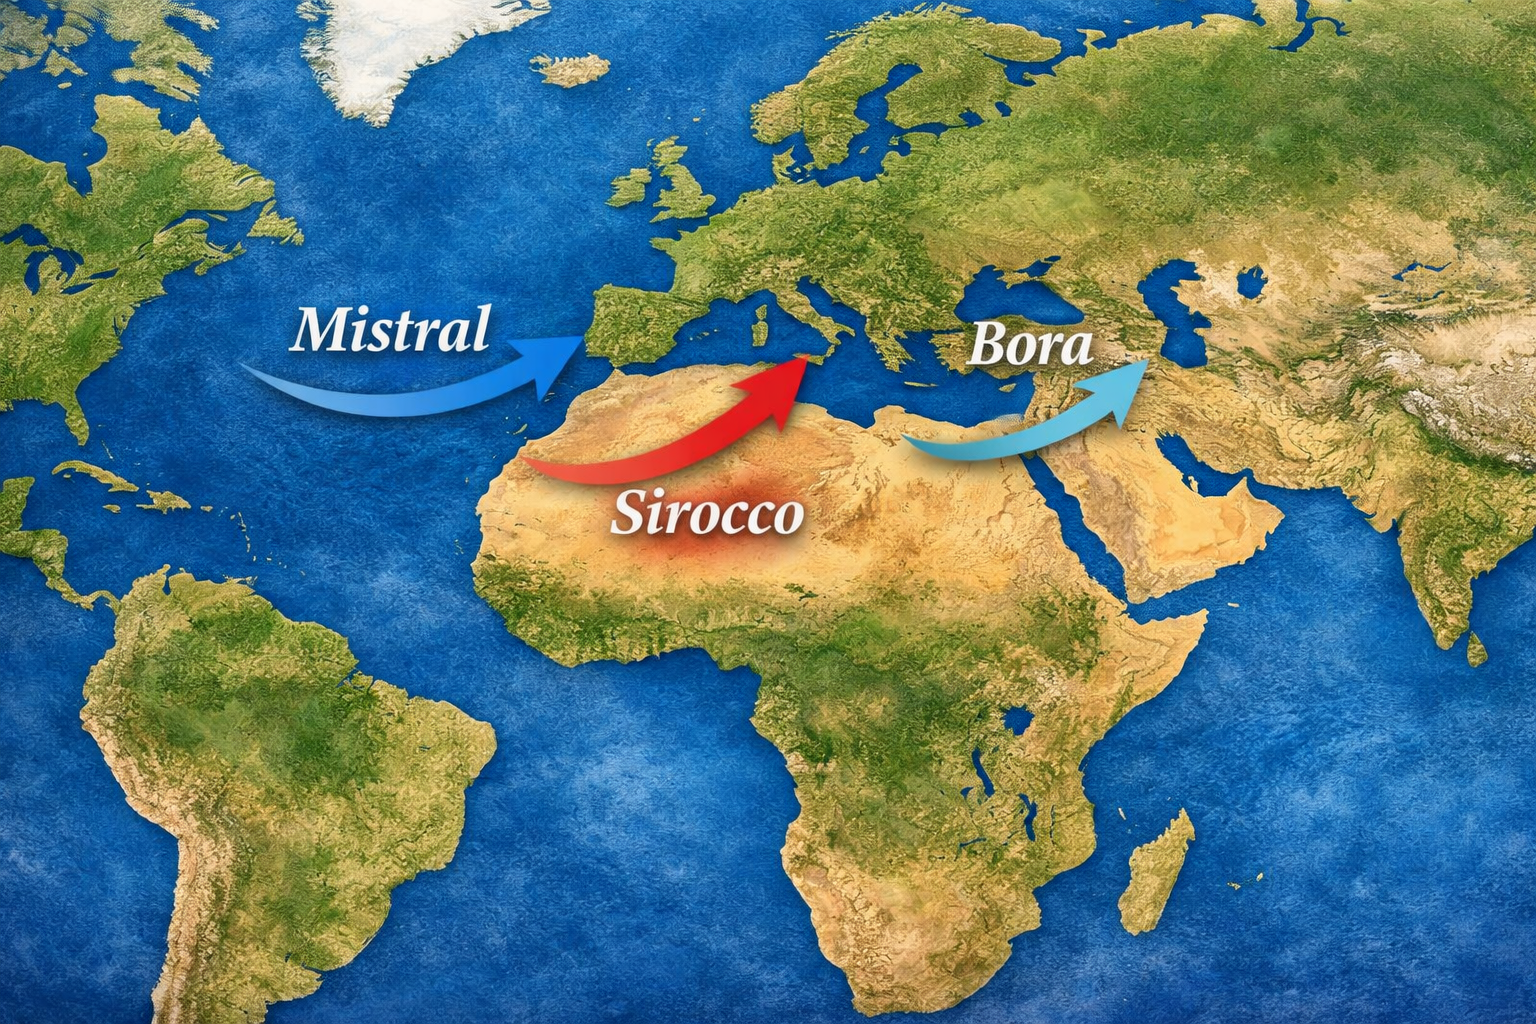
Massive wind patterns
Around the earth, we have various wind patterns that are happening on recurrence. We know art least three of them:
- Mistral: Powerful, cold and dry wind happening with cold polar air
- Sirocco: Southern wind, wet and warm mostly during the spring months
- Bora: Powerful cold and dry wind, mostly in the winter months
Fun fact, now you know where car brand Volkswagen got their names from :)
Small circulation patterns
We also have some small circulation patterns of the wind because of small geographical situations. Think of these situations:
- Sea and land-wind circulations
- Mountain and valleywind
- Fohn
- Mountain waves
- Venturi-effect
We will now describe them all and look at their characteristics
Sea and land-winds
Seawind circulations occurs when a big temperature difference exists between sea water and land. The sun will heat up land way faster than sea water and the temperature above land will increase faster. Above land, the air will rise (Convection) and results in a thermal low air pressure area, because of the air expanding due to the heat.
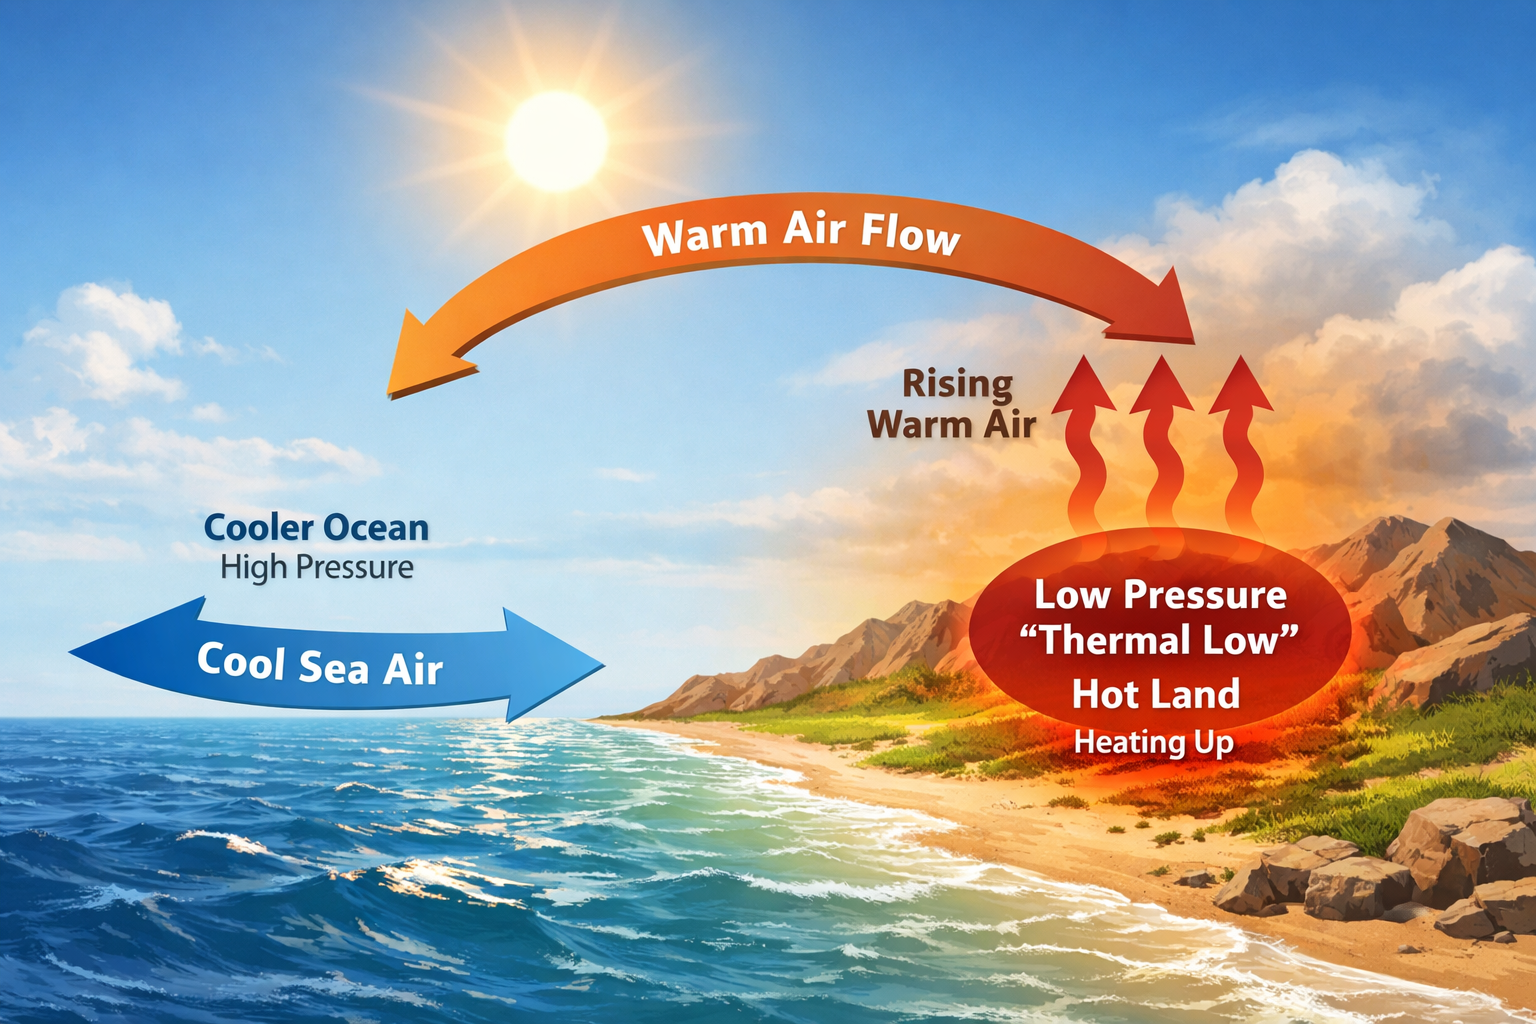
As the air pressure at sea becomes a bit higher and on land, a small wind will now occur. As we already know that air from a high pressure area will always flow to a low pressure area, sea wind is now created. The barrier between the cold sea-air and warm land air is called the seawind front.
Sea wind circulation mostly happens in the spring, where the sea water is relatively cool and the sun radiation is strong enough to heat up the land, creating the temperature and resulting air pressure differences. Also these winds are also affected by the coriolis effect. The winds of the sea can reach several kilometers into land (up to 50km, based on the ground resistance).
These seawinds can cause some turbulence and wind shears and on the sea, some cumulus clouds can form. Sometimes with precipitation (neerslag).
Mountain and valley winds
In the mountains and valleys, we have huge sun radioation and resulting temperature differences which cause a lot of thermal high and low pressure areas.
We have 2 definitions to know here:
- Anabatic winds: Rising winds up to the tops (blue)
- Also called the Windward side (loefzijde)
- Katabatic wind: Descending winds from the tops to valleys (warm)
- Also called the Leeward side (lijzijde)
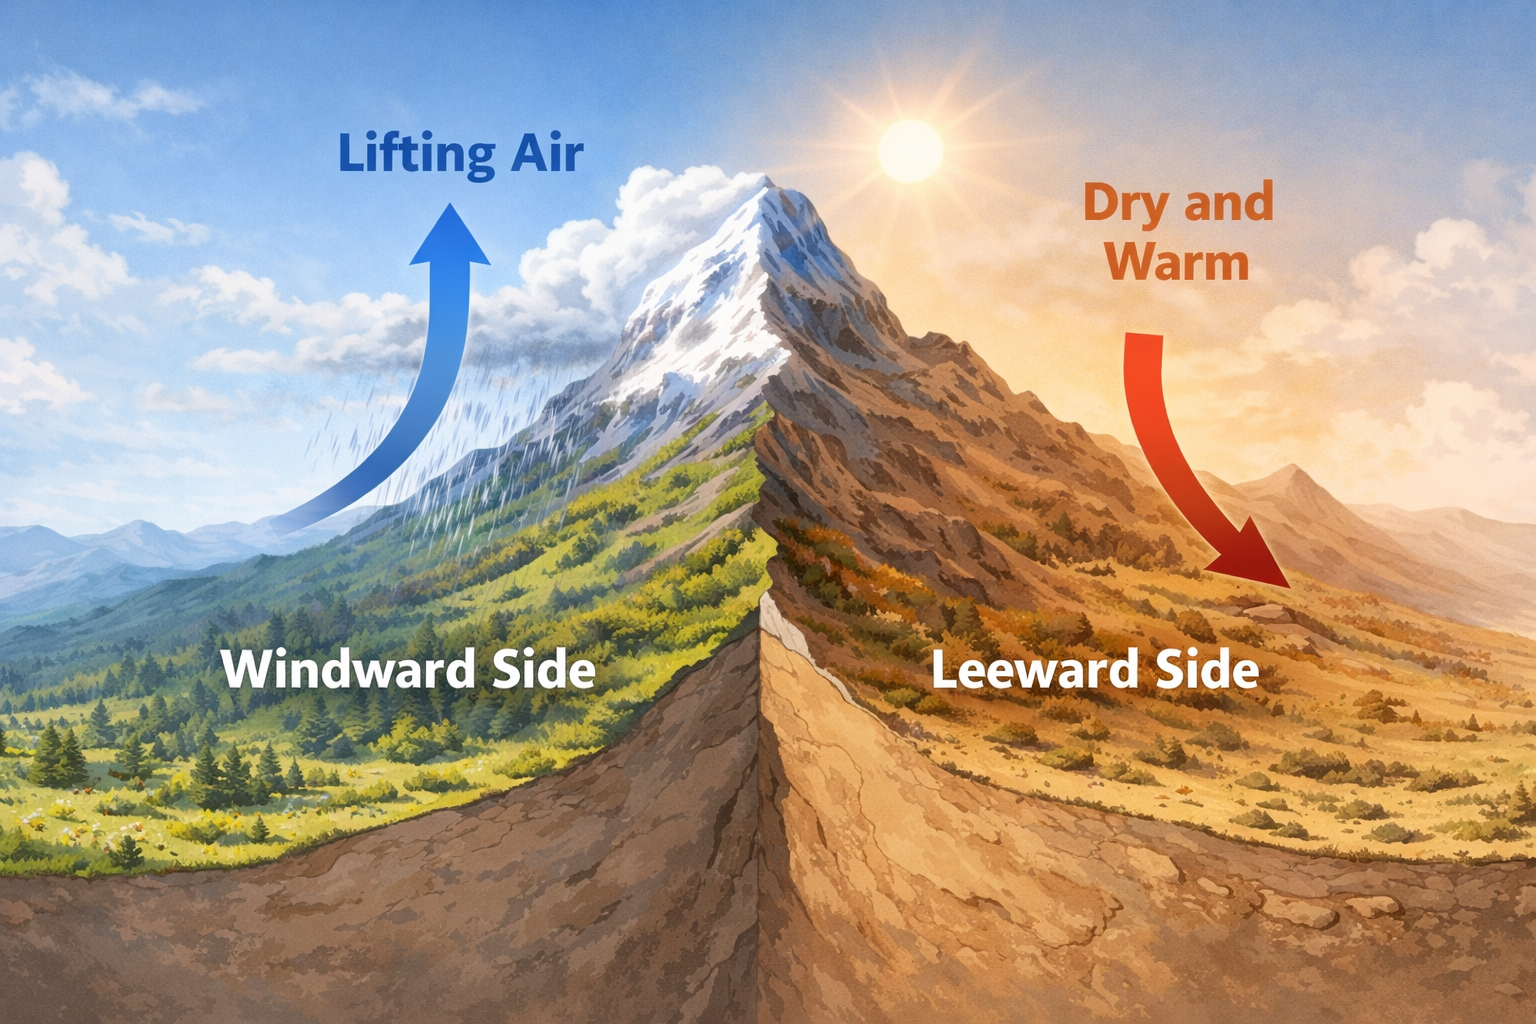
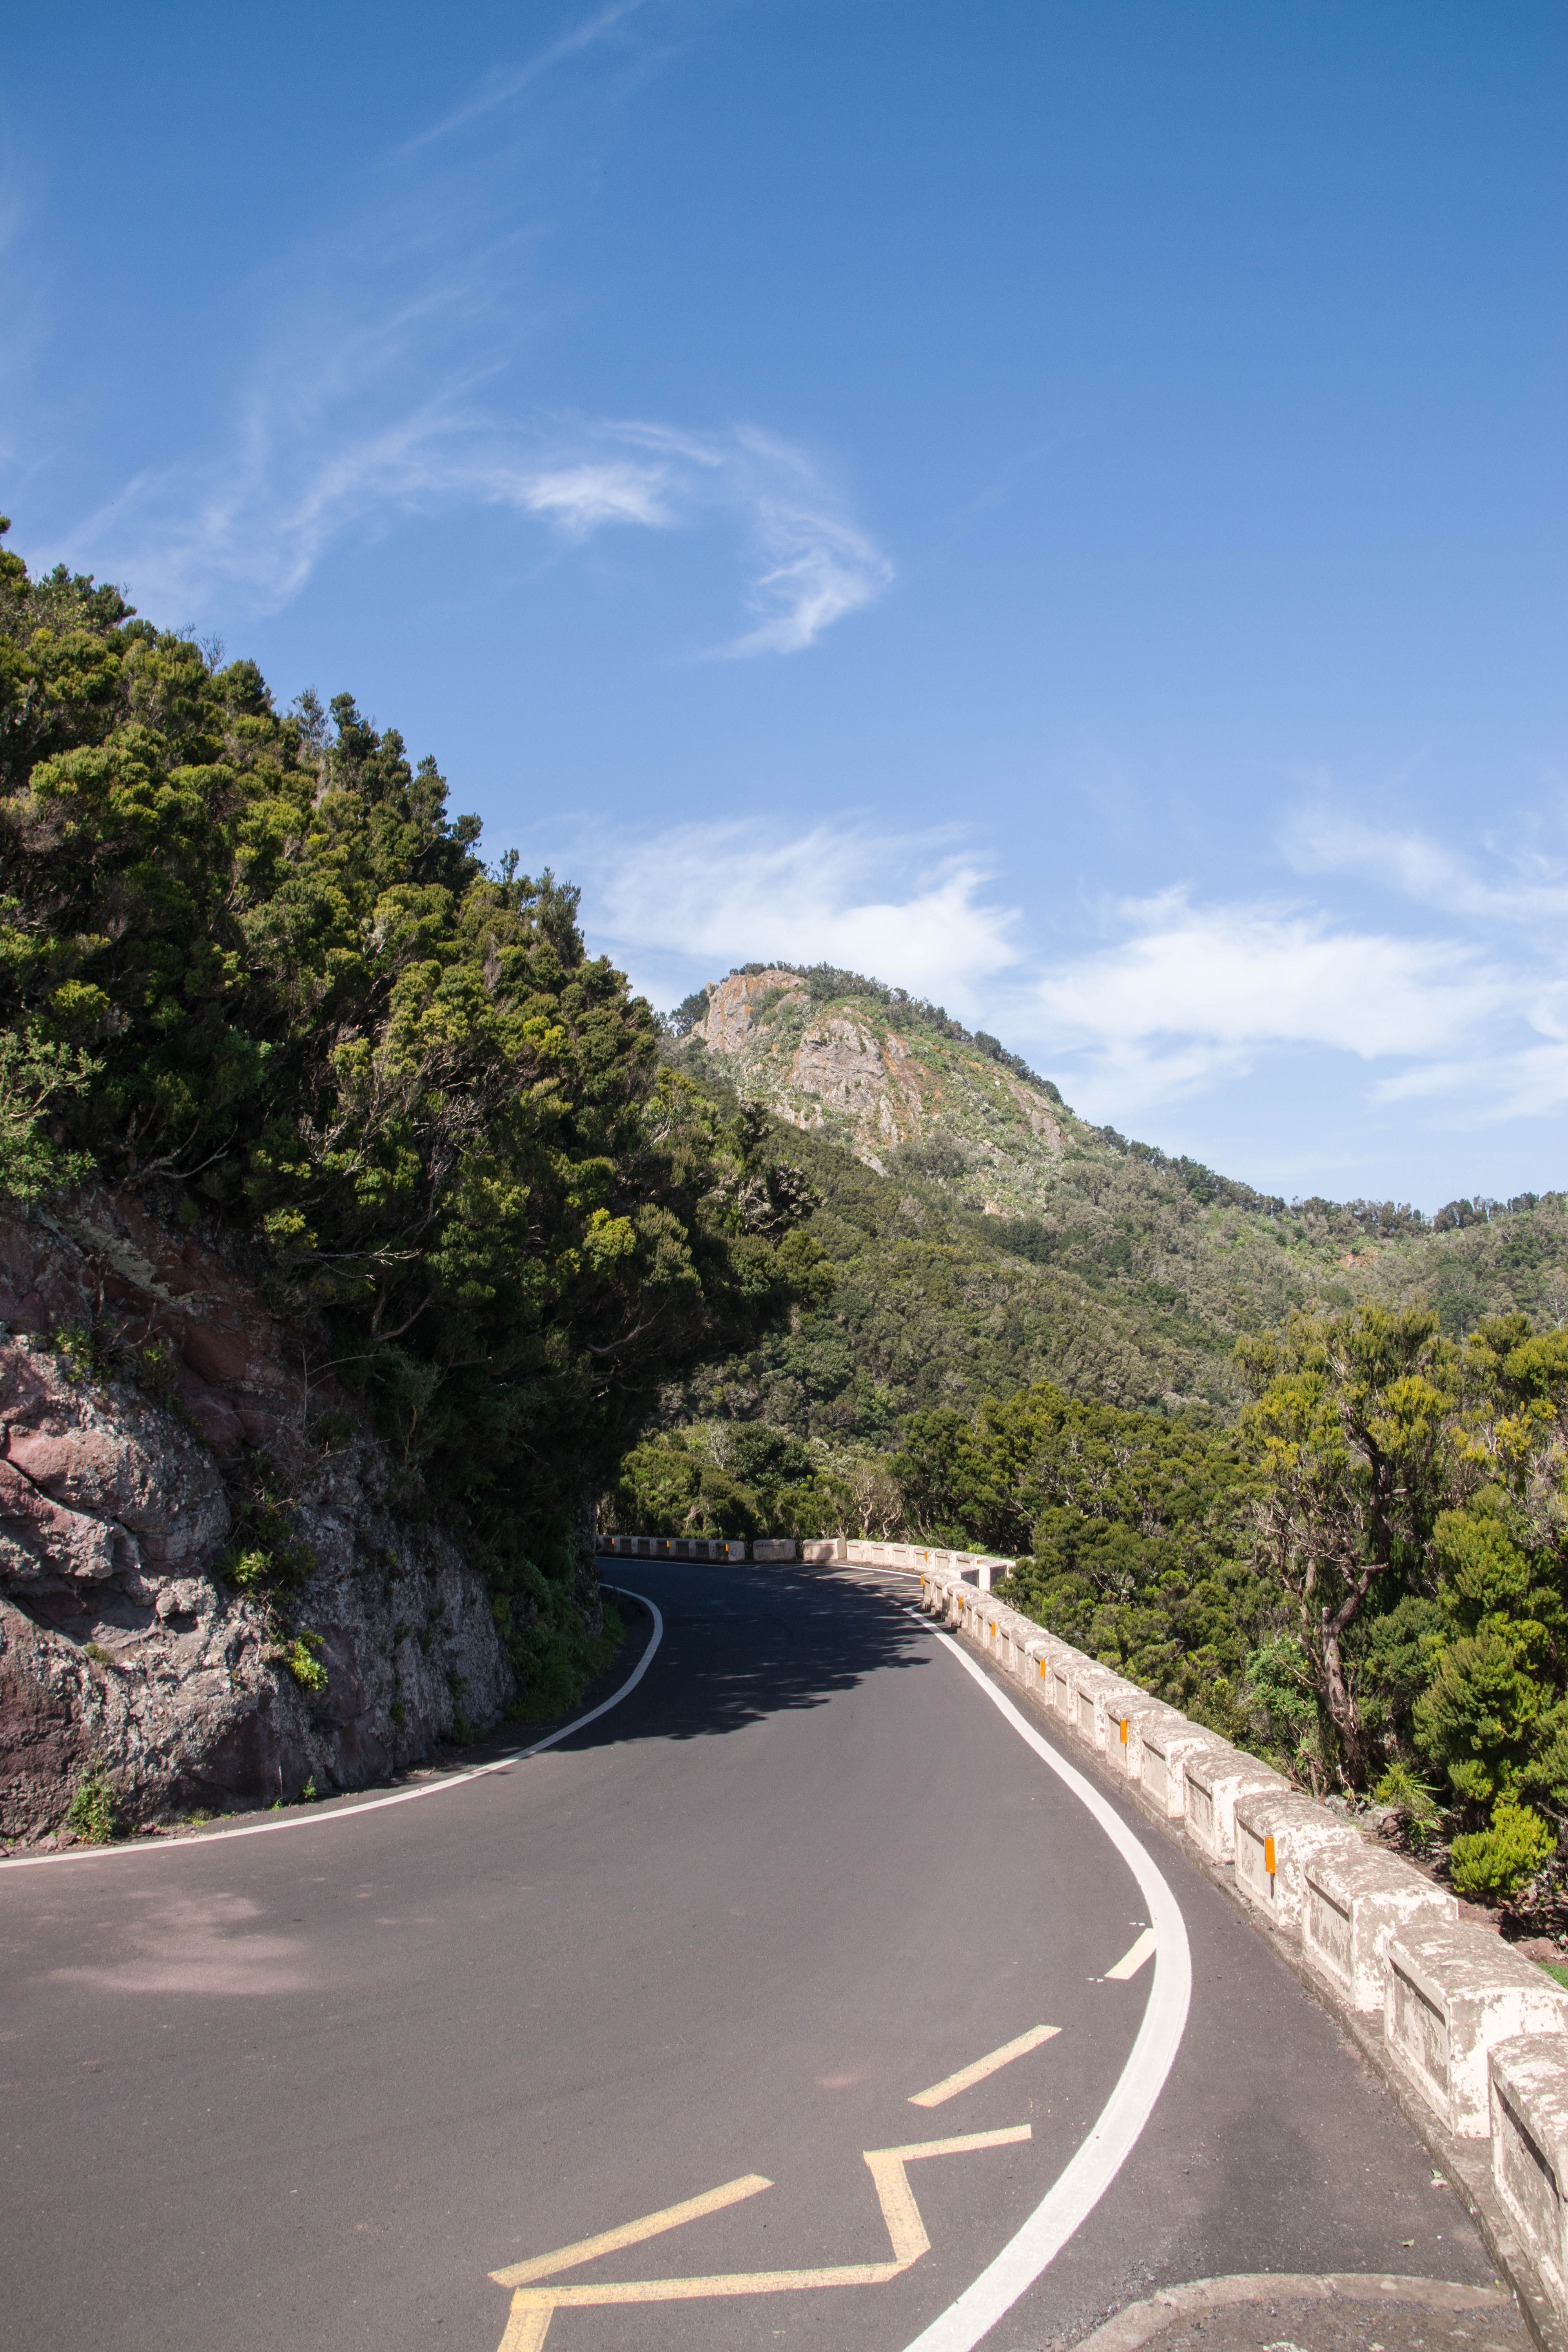
At the Canary Islands, most islands have this as primary climate where at the north the clouds and precipitation comes to the islands but are held back by the mountains. At the south side of the islands, the weather is a lot better and more dry. To describe the full process:
- Air full of moist will flow to the mountain side
- The air rises, expands and cools down, called the adiabatic cooling
- The air will reach the dew point
- Water vapor will condensate and will result in clouds and precipitation
- The clouds are pushed to the mountains and want to go up because of the Fohn effect
- At the top, most of the water vapor is rained down and the air contains a lot less water vapor
- Over the top, the air will fall down because of gravity
- Descending air will be compressed and heated as result of the compression, called the adiabatic heating
- Warm air can contain a lot more water vapor, causing the humidity to lower
- Because of this, clouds will dissappear and we can enjoy the sun
Fohn effect
The fohn is a name for the dry katabatic wind that flows down from the mountain top down to the valleys. The fohn name is mostly used in the Alps to name the warm winds from the Mediterranean Sea but the effect/result is the same.
Because of this air flow, this can cause mild to severe turbulence above those mountains.
Mountain waves
Mountain waves will occur when the flow of air is pushed over a mountain ridge (bergrug). If a stable layer of air is present, the passage will back down. This causes a golf pattern which can be measured even several hunderd kilometers after the mountain ridge. Mountain waves will be caused in these conditions:
- The angle between wind and mountain ridge must be around 90 degrees
- A wind speed of 20 knots or more
- A stable layer of air of thousands of feets around the mountain-tops
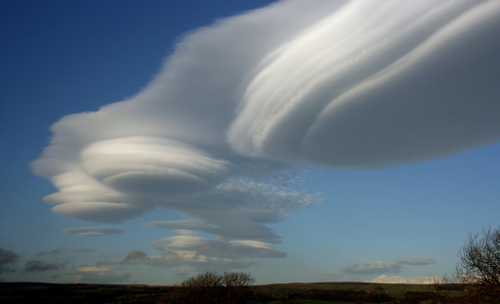
Rotor and rotorclouds
Under the mountain waves, behind the mountain ridge and somewaht under the tops, a rotor will occur. Just like what happens at a plane-wing creating lift and stalling somewhat.
This mass of air rotates under a horizontal axis and wind speeds can be massive. Upward and downward speeds can be thousands of feet per minute and causes a lot of turbulence.
In dry air, this rotor is not visible, but with humid air they can cause rotary clouds. They look innocent but can blow with a lot of winds and cause severe turbulence. They look a bit like lenses of a camera.
Venturi effect
The venturi effect is wind that is forced to flow through a narrow space, causing the wind speed to increase and the air pressure to decrease. This seems not very important, but if flying there, the altimeter can indicate a lot higher altitude than you are actually flying. This difference can be hundreds of feets.
Valley inversion
A valley inversion is just like a normal inversion, but then in mountain-rich areas. The can occur in these conditions:
- When the air above a mountain ridge cools down, a downward flow of cool air will occur (katabatic wind) and will form a reservoir at the bottom of the valley
- As result of advection of warm air in higher layers of air
Valley inversions have several dangers for aviation which other inversions also have, like poor visibility, thick layers of clouds and high wind speeds at the upper side with windshears and turbulence. Taking into account you are flying in a mountain-rich area can cause huge accidents which pilots must be aware of.
Wind shears
Wind shears are rapidly changes of wind speeds and directions. Wind shears can be horizontal and vertical and will affect the way the plane flies. As we need air speed, including winds, to fly we need a flow of air. But if that flow of air is interrupted instantly, our speed and or altitude can result in a major decrease. We don’t want this when taking off or landing.
- Vertical windshear is the differences of wind in vertical scale. As we descend, we will getting less winds eventually resulting in a loss of airspeed and life. Our plane will descend even faster
- Horizontal windshear is when the cross winds are changing rapidly, which can cause us to get of track for landing. Buildings are the most important cause of this happening. As ground resistance rises but then catching some of the winds, we can go off track
- Updrafts and downdrafts are a result of convection and will have vertical winds, pulling you up or pushing you down. This mostly happens in the vicinity of thunderstorms
The 4 most important causes of wind shears are:
- A front passing by
- Thunderstorms
- Ground resistance in the form of buildings, forests or obstacles
- Inversions
- At the top of a layer of friction
Results of wind shears
Wind shears can occur at every altitude, but are the most dangerous above the ground like in take-off and landing.
You know, planes fly because they have a speed in the mass of air they are flying into. This is called the True Airspeed (TAS). If we have a ground speed of 70 knots and a headwind of 30 knots, the resulting TAS is 100 knots. If that headwind suddenly changes from 30 to 0 knots, our speed will decrease 30 knots. This causes our plane to create a lot less lift, resulting in a sudden descend. You can imagine as this happens feets from the runway, this can cause severe incidents.
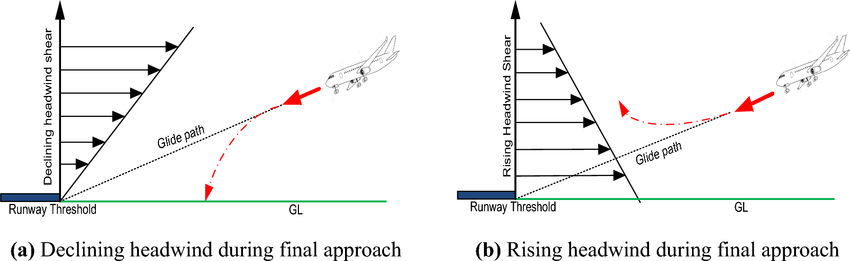
We speak of a low level windshear if this happends 1600ft AGL (500m) or lower.
Turbulence
The wind never flows from A to B in a horizontal line with a constant speed. By buildings, forests, obstacles, heating and instability (all called ground resistance) or different layers of air, the wind will get an unorganized flow. This is called turbulence.
Turbulence has several causes:
- Thermal turbulence: Heating of earths surface with rising air causing mild turbulence (thermiek/convectie)
- Mechanical turbulence: Caused by winds flowing to buildings, forests or altered by ground resistance (present in ground to 3000ft AGL)
- Orographic turbulence: Turbulence caused by mountains, rotorwaves and mountain waves and can reach above the actual mountains in the area
- Clear air turbulence: Turbulence caused by clear and cloudless area’s. This is caused by jet streams and mountain waves
We classify turbulence into 3 categories:
- Mild turbulence
- Moderate turbulence
- Severe turbulence
As every type of plane is built different, so is the level of what you feel. An Boeing 737 is less likely to feel turbulence than a Cessna 172.
Types of air (8)
An air mass is a collection of air with equal temperature and humidity spanning several hundred kilometers. An air type has a area of source which is a great area with similar elevation. The mass must be long enough to stay in that area. Examples are:
- Oceans
- Deserts
- Snow plains
The source of the air mass is deciding the results of the air type. If this is moving, the properties will change. This process is called transforming and the properties will change from the source of air to its transfomed state.
The area’s of source which decide the weather in the Netherlands (and the rest of Europe) are:
- Atlantic ocean
- Siberia
- North Africa
Definitions of air types
We have some definitions for different air types which we call in a certain abbreviation:
- The geographic source of air
- Maritime (Air comes from water)
- Continental (Air comes from land)
- The thermodynamic layout of the air
- Arctic air (AL)
- Polar air (PL)
- Tropical air (TL)
An combination of these is used when we say the cold eastern wind in the Netherlands is cPL. Continental, polar air.
A full table of all possibilities and definitions:
| Air Mass Type | Season | Characteristics | Weather |
|---|---|---|---|
| cAL (continental Arctic) | All year, except in summer | Cold air mass | Stable weather (cold, dry air) |
| mAL (maritime Arctic) | All year, except in summer | Cold air mass | Cold, often unstable weather; stormy winds. Showers. Good visibility |
| cPL (continental Polar) | All year | In summer warm air mass (CM), in winter cold air mass (CM) | Dry air. In winter very cold, in summer very warm. Little cloud cover |
| mPL (maritime Polar) | All year | In summer cold air mass (CM), in winter usually warm air mass (WM), sometimes CM | Moderate temperatures, humid. In KM: cumuliform clouds with showers. Good visibility |
| cTL (continental Tropical) | All year, but mainly in summer | Usually warm air mass (WM); in a warm summer sometimes CM | Warm and dry. Little cloud cover. Due to dust content, visibility often moderate or poor |
| mTL (maritime Tropical) | All year | Usually warm air mass (WM); in a warm summer sometimes CM | Warm and humid. Layered clouds, possible drizzle; mist. Especially in summer (CM) thunderstorms. Due to high humidity visibility moderate or poor |
CM = cold mass WM = warm mass *Abbreviations in Dutch
Air masses
Because of cold mass will be heated and warm mass will be colled down, this can have some consequences for the vertical stability in the atmosphere. They can result in precipitation, clouds and fog.
- If a mass of air on 1,5 meters is colder than on the ground, we speak of a cold mass
- If a mass of air on 1,5 meters is warmer than on the ground, we speak of a warm mass
| Property | Cold Mass | Warm Mass |
|---|---|---|
| Stability | Unstable structure | Stable structure |
| Wind | Gusty | Steady |
| Wind change with height | Little | Considerable |
| Turbulence | Light to moderate | None or very light |
| Clouds | Cumuliform, convective | Stratiform |
| Precipitation | Showers, possibly thunderstorms and hail | Drizzle, light snow |
| Visibility | Good outside precipitation | Moderate to poor |
Clouds and precipitation (9)
Clouds will occur when warm rising air is cooled down by adiabatic processes. By cooling down air, the water vapor will condensate to water which is the cloud itself and can be in the form of rain. Because warm air can hold more moist, all of this moist is colled down and a cloud is born.
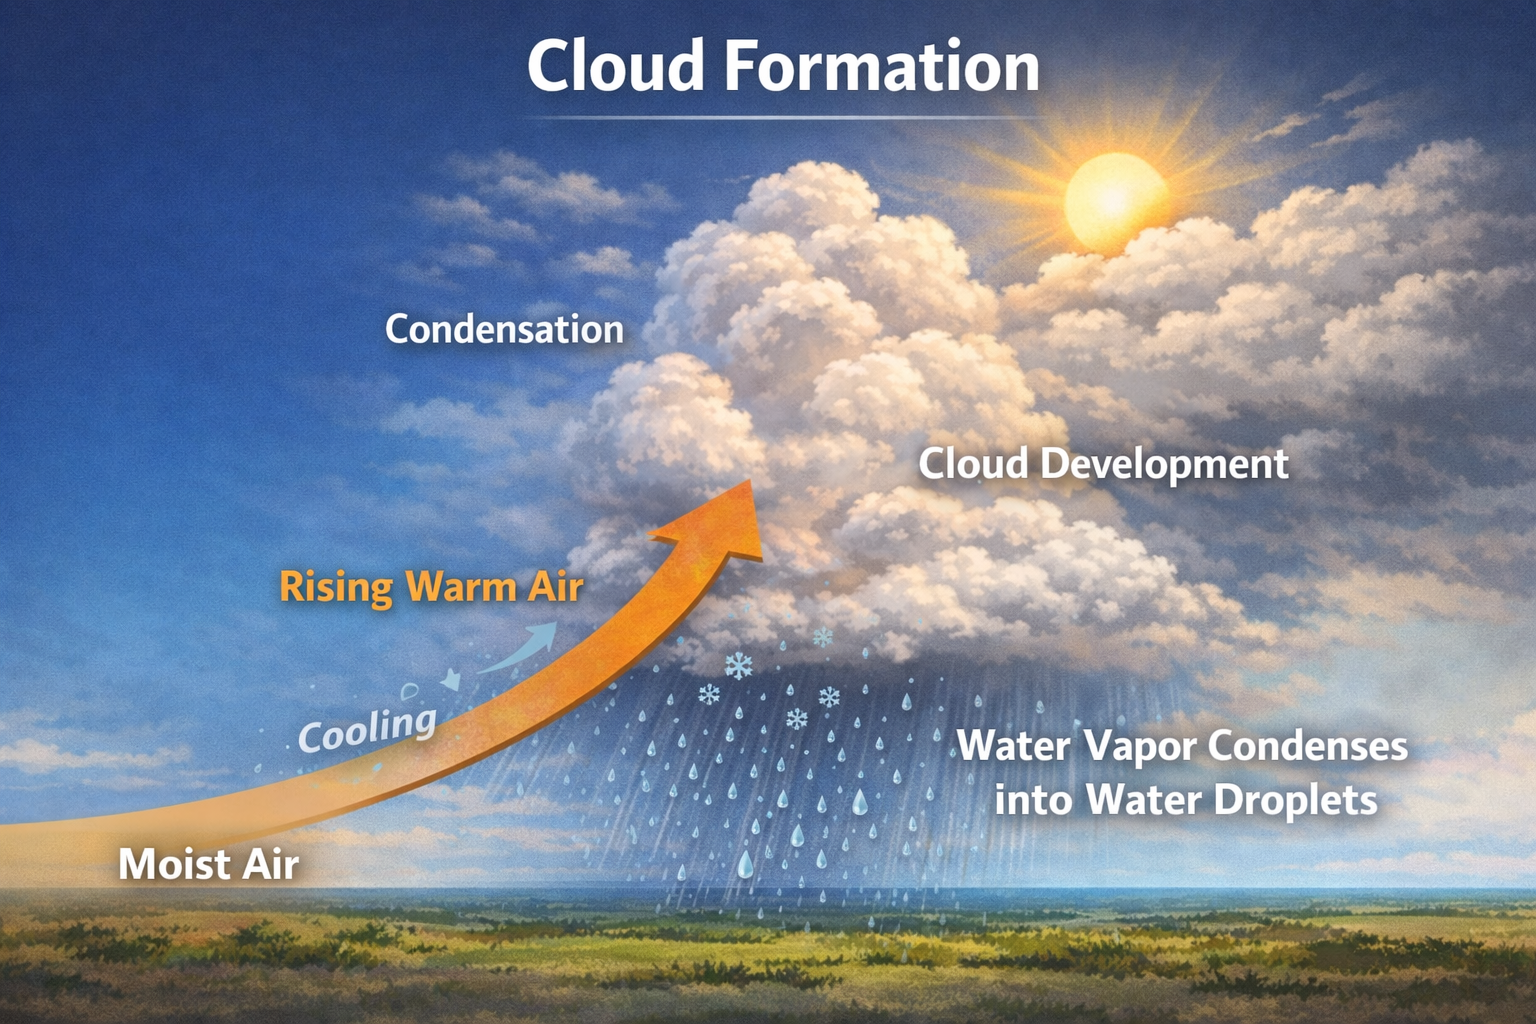
The condensation process
Condensation occurs when air is saturated with water vapor, so cooling to the dew point. In clean air, this happens far beyond the dew point. The proces will goes much faster if there are condensation nuclei (condensatiekernen) in the air. Types of those condensation nuclei are:
- Dust parts
- Sand
- Soot particles
- Salt crystals
Clouds appear in rising air which is cooled down by adiabatc processes, and then saturated with water vapor. If the air has condensation nuclei, this goes faster into liquid water.
Rising air movements
There are multiple causes of why air masses will rise into the air. Lets take a look at them:
- Convection (thermiek): Local heating of the surface by the sun causing a part of warm air to rise and then cool doen. With enough cooling, clouds will form if the water vapor is condensating to small droplets of water. Convection happens the most at sunny summer days without clouds where the ground can warm up easily, like above sand and mountains and during the afternoon.
- Forced lifting: When in a mountain-rich terrain or close to mountain waves
- Low pressure areas that cause rising air movements, first converging air and then rising into the air
Influence on stability
The type of clouds generated is dependent on the stability of the atmosphere.
- In an unstable atmosphere with much vertical movements this will cause cumuliform (stacking) clouds
- In an stable atmosphere with much vertical movements this will cause stratiform (layered) clouds
Condensation level: with decreasing air pressure when going up, the dew point will also decrease. This decrease is about 0,6 degrees celcius every 1000ft.
Every 400ft up, the temperature and dew point will come together by 1 degree celcius.
Fundaments of clouds
As result of condensation of water vapor, there will be a lot water droplets (0,01 to 0,1 mm). These droplets will stay liquid if they stay above 0 degrees. Under 0, they can freeze but will most likely not be directly. Most water dropleys will freeze after being -12 degrees celcius, after being undercooled water. This is water that is under the freezing point, but not freezing because of moving or not enough oxygen.
There are clouds like the cirrus which only are made of ice crystals because of the altitude where they reside. Water droplets and crystals are called cloud elements.
Clouds that are completely made of liquid water are called water-clouds. If clouds are partly made of water and ice, they are called merged clouds. For ice clouds, they are logically made up of ice.
Categorization of clouds
Clouds are categorized into 3 levels based on their altitude and they partly get the name from the height and then a suffix of the cloud type.
| Level | Cloud base | Genera |
|---|---|---|
| High-level clouds (Cirro) | 5 km+ 16.000ft+ | Cirrus (Ci), Cirrostratus (Cs), Cirrocumulus (Cc) |
| Mid-level clouds (Alto) | 2km - 7km 6.500ft - 23.000ft | Altocumulus (Ac), Altostratus (As), Nimbostratus (Ns) |
| Low-level clouds | 0 - 2km 0 - 6.500ft | Stratus (St), Stratocumulus (Sc), Cumulus (Cu), Cumulonimbus (Cb) |
Here I have generated a nice legenda which contains the most occuring types of clouds and their altitudes to better map them and give a better understanding than a table:
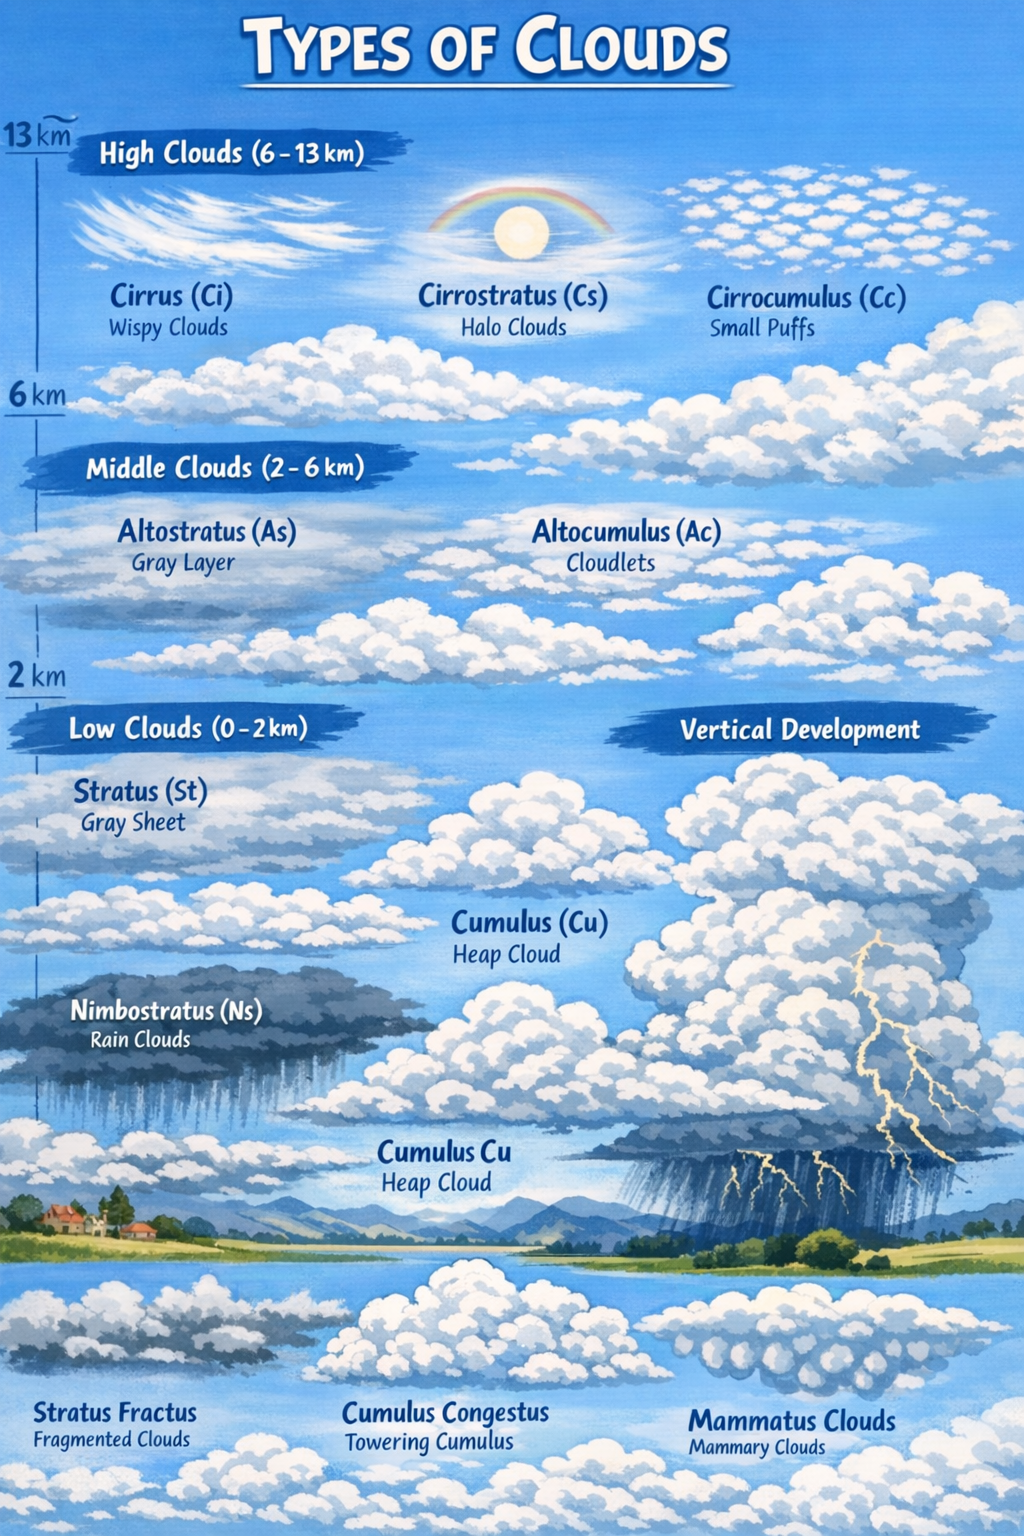
A good rule of thumb is that Cumulus clouds are formed by convection (unstable atmosphere), and Stratus type clouds formed by stable atmosphere
Cloud types (own pictures)
To train my eye a bit better, I went through my picture gallery and searched if I could find the cloud types in my pictures which was really fun to do. I always liked to take pictures of clouds and sunsets because they can sometimes be a piece of art.
Cumulus (Cu)
Here I have a picture full of cumulus (stacked in Latin) clouds, everybody seen them a lot during summer days:
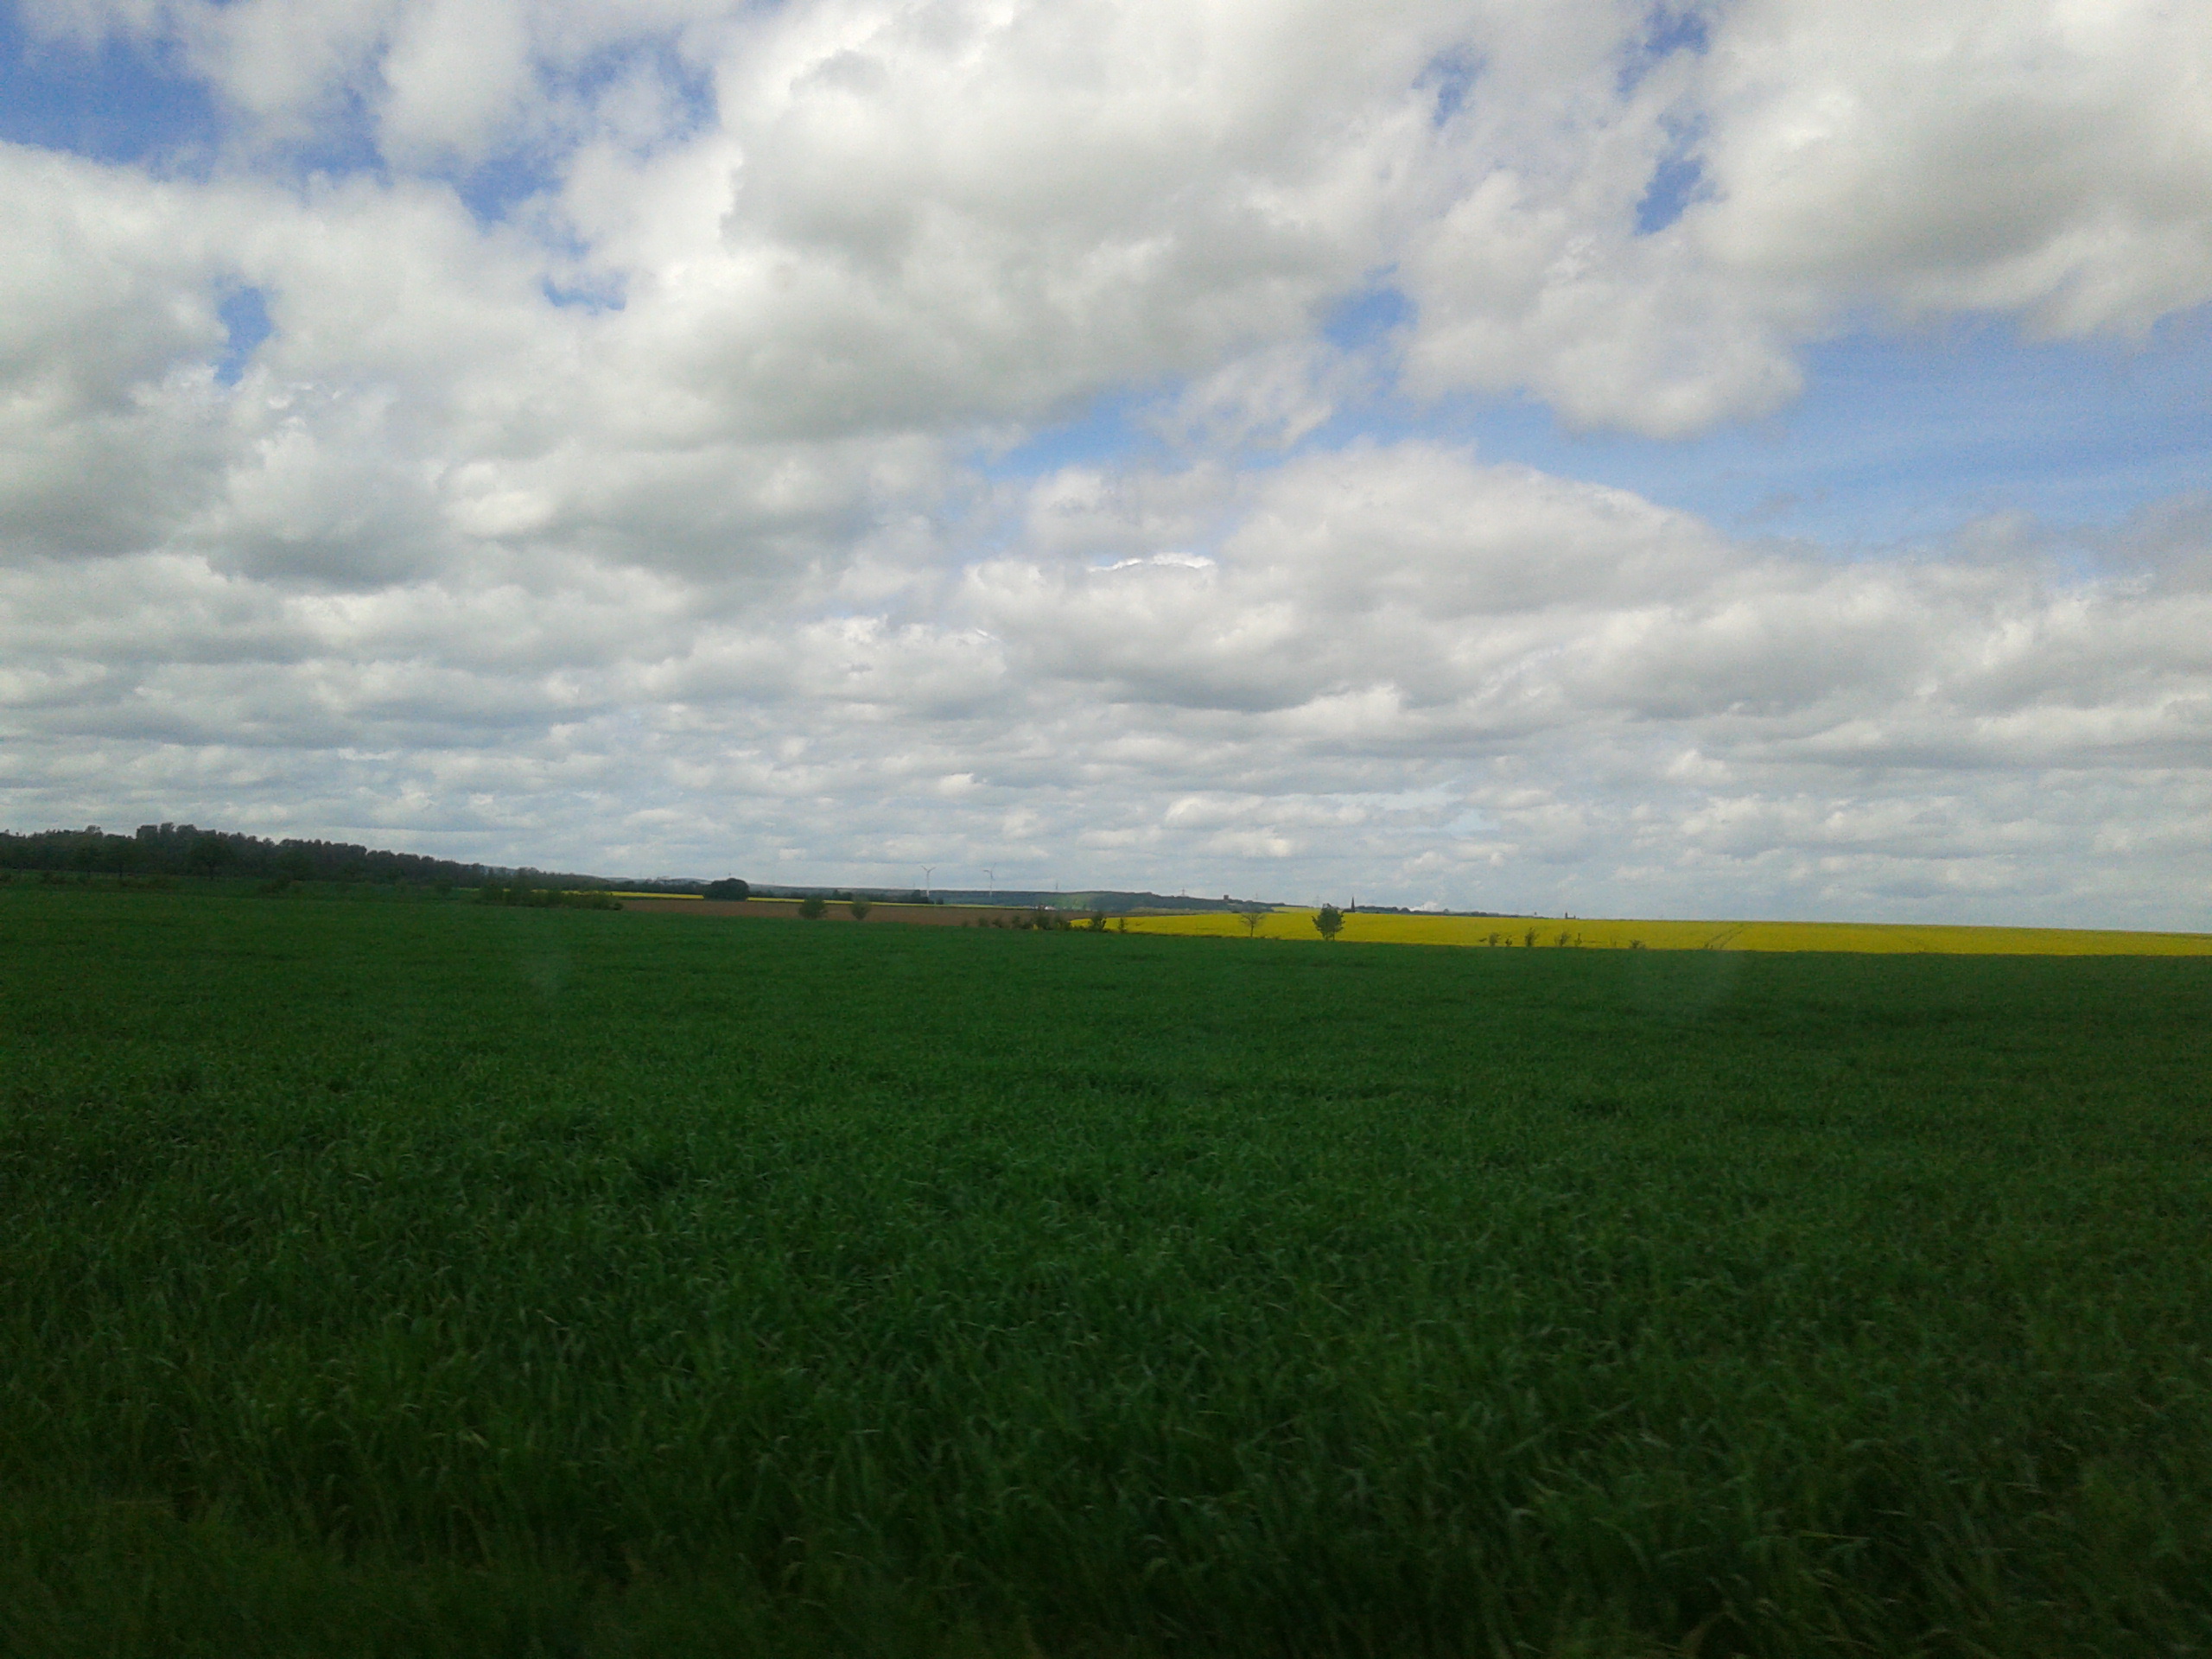
Immediately gives away why they are called “cumulus”. They are stacked/cumulative clouds.
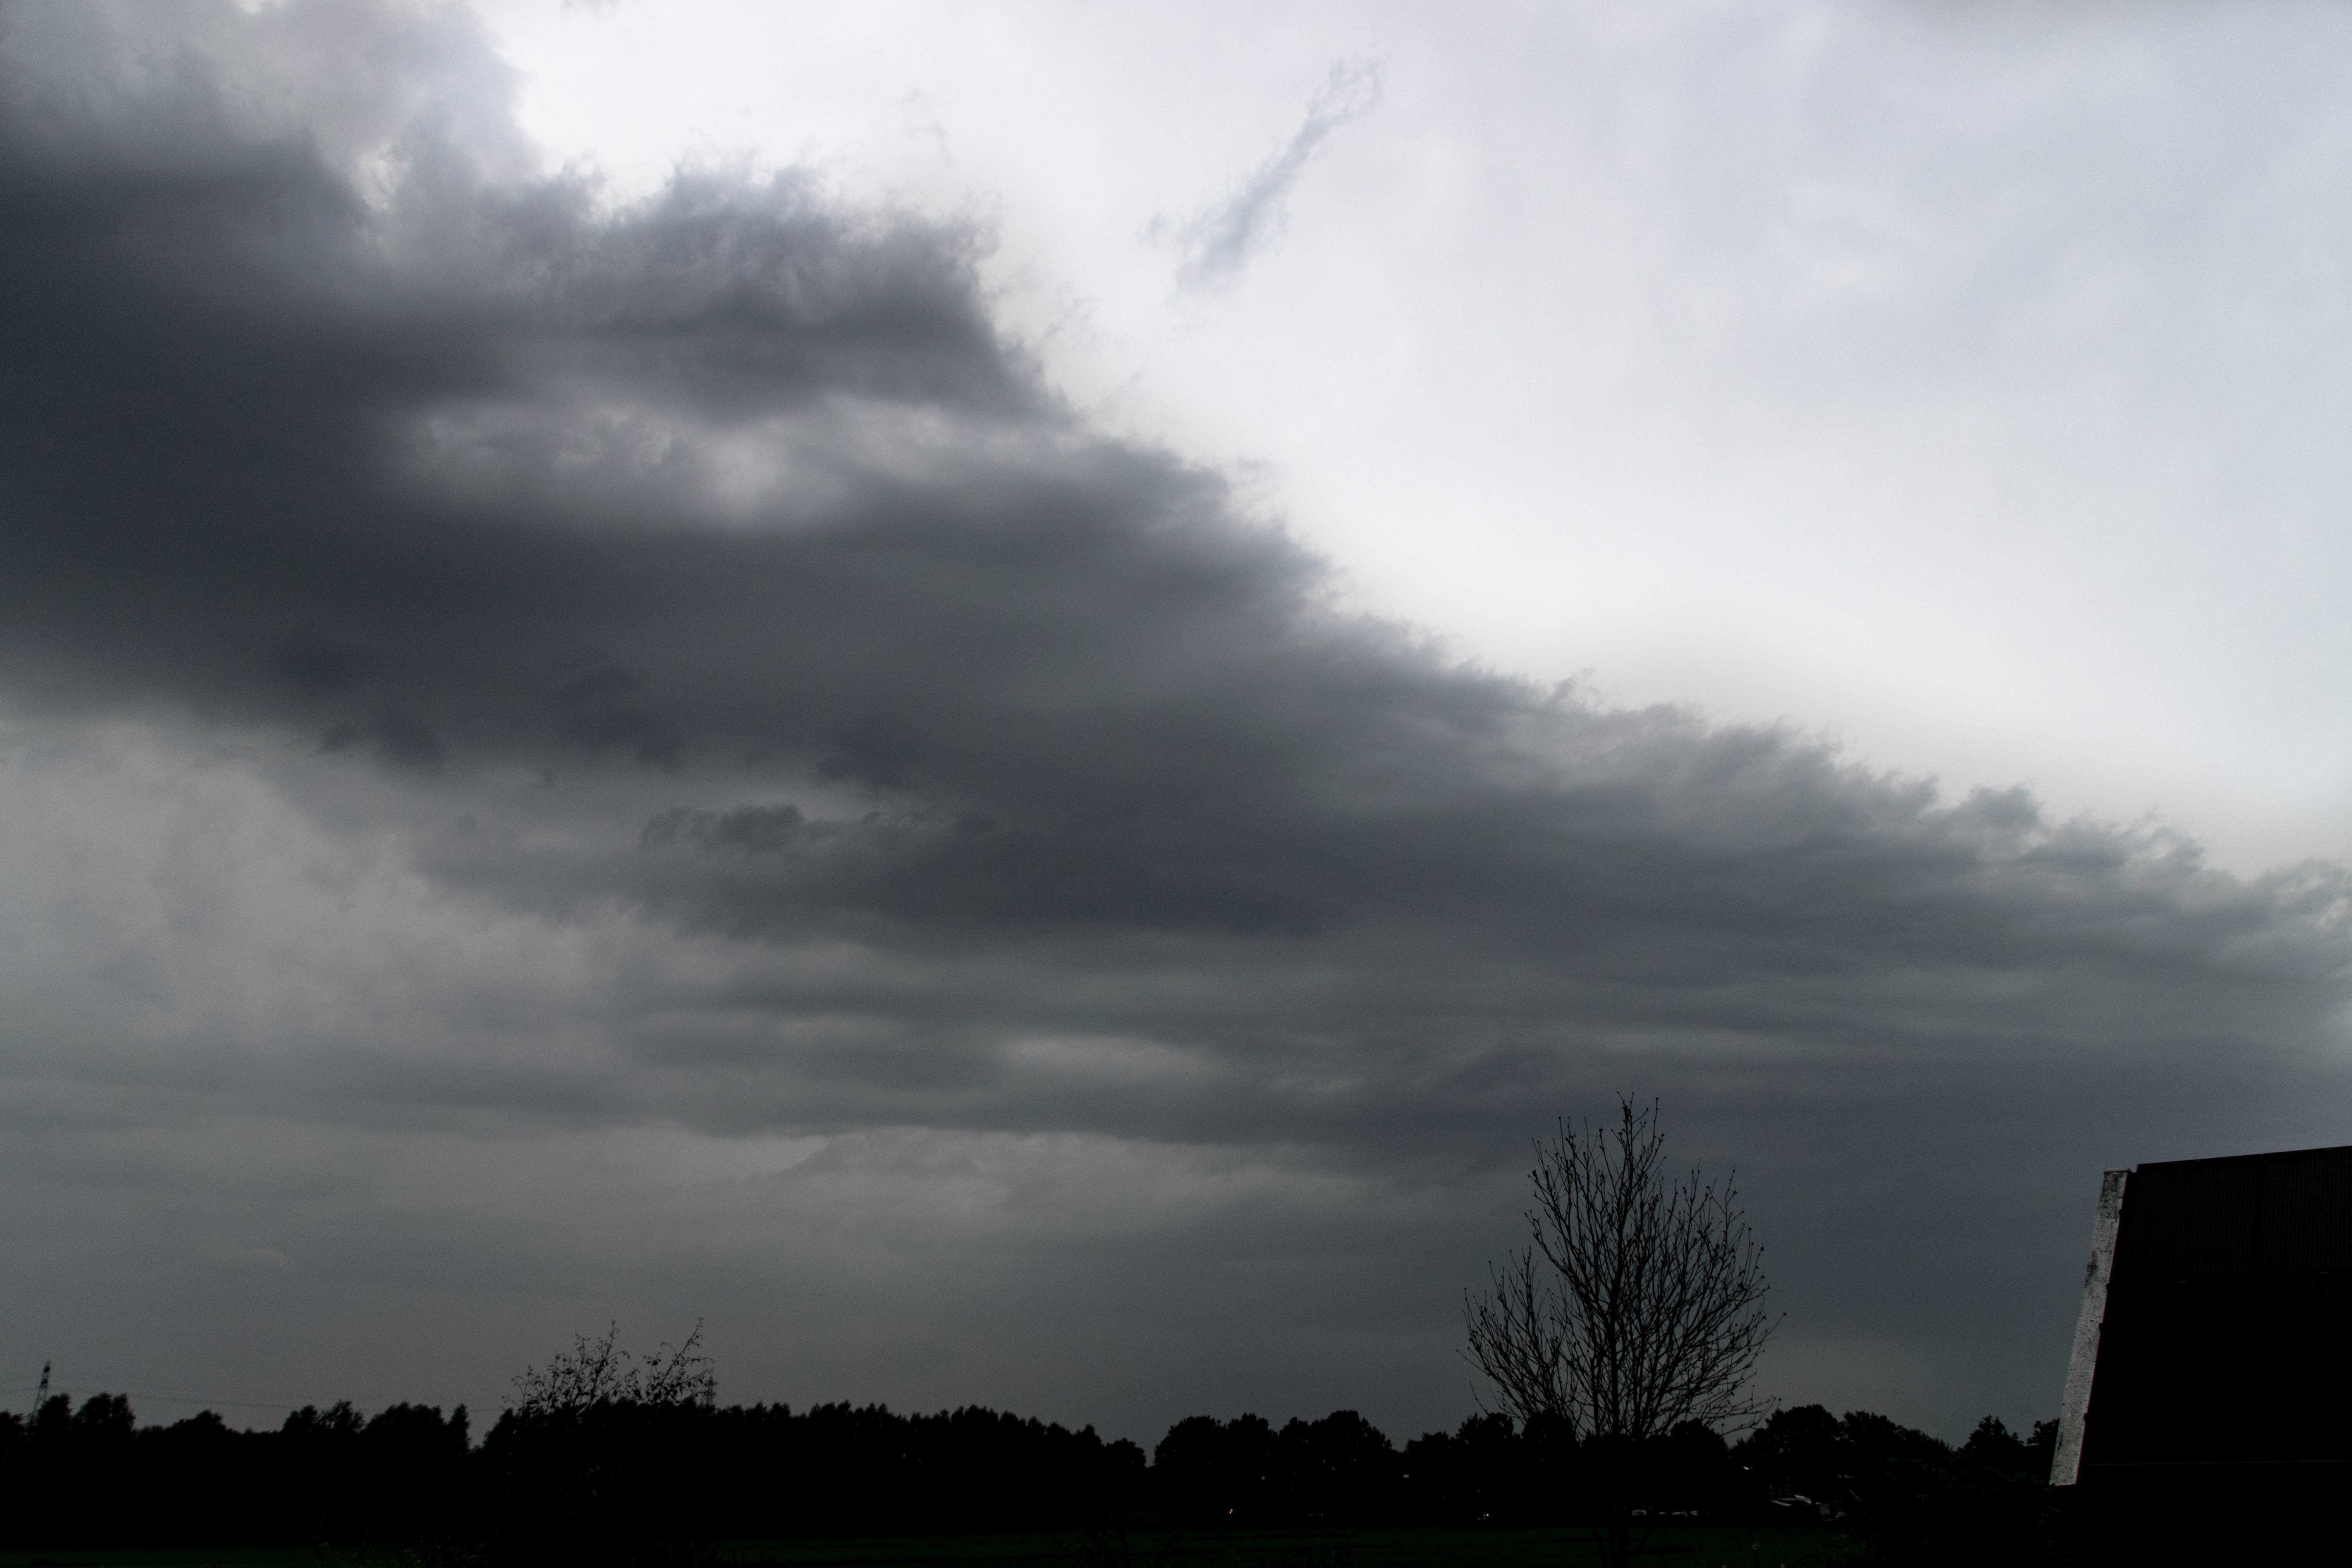
Nimbostratus (Ns)
Very boring rain clouds, which everybody seen a lot in their lives:
Nimbostratus clouds can be present on any layer, but from the ground we see the lower part only. These are clouds which drop water and can be present in a warm-front.
Stratus (St)
These clouds are called “stratus”. This is latin for “layered”.
This is a clear and big layer of the same level clouds in the low altitude region.
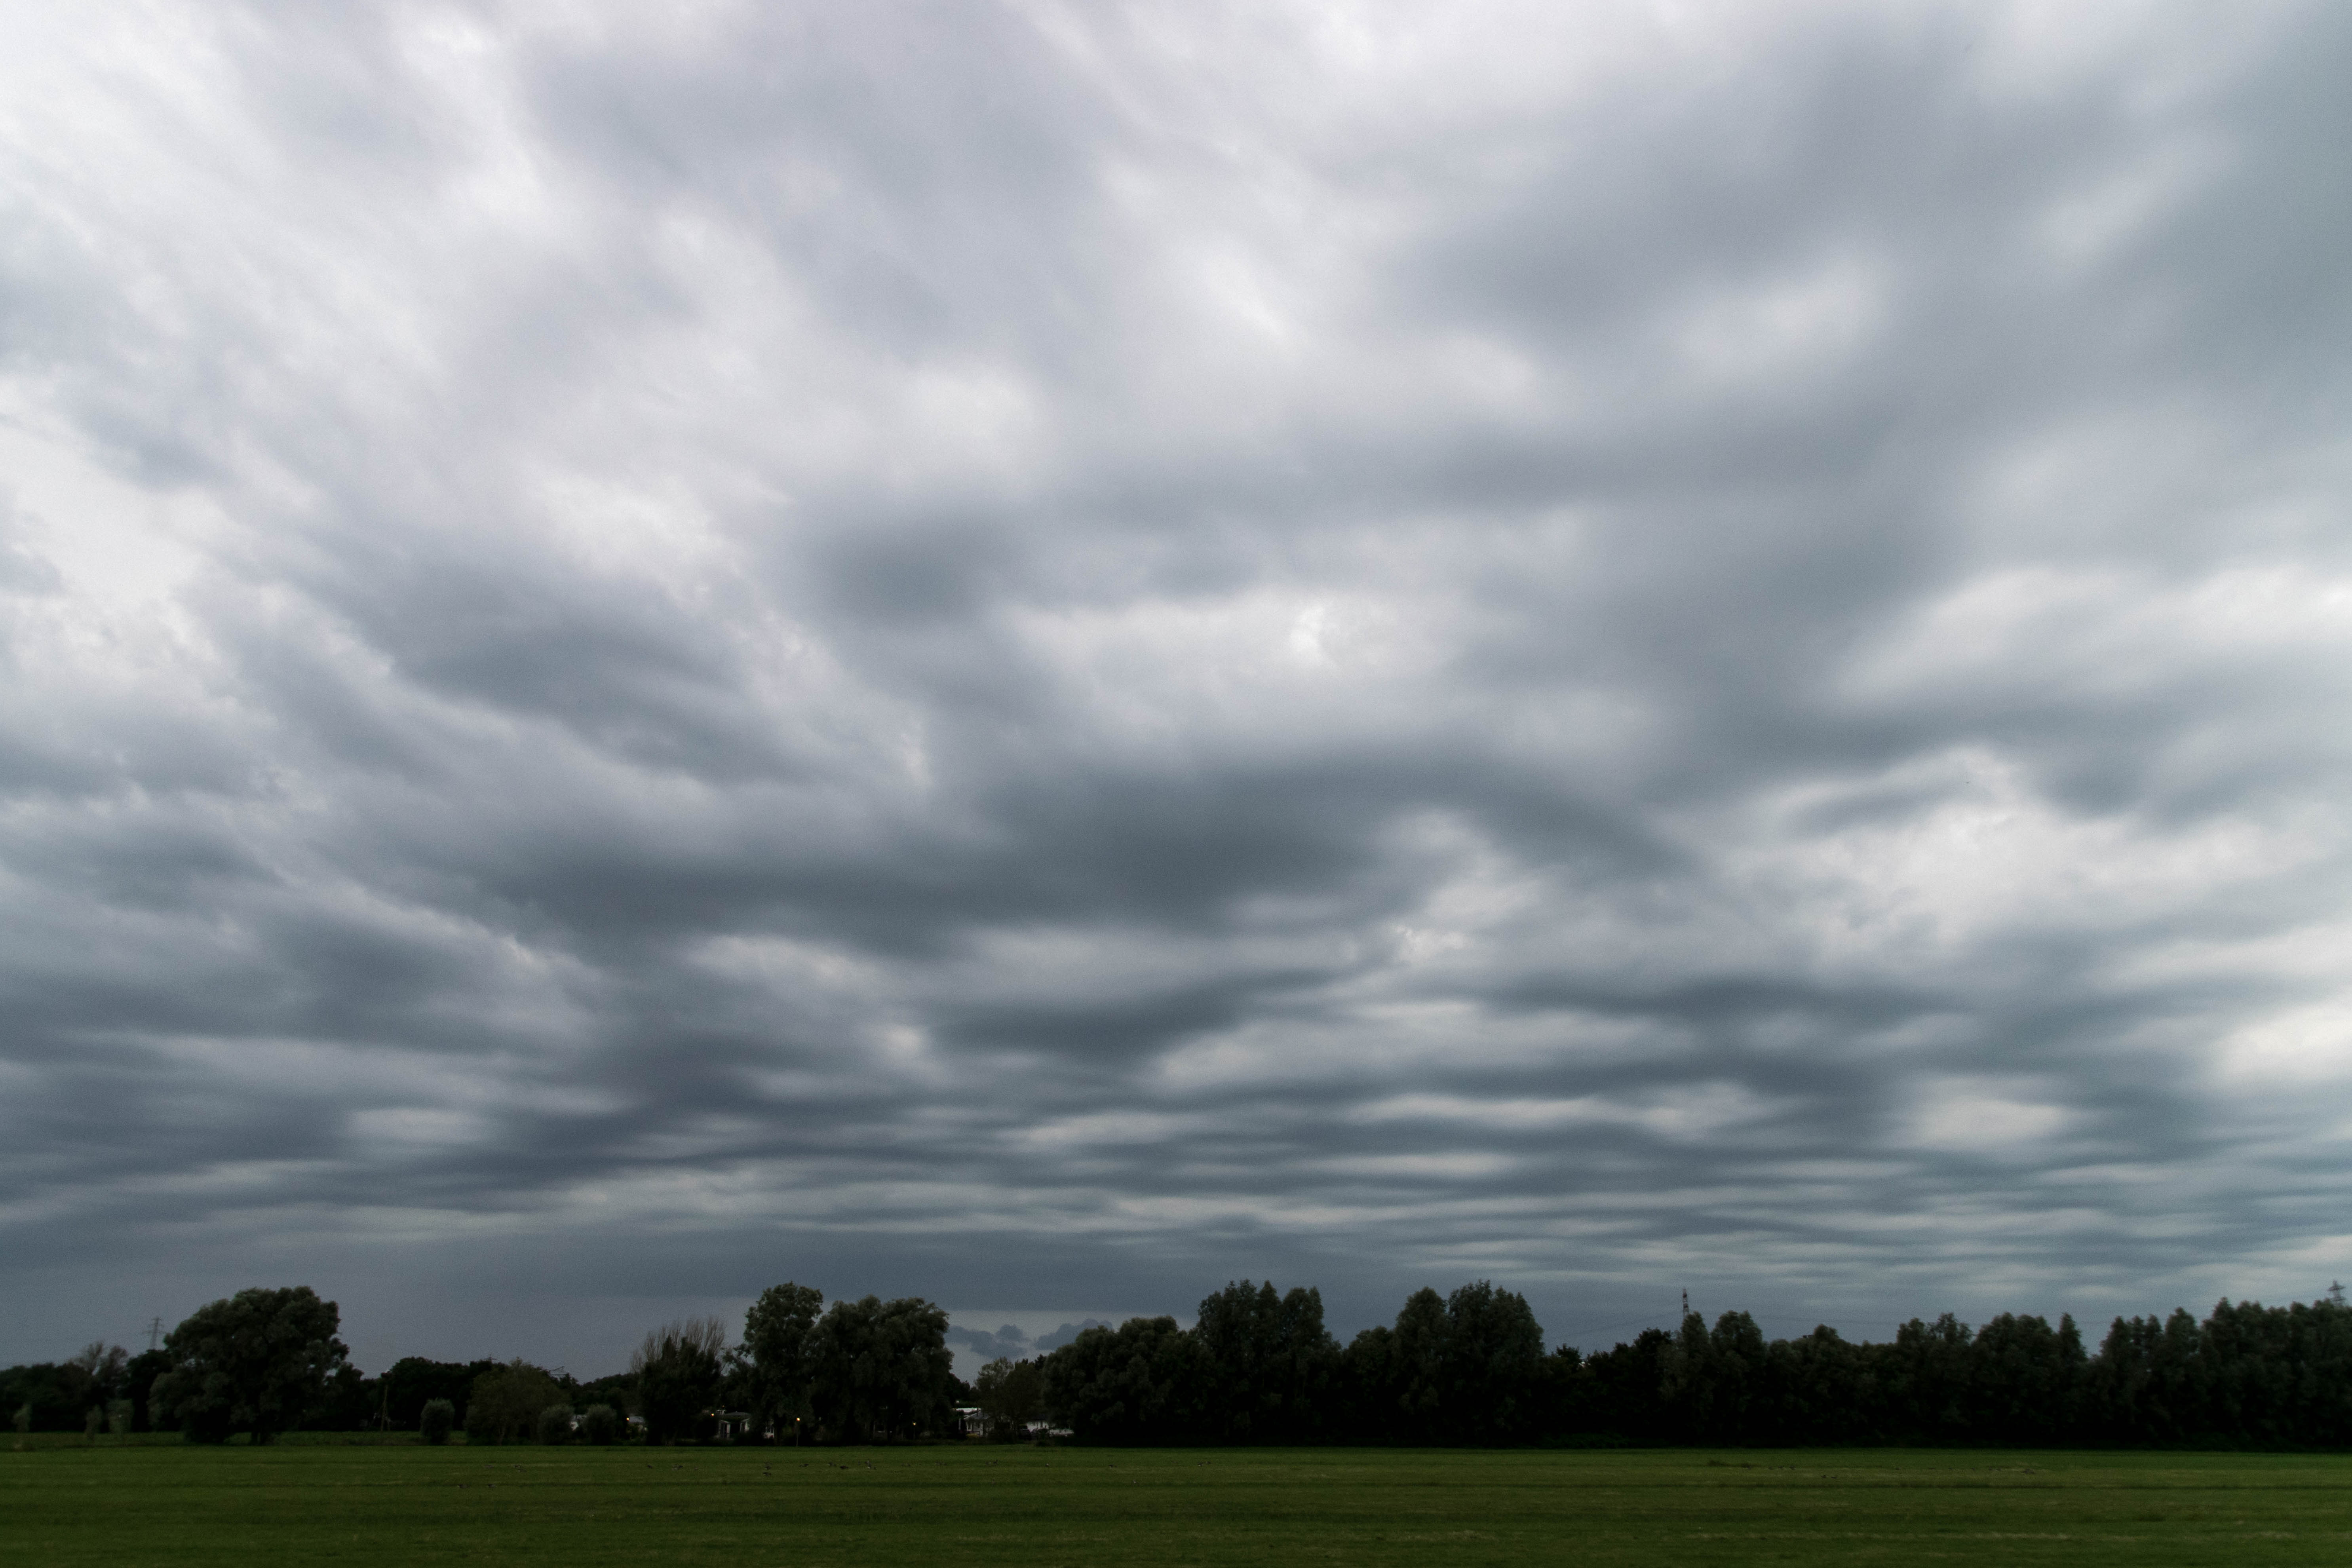
Altostratus (As)
The altostratos is a combination of “alto” which means high altitude and “stratus” which means layered in Latin. This gives us high-layered clouds:
Altostratus clouds are mostly present when a warm-front is near and coming.
Altocumulus (Ac)
The altocumulus clouds are a combination of “alto” which means High and “cumulus” which means stacked in Latin. They look like this:
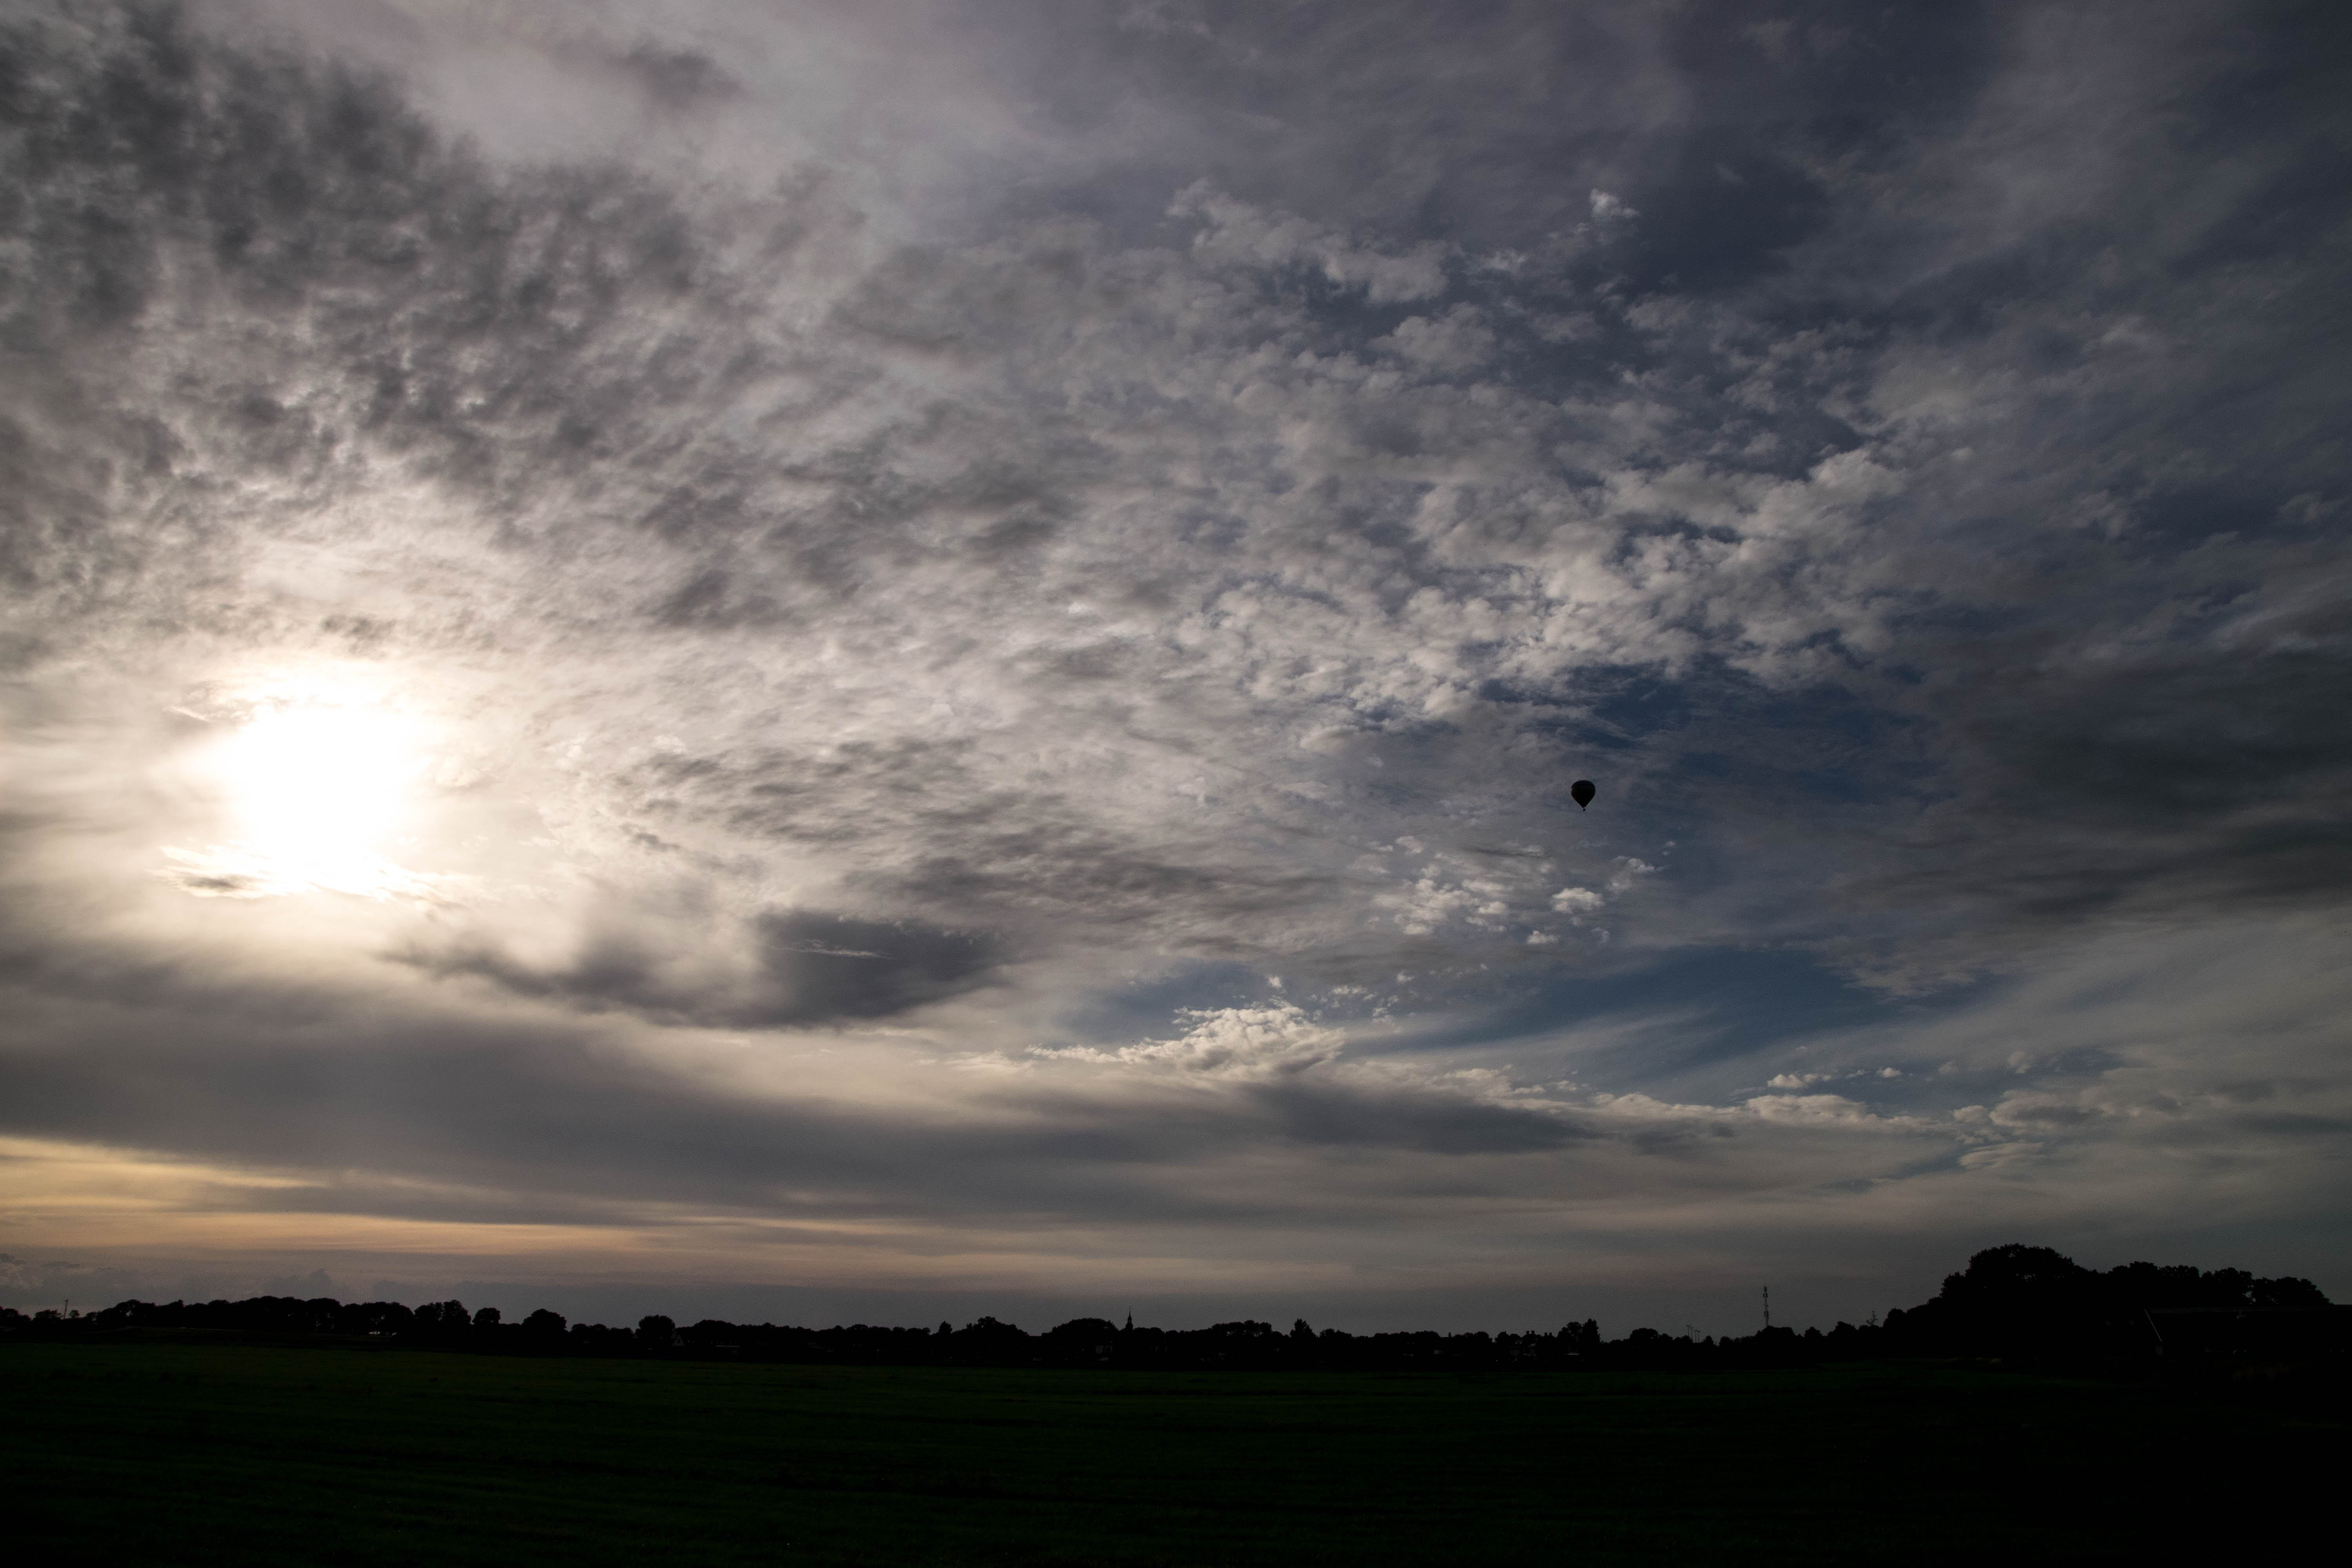
There are multiple types of clouds in this picture, but the most are altocumulus. These are the small clouds in groups. They can indicate some instability on medium height but are not a direct danger for flying VFR.
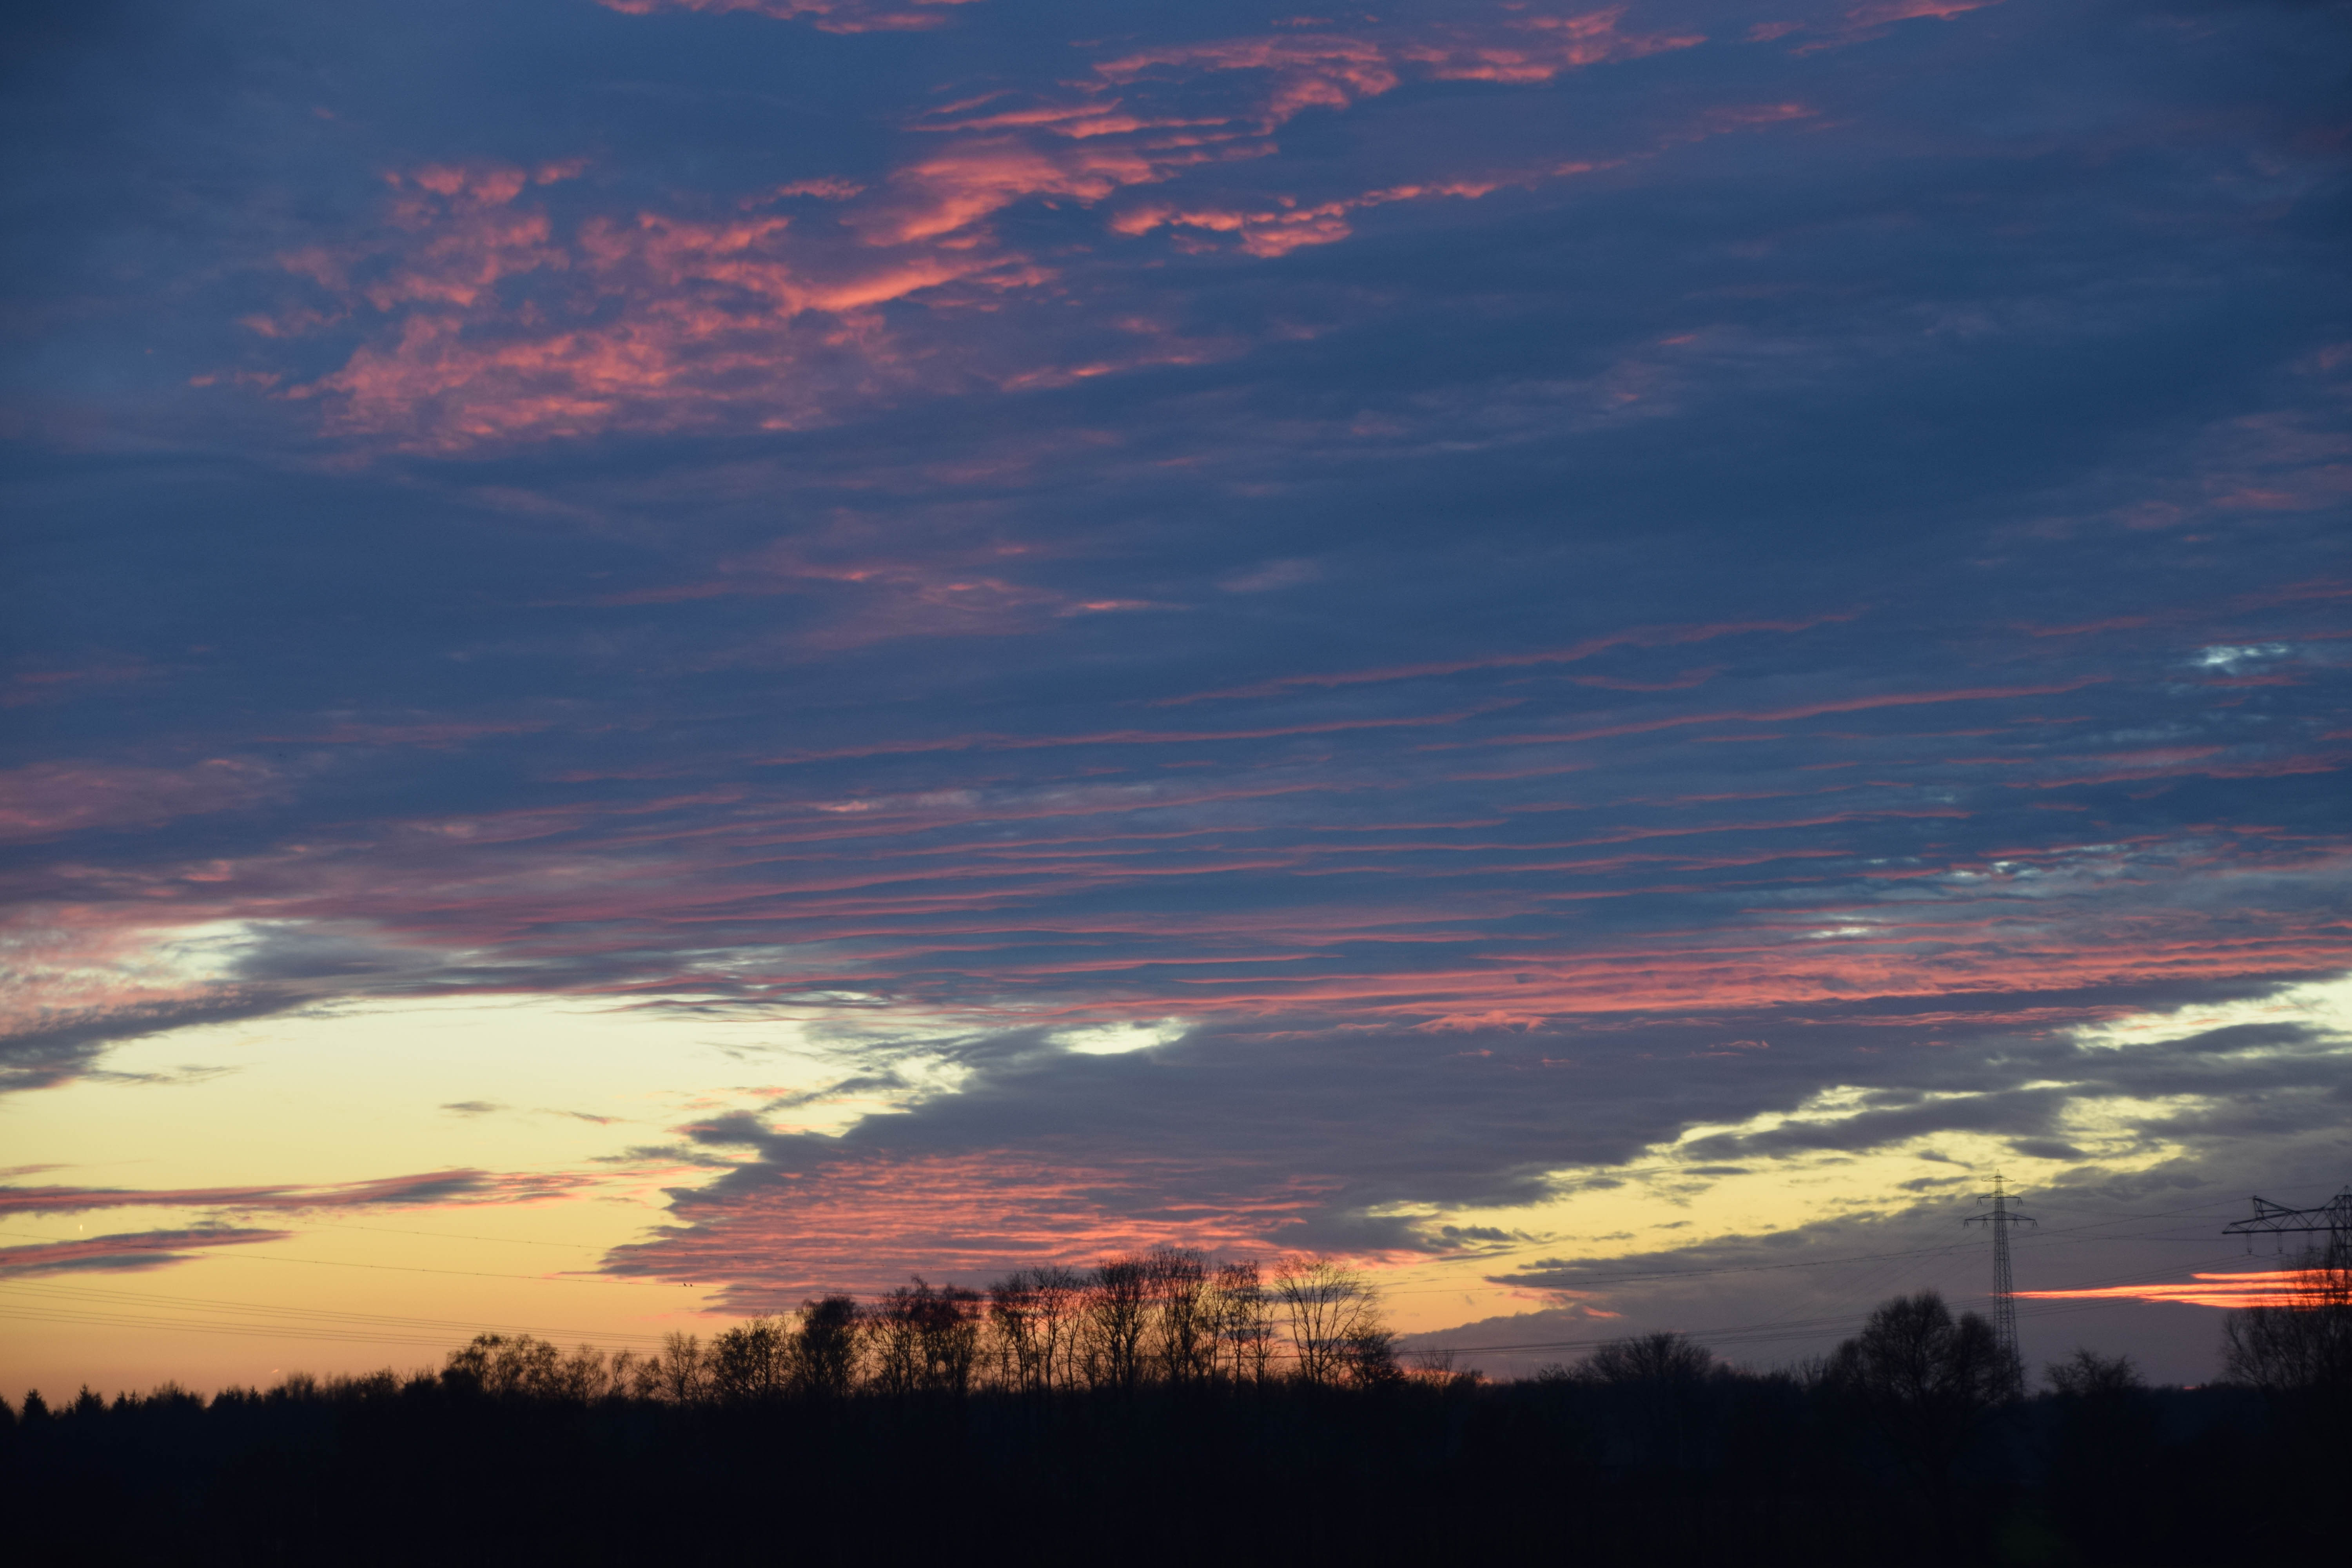
Cirrus (Ci)
Cirrus means “hair” in Latin, and are the thin and high level clouds you see often during the summer. They are mostly ice crystals because of their high altitude.
The so-called “chemtrails,” like seen in the picture above which are actually frozen water vapor resulting from aircraft burning fuel, are part of cirrus clouds.
Cumulonimbus (Cb)
The mother of all clouds, present in all 3 layers and the most dangerous clouds for the ground and aviation are cumulonimbus clouds. These can span from around 1.000ft up to the end of the troposphere and are clouds containing thunder, heavy rain, heavy winds(shear) and hail.
Here we have a big one, photographed from a plane at 37.000ft above Portugal in rain season. Not knowing about the dangers of this cloud type back then but thought it was really cool.
This second one is from a summer evening with predicted thunderstorms within an hour, but no full view of the cloud like in the first picture. Such a pretty side view of the high cloud.
In aviation, the general guideline is to stay away at least 15-20 NM from these type of clouds, even with a Airbus A380.
Precipitation and occurence
Precipitation means neerslag in Dutch and is everything that falls out of the clouds onto the ground. Think of:
- Drizzle (motregen)
- Rain
- Snow
- Snow grains (motsneeuw)
- Snow pellets (Korrelsneeuw)
- Hail (hagel)
Precipitation occurs when the cloud elements expand due to several reasons into bigger precipitation elements, which will be heavy enough to fall down due to gravity. A cloud always contains water vapor, but only when this vapor is combined into bigger water droplets, they will reach the ground.
Precipitation and cloud types
To further clarify which precipitation we could expect from a certain cloud, let’s take a look at this table:
| Precipitation type | Dutch | Cloud origin |
|---|---|---|
| Drizzle (DZ) | motregen | Stratus (St) |
| Rain (RA) | regen | Nimbostratus (Ns) or Cumulonimbus (Cb) |
| Snow (SN) | sneeuw | Nimbostratus (Ns) or Cumulonimbus (Cb) |
| Snow grains | motsneeuw | Stratus (St) |
| Snow pellets | korrelsneeuw | Stratocumulus (Sc) or Cumulus (Cu) |
| Hail (GR) | hagel | Cumulonimbus (Cb) |
Disappearing of clouds
Clouds can disappear in various ways and reasons. This is comparable to the disappearance of fog/mist.
- Raining out: The cloud can simply rain out, losing all of its precipitation components. If no condensation will happen simultaneously, the cloud will lose all its water and dissolve.
- Merging: A cloud can merge with dry air and can cause cloud elements to evaporate. This proces happens continuously because outside of a cloud, the air is not saturated. The outside of a cloud is always more dry and stopping the condensation process can help dissolving the cloud.
- Heating: A cloud can also dissolve due to heating up. This helps lower the relative humidity in the cloud, and mostly will happen due to sunlight heating up the earth, and that warm air rising. This happens mostly for low-level clouds. Clouds in a high pressure area can also dissolve due to subsidy, causing adiabatic heating to dissolve the cloud.
Cloud base and coverage area
For describing the cloud base in aviation, we use 3 terms:
- Type of clouds
- Coverage
- Cloud base altitude (AGL)
Cloud coverage
We use a coverage called in octa’s, where a visual viewer/system will look into the air and divides it into 8 parts. Then it determines how many parts are filled with clouds and makes a representation:
| Code | Term | Sky condition | Okta range |
|---|---|---|---|
| CLR | Clear | Clear sky | 0 |
| FEW | Few | Nearly clear sky | 1–2 |
| SCT | Scattered | Partly cloudy | 3–4 |
| BKN | Broken | Mostly cloudy | 5–7 |
| OVC | Overcast | Fully overcast | 8 |
Cloud base
The cloud base is the altitude above ground level (AGL), mentioned in feet (ft). This will be the lowest cloud layer.
The cloud ceiling is the altitude (below 20.000ft)which covers more than half of the sky, so broken clouds (BKN) or overcast (OVC).
If the sky cannot be seen due to fog or mist, there will be a vertical visibility mentioned in feet. This can be measured or estimated.
Cloud types
In the METAR of an airport, the cloud types itself will only be mentioned if significat, like a Cumulonimbus (Cb). The cloud types are used in meteorological messages like in the Dutch general aviation weather bulletin: https://www.knmi.nl/nederland-nu/luchtvaart/weerbulletin-kleine-luchtvaart
Thunderstorms
Thunderstorms is a phenomenon that brings huge dangers for aviation. Thunderstorms only exists in cumulonimbus clouds which bring huge rising and descending winds, turbulence and heavy rain or hail with it. The biggest threat is a thunder strike into the plane, where risks of fire or blindness can occur.
The Netherlands knows around 25 thunderstorm days per year, espexcially over land.
Cumulonimbus clouds are built upon cumulus clouds in a unstable atmosphere which can continue to grow up. We have a towering cumulus cloud type, this is a beginning stage of a cumulonimbus (Cb) which can also be seen as altocumulus castellanus (Acc), which happens with instability on mid-level. This looks like this:
You will see in an nutshell where this name comes from, a castle wall.
Thunder is a electric load from a cumulonimbus cloud. This phenomenon happens when the mass will hit the ground resulting in a flash and a very loud and sharp sound.
Layout of thunderstorms
The layout of a thunderstorm is like how the air movements will be started:
- Frontal thunder: When air passes a front and is forced to rise, thunderstorms can occur if the air is humid enough and the atmosphere is unstable. This can occur in a cold or warm front
- Orographic thunder: Orographic thunder occurs from the forced rise of air over a mountain
- Air mass thunder: Air mass thunders are thunderstorms that are not caused by front passages. During the summer, the high levels of convection in a unstable atmosphere this type can occur. Especially above area’s of high levels of heating like sand grounds. This type is a great example of the heavy storms at the end of a warm and sunny day.
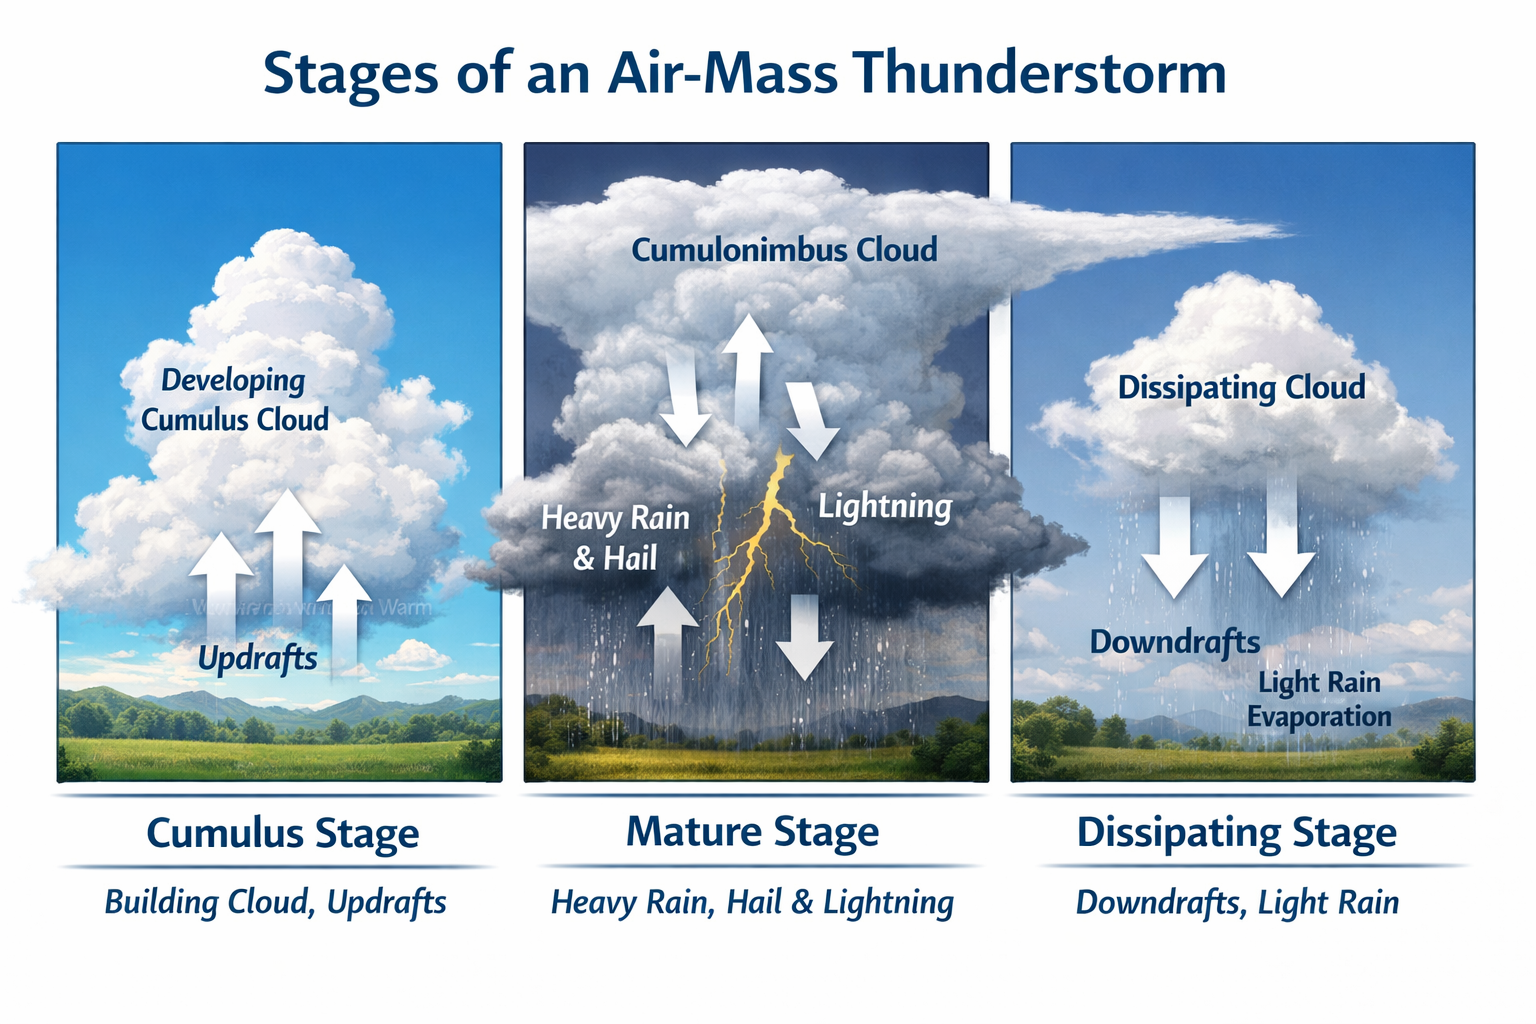
Developement stages of a thunderstorm
A thunderstorm knows 3 stages:
- Cumulus stage (beginfase): Here the cumulus cloud will be expanded due to the rising air. This is only a water-cloud. If this reaches a great altitude, this will be mentioned in the weather reports as towering cumulus. A begin stage of a thunderstorm, with lots of updrafts (convection)
- Mature stage: At the mature stage, the cloud will pass over the 0 degrees celcius point up in the air and the cloud has merged. In this stage, you can expect heavy rain, hail and thunderstroms, and the cloud is a passage for heavy winds from up in the air which is called updrafts/downdrafts
- Dissipating stage: At this stage, the downdrafts will be the boss and because of this, updrafts will be suppressed. This stops the vertical flow of warm humid air and this is the beginning of the end of the thunderstorm. The cloud will rain out till the water is depleted, but the top of the cloud (anvil) can exists for several hours after this, as this is a cirrus cloud, containing ice crystals
The weather during thunderstorms
As the thunderstorms will occur during a unstable atmosphere, you could predict that the weather itself can also be a bit unpredictable.
During thunderstorms, you can expect these types of weather:
- Heavy amounts of precipitation
- High winds and turbulence, with windshears and a high frequency of gusts
- Variable winds as big as 360 degrees difference
- Lots of downdrafts and downbursts of thousands of feet per minutes (a Cessna 172 climbs normally between 700/1000 feet per minute, to give a scale)
- Squalls, which are heavily increased winds minutes before a thunderstorm reaches you
Visibility and fog (10)
In VFR flights where we fly inder Visual Flight Rules, pilots must remain direct sight on ground and water. This is dependent on how many visibility we have in the cockpit, as we have to avoid other traffic. In aviation we can use different terms to describe the visibility:
- Flying visibility (vliegzicht): The visibility from the cockpit
- Ground visibility: The visibility as seen from the ground/tower
- Runway visibility (RVR): On bigger aerodromes, the RVR will be reported under 2000 meters
Visibility direction
The visibility is not always exactly the same in various directions, due to fog or other phenomenons. This can also be reported in different terms to give the pilots a better understanding to avoid assumptions leading to accidents:
- Prevailing visibility (overheersend zicht):This is the value of visibility over at least 50% of the horizon
- Minimum visibility: This is a visibility measurement where the direction of sight is added to, for example 1800SW: this means 1800 meters in south-western direction
Measurements and instruments
To save a lot of time for airport-associates, most measurements are done automatically by instruments. Runway visibility is measured by transmissometers next to the runway, where the visibility can be seen live within seconds. However, intrepretation of automatic systems must be considered if we want to believe this 100%.
Flying visibility
The regulatory visibility for VFR is described in the rules of air space classes. The visibility for VFR that is very important is the slant visual range. This is the line of sight in front of our plane, where we look to the ground. However, when some haze, mist/fog or brume exists, this can decrease drastically.
Mist and Brume occurs
Mist and brume occurs by colling air without any vertical movement. Mist/fog will be categorized into the origin of cooling:
- Cooling at cool surface
- Merging
- Evaporation
Radiation fog
In clear nights, the surface of the earth will cool down by heat-radiation. The air above will also cool down, sometimes even lower than the dew point. This results in condensed water vapor and this is called radiation mist. This can beup to 1000ft high, but also around 2 meters high. Then it will be called ground fog.
Advective fog
Cooling at a cold surface can happen when warm humid air will flow to an aera with cold underground. This fog will be advected. This mostly happens during winter, after a period with frost ends by a new flow of air with relative warm and humid air. This is the warm mass.
Above the sea, this type of mist is called sea mist.
Fog by merging
Merged air can also cause mist
Evaporation fog
Fog can also occur by evaporation of rain. The rain increases the humidity in cold air and this results in rain-mist.
Dissolving mist
The dissolving process of mist is exactly the same as with clouds, they can dissolve in three ways:
- Heating and therefore evaporating the moist
- Merging with dry air, lowering the dew temperature
- Rain out
Mist vs Fog vs Brume
Mist, Fog and Brume are all terms that sounds like they mean the same, but we consider them partly different:
| Dutch term | English term | Cause | Visibility |
|---|---|---|---|
| Mist | Fog | Water droplets | < 1000 m |
| Nevel | Mist | Water droplets | 1000–5000 m |
| Heiigheid | Haze | Dust particles | < 5000 m |
Fronts (11)
Fronts are different weather systems that collide with each other. On a location where two different masses (with different temperatures) of air will collide, there will be a transition zone which is called a “front”. A front is often referred to a zone with clouds and precipitation and therefore relevant for aviation. The weather conditions in a front are dependent on the temperature differences between the air masses, where we have some terms for:
- Active fronts: these fronts consists of huge temperature differences
- Inactive fronts: these fronts constst of low temperature differences
Here active fronts will let you know that they are there with lots of rain and maybe thunder where inactive fronts often go by unnoticed.
Types of fronts:
We can have multiple types of fronts, as illustrated below. The most important types are:
- Warm front
- Cold front
- Occluded front
- Stationary front
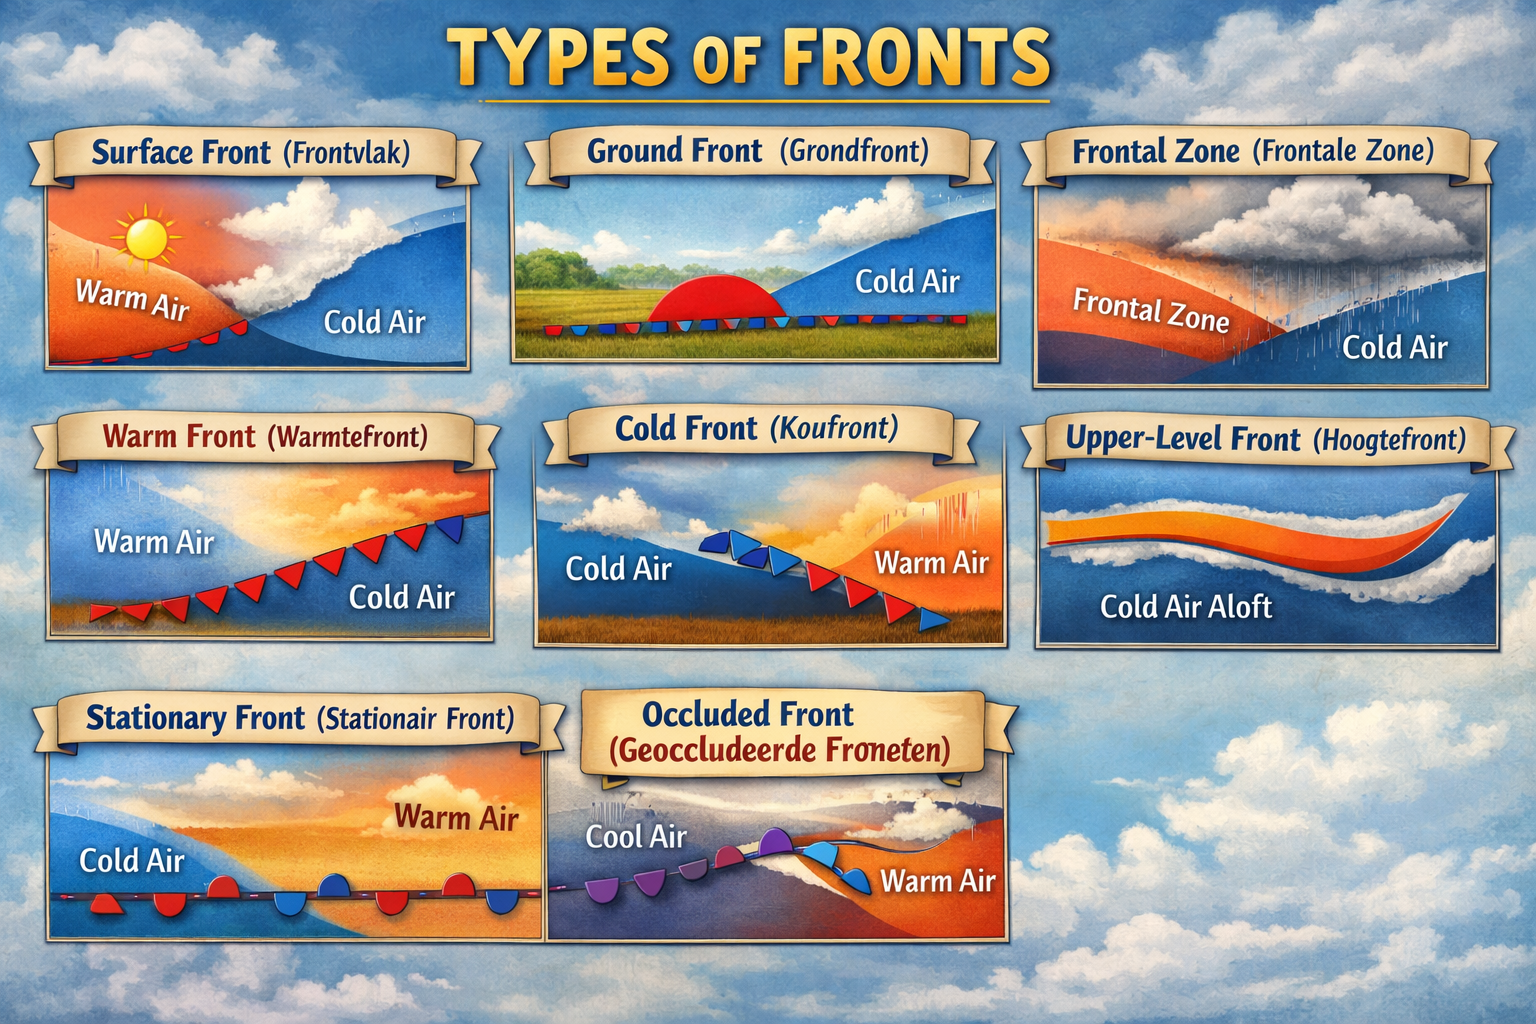
Fronts mostly consists of these components:
- Surface front: This is the separation layer, the line between multiple fronts
- Ground front: This is the separation layer, but then on the ground directly under the surface front
- Frontal zone: This is the zone of a front as this can be up to 100km in size
Fronts in meteorologic charts
On charts, fronts will be indicated as lines with different symbols on them, mostly as seen in the picture above about fronts them selves.
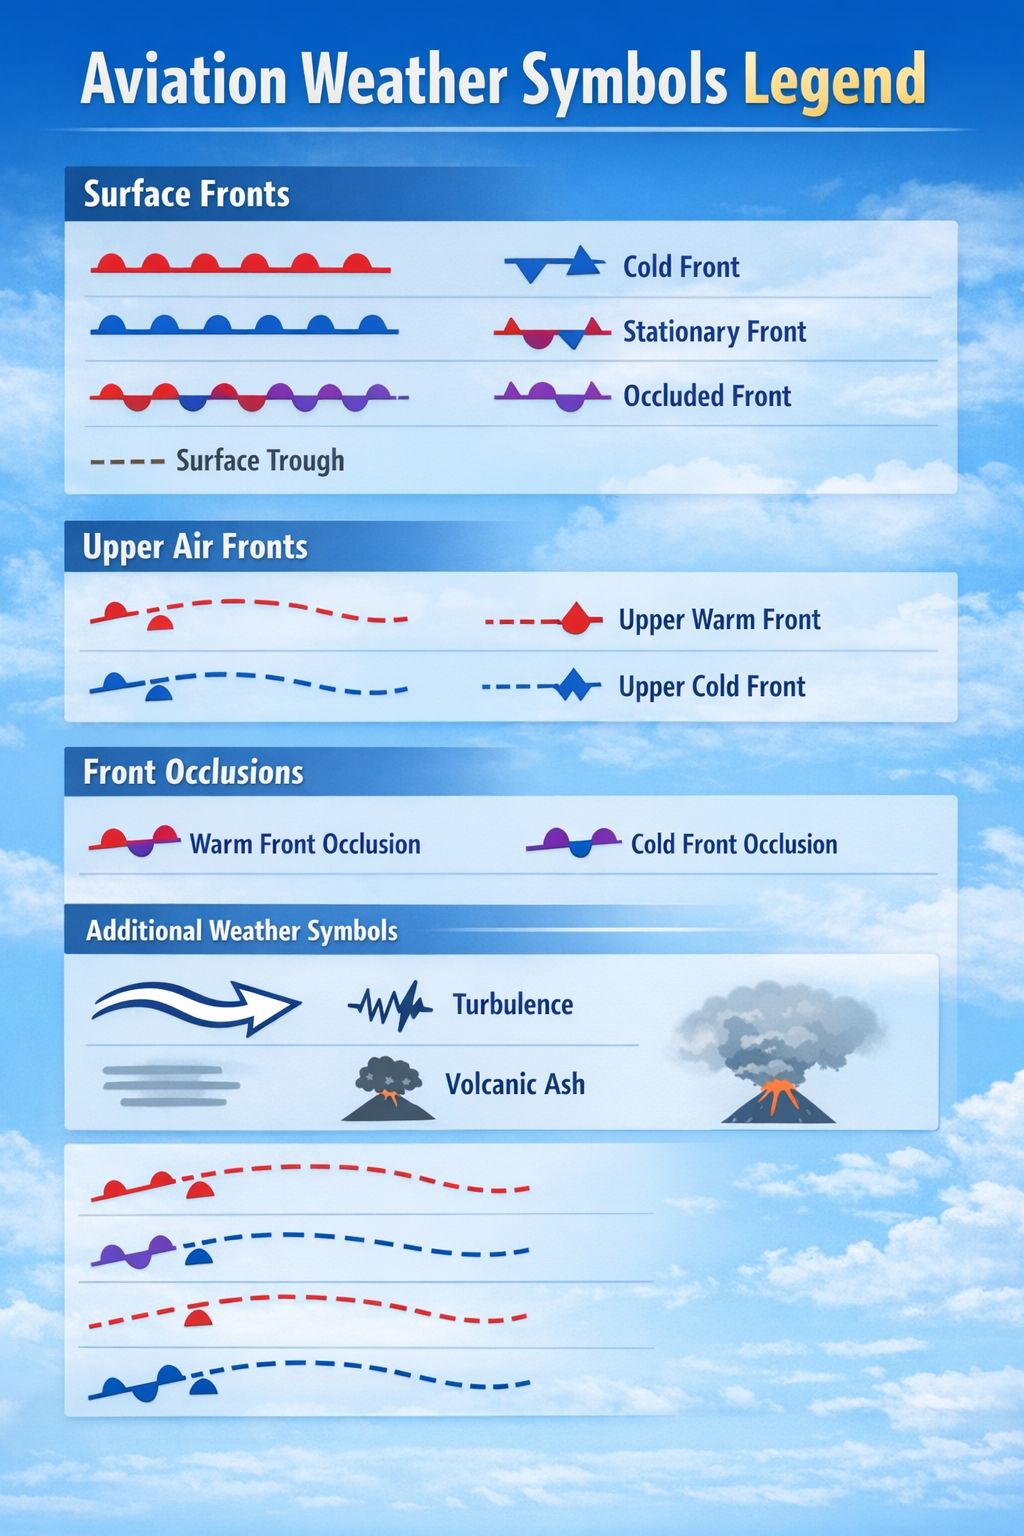
Note: the high level/upper air symbols will not be filled, so the middle should be white.
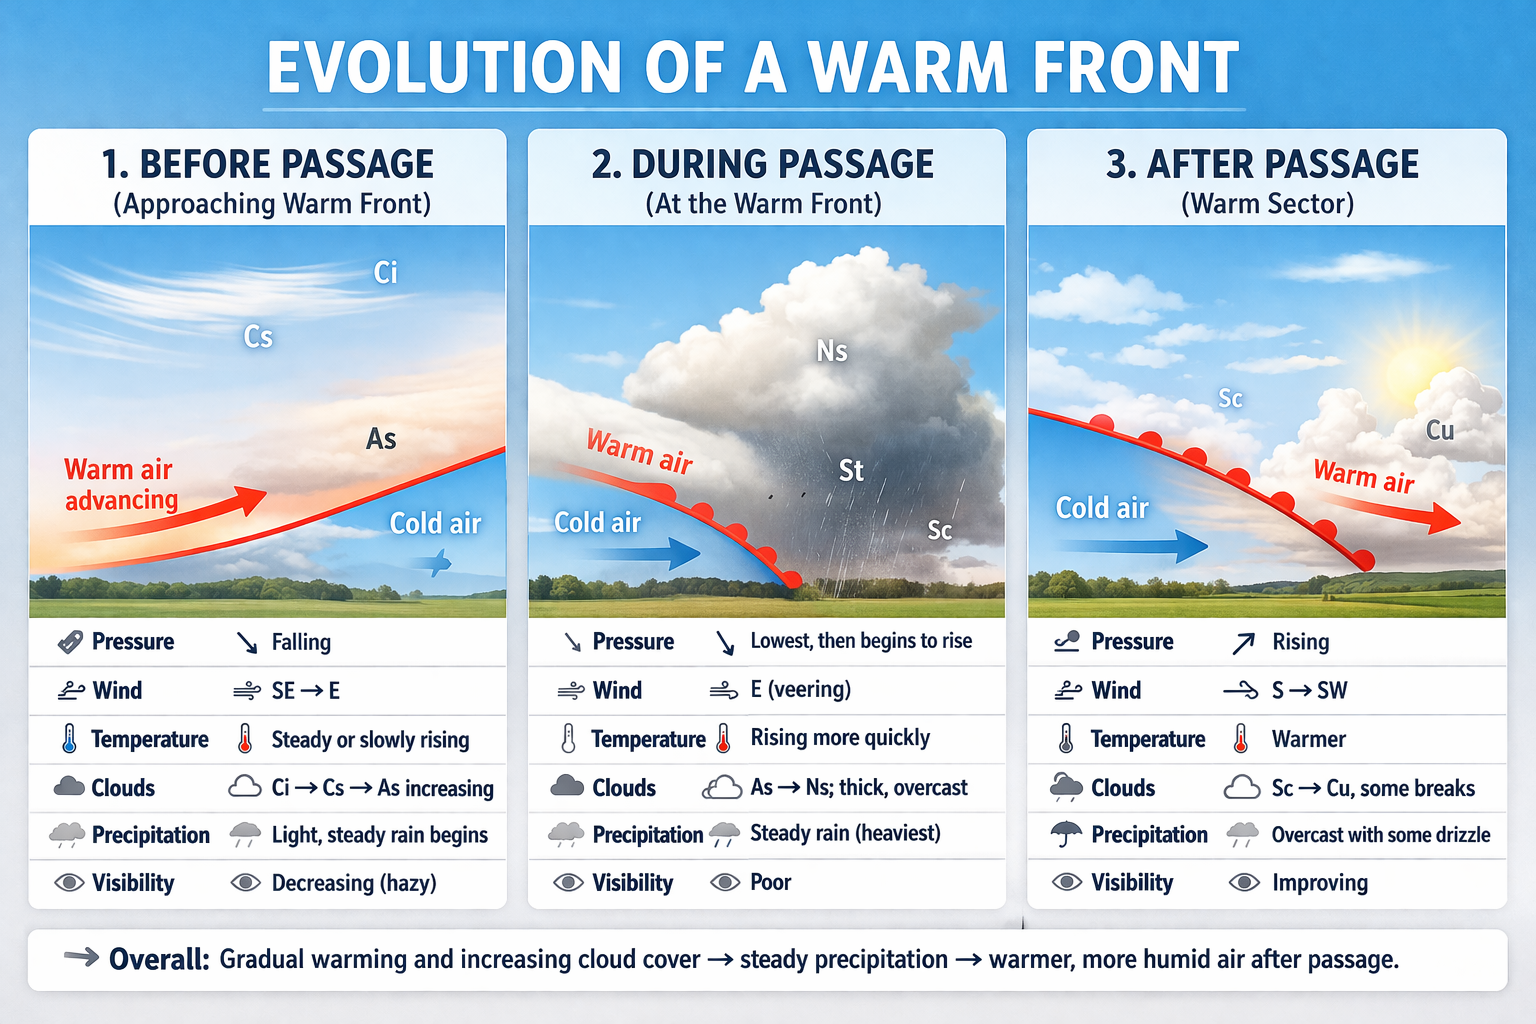
Layout of a warm front
Warm air is lighter than cold air. The warm air mass will flow above the cold layer. This flowing warm air will merge with the cold air and will pull up the air, till the cold air dissappeared. This merge with the forced rise of warm air causes cooling and condensation and can cause clouds and precipitation.
As the rising movement of warm air to the surface front, this will cause condensation. This is the reason why the whole front contains closed clouds:
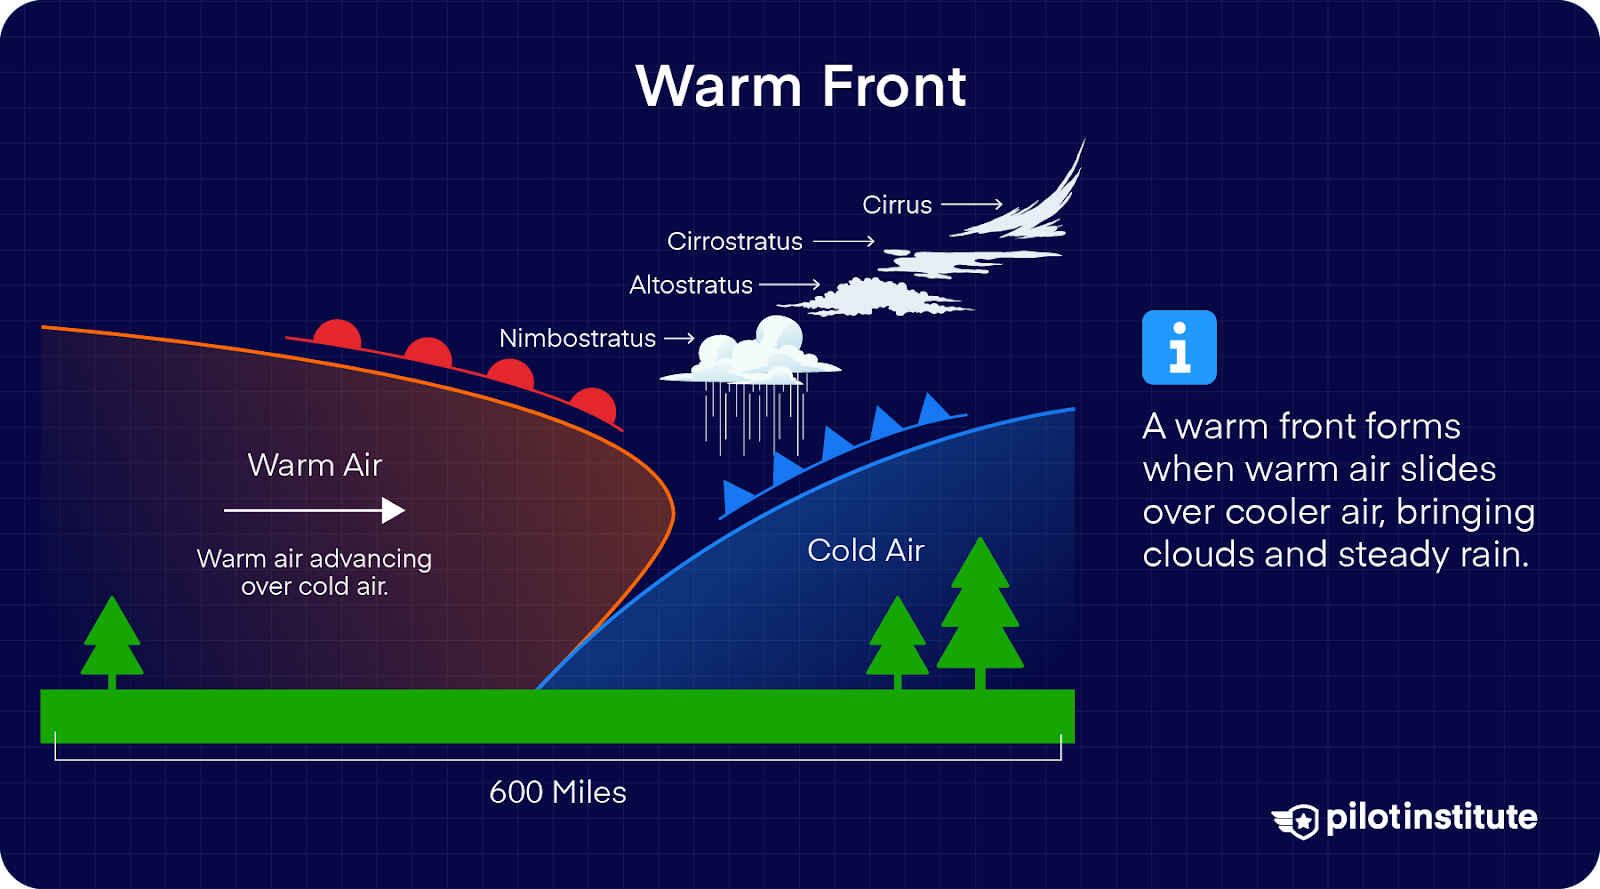
Source: pilotinstitute.com
Details:
- Precipitation with poor visibility (drizzle)
- Haze
- Pressure rises at arrival, and decreases after passage
- In summer this can cause cumulonimbus
- Wind veeres and increases after passage
- Low turbulence
Such warm front which is stable is a package of cirrus clouds, followed by cirrostratus, then altostratus and then nimbostratus, containing rain. This can also contain a hidden Cumulonimbus, which we call embedded Cb’s.
If the warm front arrives, you will start seeing some cirrus clouds, then some rain and visibility and air pressure will decrease. The winds will increase.
A warm front is slow and therefore is a period with some days of no VFR flying.
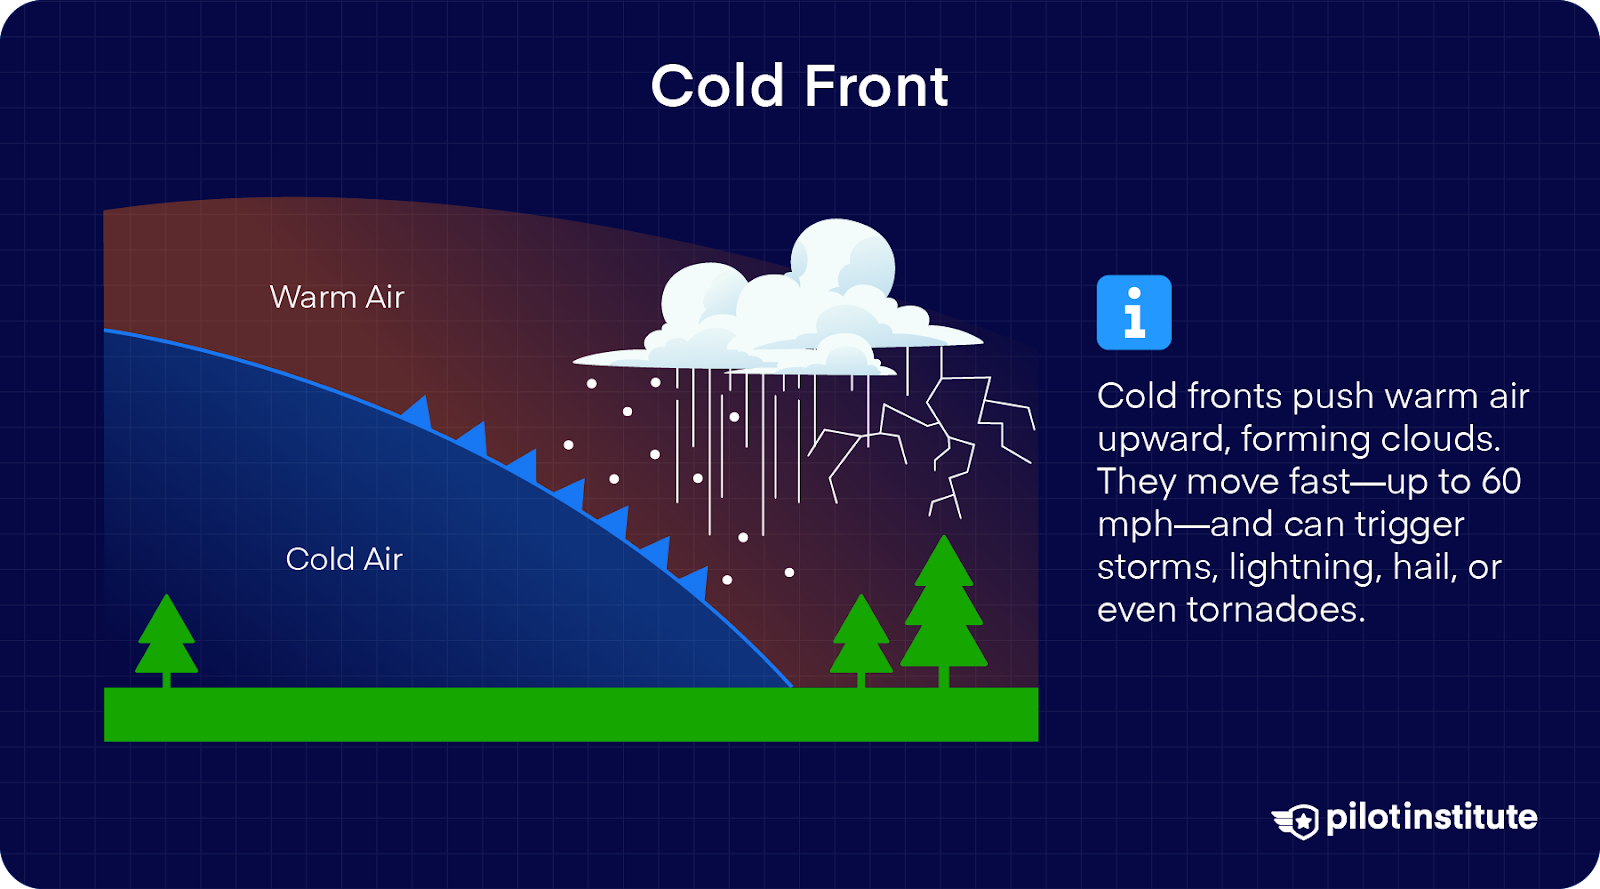
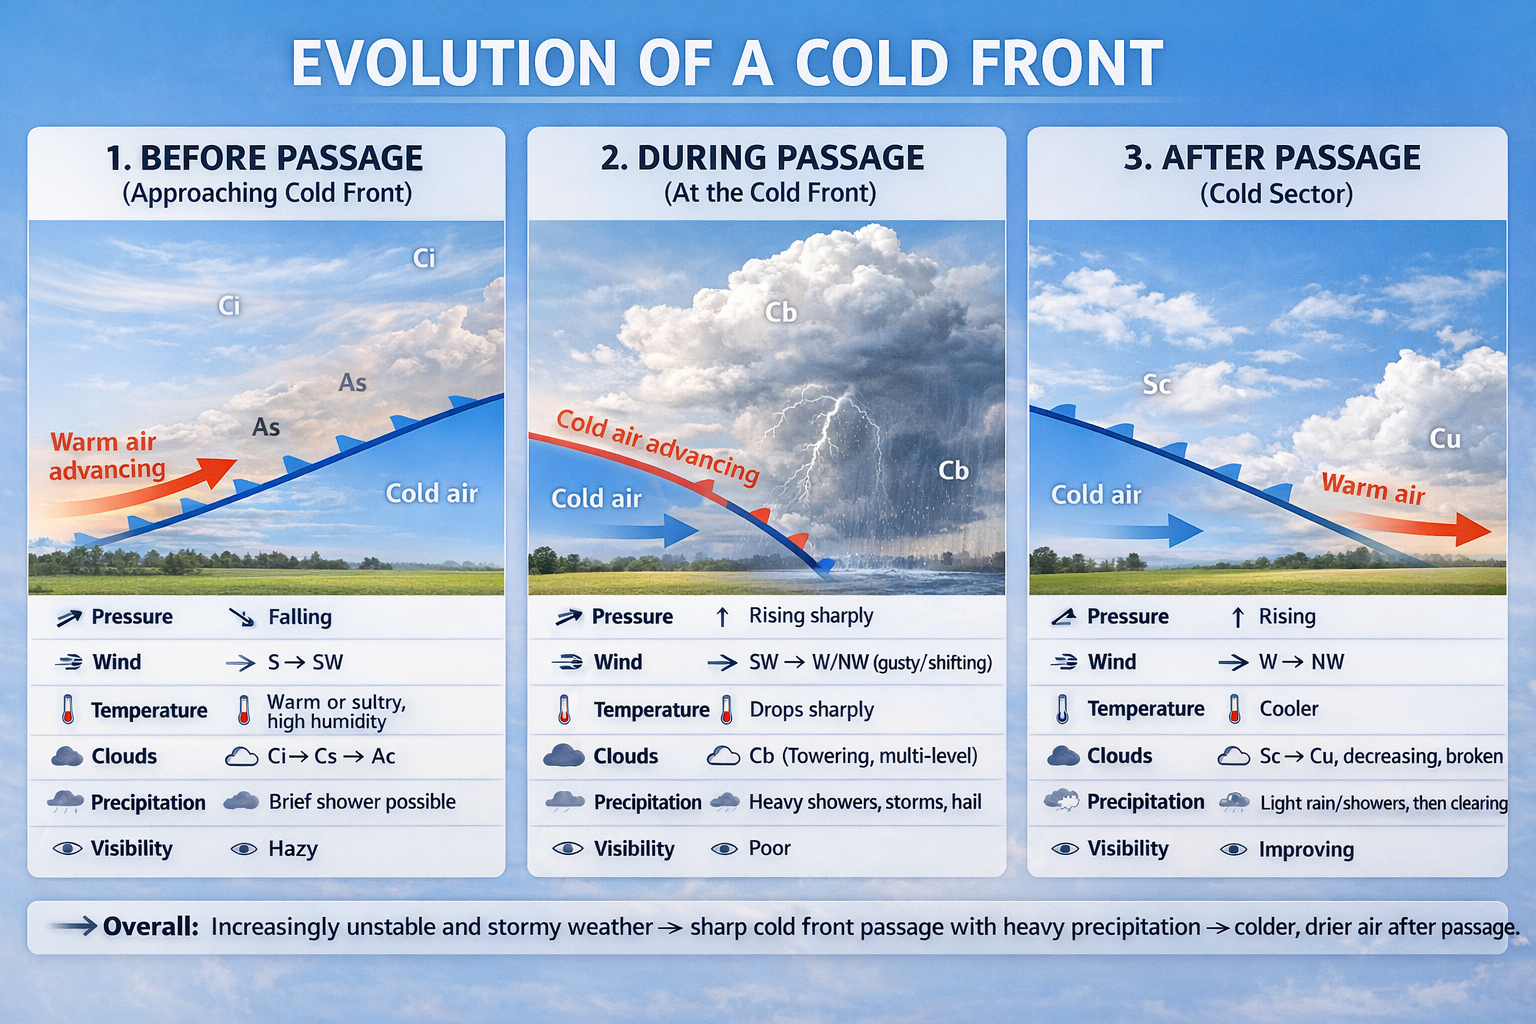
Layout of a cold front
Cold air is more dense and heavier than warm air, which causes cold air to displace warm air first at the ground. Just like the warm front, the cold front will move in the direction of the cold air.
Source: pilotinstitute.com
Details:
- Pressure decreases at arrival, increases after passage
- Wind increases and veeres after passage
- Good visibility (when no precipitation)
- Moderate to heavy turbulence and wind shears
The slope of the cold front is much steeper than the warm front. A cold front is also much faster than a warm front, passing by at a higher speed. However, cold fronts can be more dangerous as the warm air causes clouds to rise, causing towering cumulus clouds which can evantually grow into the dangerous cumulonimbus clouds.
A cold front tends to stay at ground level, pushing the warm and moist air up. This creates instability and causes the air to reach its dew point and condensate.
If a cold front arrived, the air pressure will drop, the wind will increase. Then the clouds will increase too.
Stationary fronts
Stationary fronts will stay at a certain position or will move very slowy. Sometimes even slower than 5 knots. There will be no movements, only parralel to the front. This can cause long periods of bad weather, due to the slow speed.
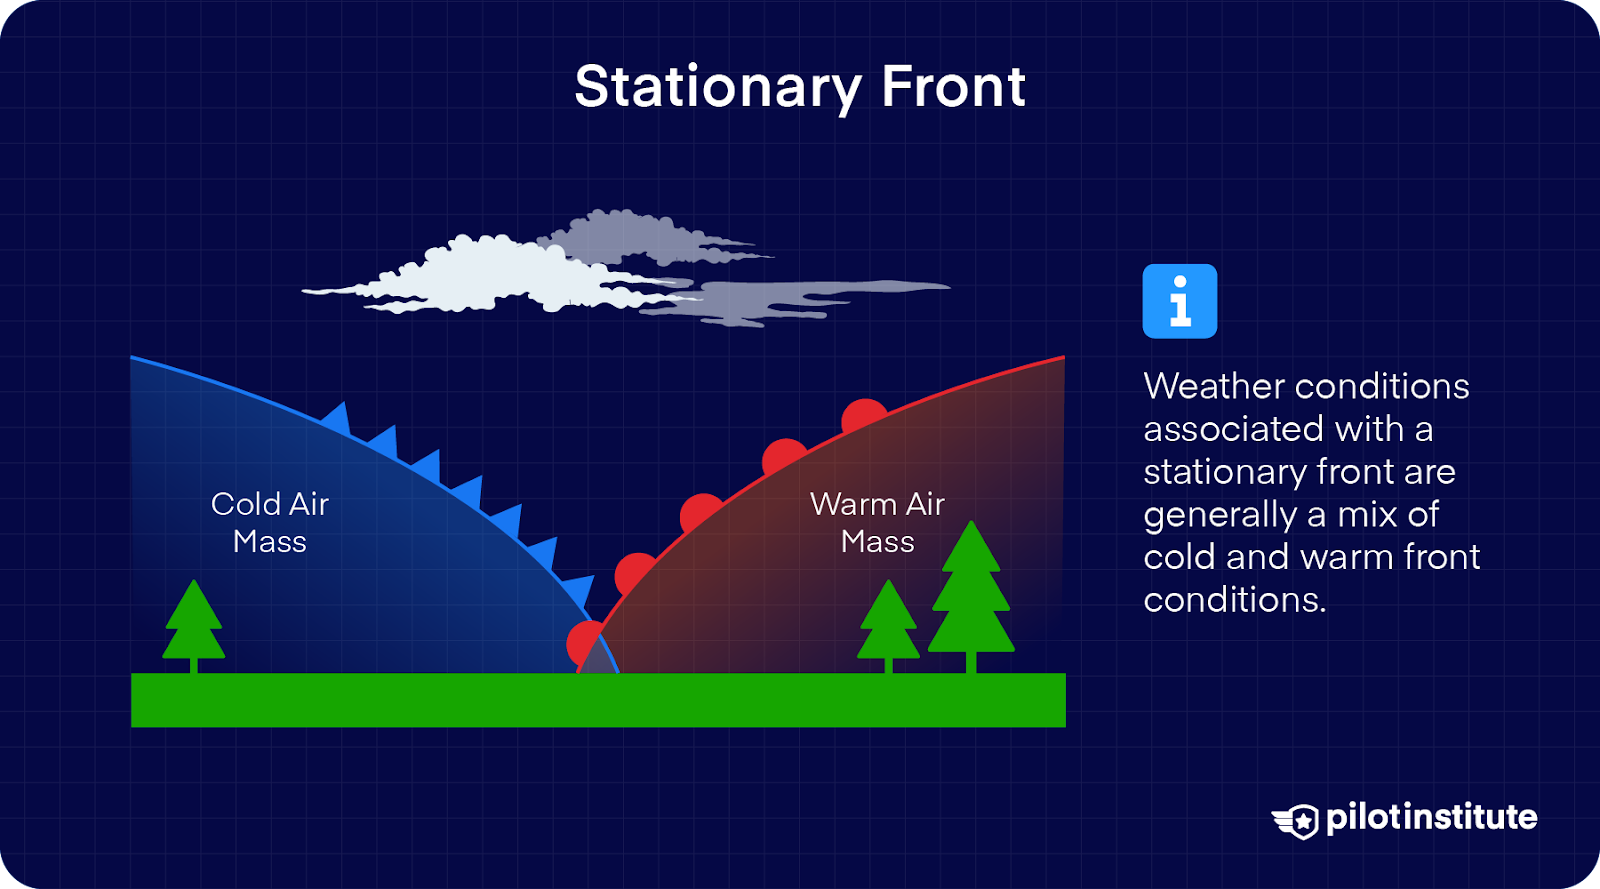
Source: pilotinstitute.com
A stationary front contains weather conditions of both warm and cold fronts and can take up several hours to days.
Winds mostly blow the way the front lies. Not from cold to warm or reverse.
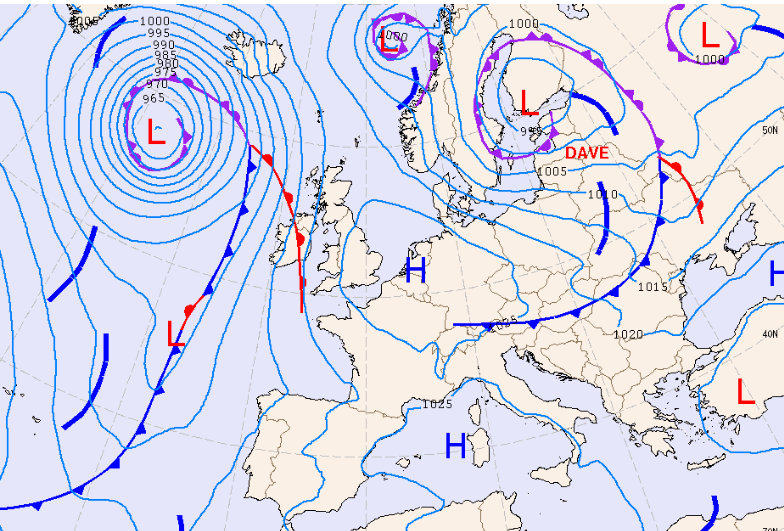
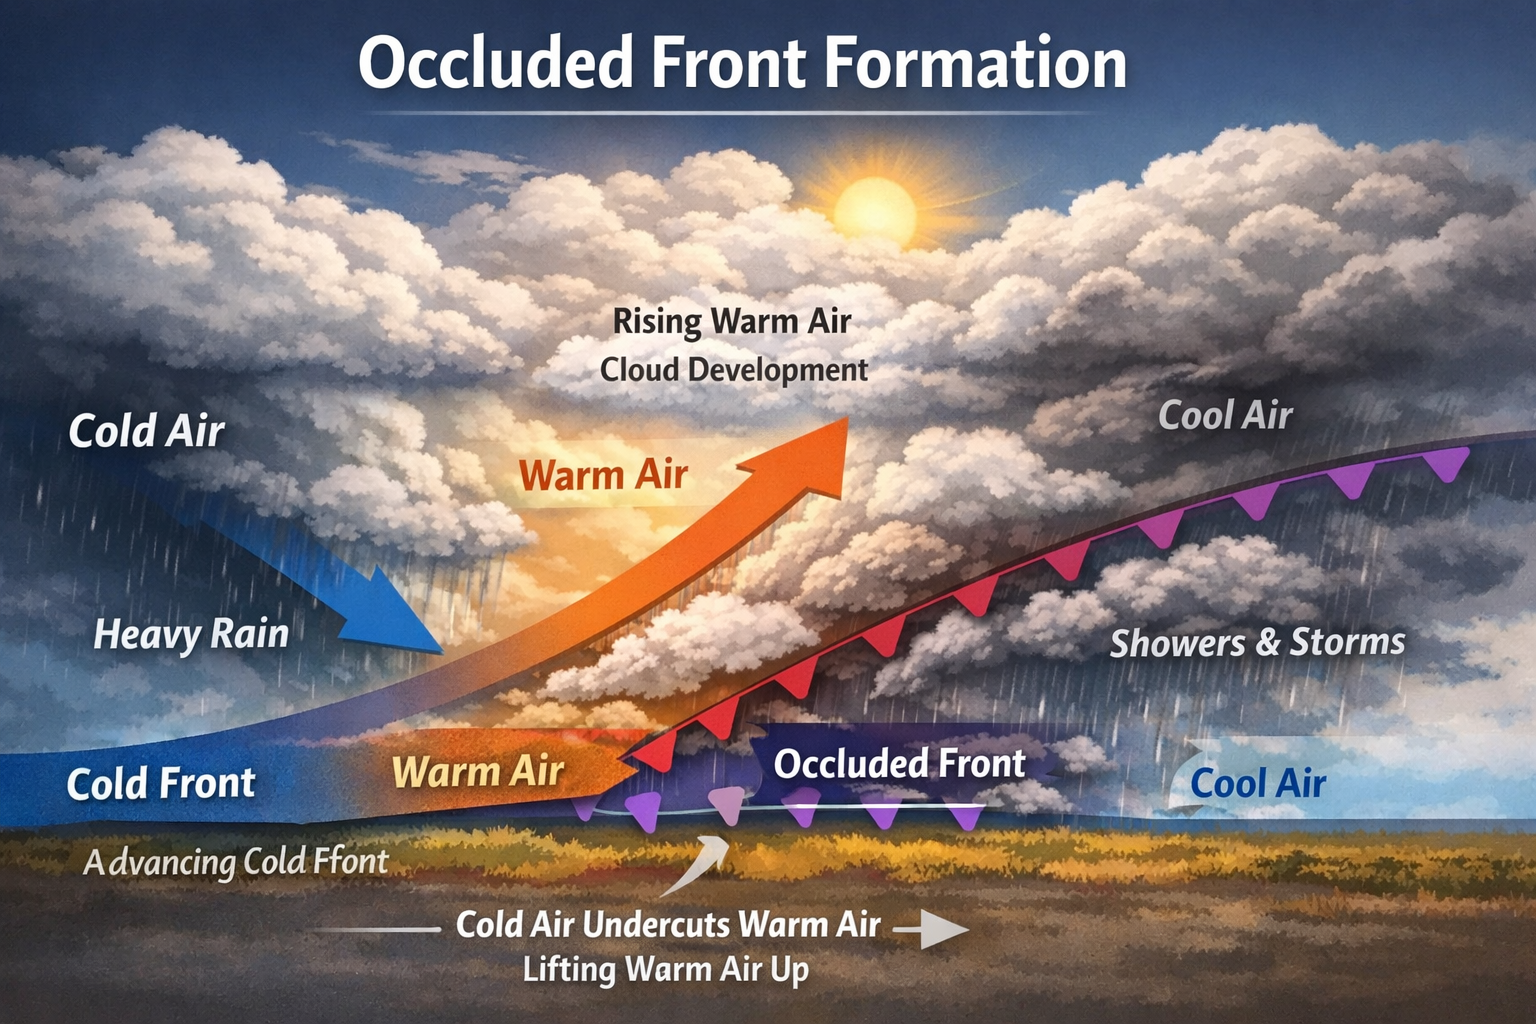
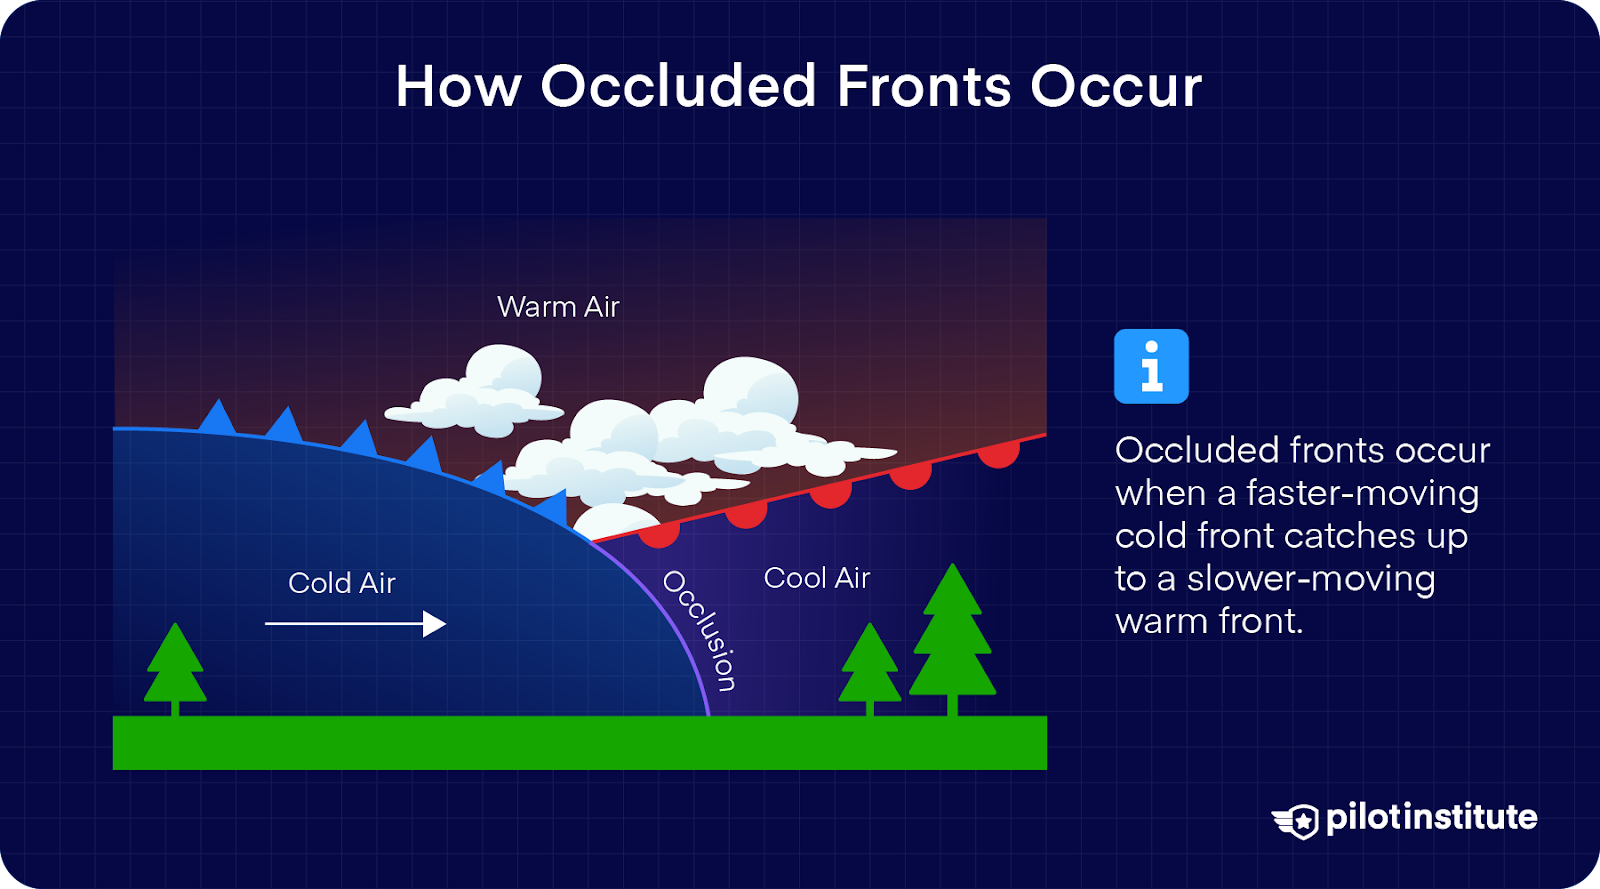
Occlusions
Occluded actually means “hidden”.
Occlusion is where a cold front catches up with a warm front. The warm air is forced to rise off the ground, and the system becomes dominated by cooler air at the surface. This often leads to widespread cloud, steady rain, and sometimes stronger winds near the low-pressure center.
A classic example is a mid-latitude cyclone over northwestern Europe. For instance, when an Atlantic low moves toward the UK or the North Sea, the faster-moving cold front can overtake the warm front. As the occlusion forms, people often experience a long period of thick cloud, persistent rainfall, falling visibility, and a noticeable wind shift.
Then we can have cold front cllusions and warm front occlusions:
- Warm front occlusions: Looks like a line with open red hemispheres on one side and closed red hemispheres on the other side
- Cold front occlusions: Looks like a line with open blue hemispheres on one side and closed blue hemispheres on the other side
Upper-air fronts
We speak of a upper air front if the front-surface is only at high levels and not on the ground. This can occur when a front at the ground dissolves and turbulence merging different masses of air. This can also happen in mountain-rich areas.
Polar fronts
Weather in Europe will be dependent on two big masses of air, polar air from Greenland and tropical air from the Azores islands and north Africa. The transition layer of these two masses is the polar front, just where West europe is. In the summer, this front can be found at latitude 60 north, where Iceland and Sweden are and in the winter at 50 degrees, the line of Netherlands and England.
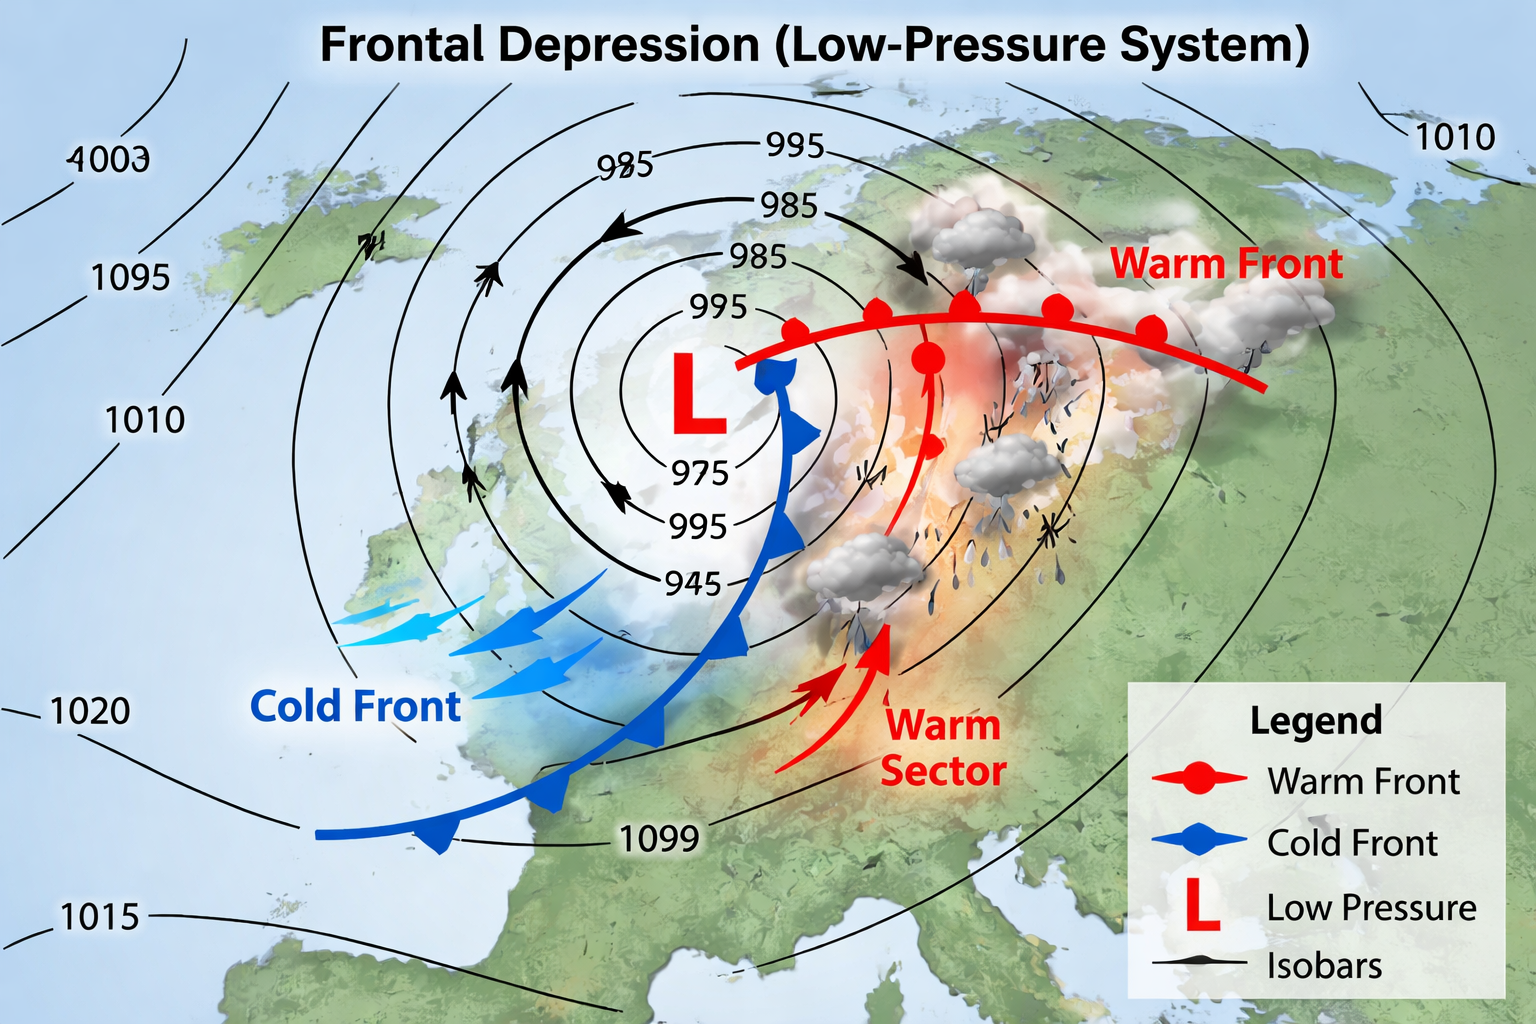
Frontal depressions
A frontal depression forms when cold polar air meets warmer air along the polar front. A disturbance creates a wave in the front, causing surface pressure to fall and a low-pressure area to develop. The system then forms a warm front and a cold front. Warm air is forced to rise over cold air, producing clouds, precipitation, and wind. As the depression intensifies, the cold front eventually catches the warm front, forming an occlusion, after which the system usually weakens.
The weather we can expect in a frontal depression is a warm front followed by a cold front.
Thermal depressions
A thermal depression is a low-pressure area caused mainly by strong surface heating. When the ground heats up quickly, the air above it warms, expands, and rises. This creates lower pressure at the surface and can draw in surrounding air.
A common example is a heat low over a hot desert or inland plateau during summer. In the afternoon, intense sunshine heats the land strongly, the air rises, and a shallow low-pressure area forms. This can help trigger local winds, dust lifting, or thunderstorms if enough moisture is present.
Ice build-up (12)
Ice build-up can happen on the ground and during flight. Ice on the plane is a huge risk for aircraft, as this causes the following problems:
- Lift will be decreased
- Weight will be increased
- Ailerons and trim can freeze solid
- Ice on propellors decrease thrust
- Ice on propellors can cause huge vibrations
- Ice on the windshield can decrease visibility
- Ice can cause vibrations on antenna’s, potentially breaking them
Let’s take a look at what weather conditions this can happen.
Ice build-up formation
Ice build-up will happen if the temperature is under 0 degrees, and the air contains enough undercooled water. The most chance on undercooled water is between 0 and minus 12 degrees celcius. Mostly, ice build up will happen when precipitation, coulds, brume, fog or mist is in the air or flying into.
The outside temperature of the plane material can also be 0 degrees celcius or lower, causing any moist to freeze on contact. Especially when going from cold air into warmer and humid air.
Types of ice build up
The types of ice build up are:
- Hoar frost (rijp): Freezing water vaporfrom clear unsaturated air under 0 degrees. This will be a thin layer just like on your car in winter-mornings
- Rime ice (ruige rijp): Undercooled water that freezes instantly at contact on your planes’ surface, which looks like coarse (grof) ice
- Freezing rain (ijzel): Undercooled water that is made of big droplets, that freeze instantly upon contact
Ice build-up in fronts:
When in a front precipitation from warm air comes into the cold air, this will then be undercooled water. This frontal investion will cause a ice triangle. In this ice triangle, undercooled water will fall in the form of freezing rain or drizzle which causes a lot of ice build up.
Because of the small slope of the front surface, the warm front is bigger than a cold front.
Ice build up in carburetor
In the carburetor, fuel is mixed with air si the engine always have a optimal mix of both. The engine will suck outside air into a narrow space, called a venturi and then in the carburetor. In this narrow space, there will be a lower air pressure (Bernoulli’s law) and the sprinkler will get fuel, which is combined into brume with the air.
The combination of the air pressure decrease and evaporating fuel, the themperature in the carburetor will decrease with temperatures up to 40 degrees celcius. This cooling can condense the water from the air, and can evantually lead to a solid freeze. This causes the engine to run inconsistent or even turn off, which we don’t want in flight.
The most chance of carburetor ice is in these conditions:
- High humidity: 60% or higher
- Low engine RPM
Always turn on the carburetor heat (CVV) in conditions where you have a lower RPM, sometimes in cruise, but this leads to a drop in RPM.
Meteorologic information sources (13)
Before we are going to lift of in our beautiful aircraft, we must first as part of our flight preparation, look at the weather in our area. The weather can often be predicted pretty well, but in some circumstances this can be very unpredictable.
We can use the following sources to get a good understanding of the weather during the flight:
| Weather product | Description | Published by | Frequency | Where to find |
|---|---|---|---|---|
| Synoptic Weather Charts | Broad overview of the weather over Western Europe, including fronts and pressure systems | Dutch KNMI | Several times per day at standard synoptic times. (KNMI) | KNMI Weather Charts |
| Significant Weather Charts (SIGWX / SWC) | Show significant en-route weather such as turbulence, CB, jet streams, volcanic ash, and tropical cyclones | World Area Forecast Centres (WAFC) in London and Washington | 4 times per day | Met Office WAFC |
| Graphic Low Level Forecast Chart (GLLFC) | Winds and temperature up to FL100 | Dutch aviation weather services | 3:00, 9:00 and 15:00 UTC | Luchtvaartmeteo |
| METAR (Aerodrome Routine Meteorological Report) | A report of the actual observed weather at an aerodrome, including wind, visibility, cloud, temperature, and pressure. | The local controlled aerodrome | Every 30 minutes | Aviation Weather Center – METAR/TAF |
| ATIS (Automatic Terminal Information Service) | A continuous aerodrome information broadcast that often includes the latest weather information used operationally by pilots. | The local controlled aerodrome | Every 30 minutes | Aerodrome VHF frequency |
| SPECI (Special Meteorological Report) | Unscheduled report issued between METARs when significant changes | The local controlled aerodrome | When significant weather occurs | Aviation Weather Center – METAR/TAF |
| TAF (Terminal Aerodrome Forecast) | A forecast for 24 to 30 hours in future of the predicted weather | The local controlled aerodrome | Every 6 hours | Aviation Weather Center – METAR/TAF |
| General Aviation Weather Bulletins | In the Netherlands, KNMI publishes a general aviation weather bulletin for flight preparation and short-term forecasting | Dutch KNMI | Every 3 hours. (KNMI) | KNMI GA Weather Bulletin |
| GAFOR (General Aviation Forecast) | A route/area forecast product for general aviation, published in some countries such as Germany | National weather station | Every 6 hours | DWD Aviation Weather |
| VOLMET (Meteorological Information for Aircraft in Flight) | A service providing meteorological information for aircraft in flight, usually by radio broadcast or datalink | Flight Information Region | Continuous | No single universal public page; accessed via VHF/HF VOLMET frequencies and operational flight documents. |
| Weather Radar | Weather radar is used to detect precipitation and monitor showers, rain, and thunderstorms in near real time (6GHz antenna’s) | Dutch KNMI | Continuous | Buienradar |
| Satellite Images | Meteosat satellite images provide an actual overview of weather systems over Europe, including visible (VIS) and infrared (IR) imagery | European Meteosat | Near real time, updated continuously depending on the imagery product. (KNMI) | /headingLuchtvaartmeteo / EUMETView |
Significant Weather Charts
Significant Weather Charts are published by the World Area Forecast Center in London or Washington and contain charts with detailed information. This information is encoded with different icons and have their own meaning.
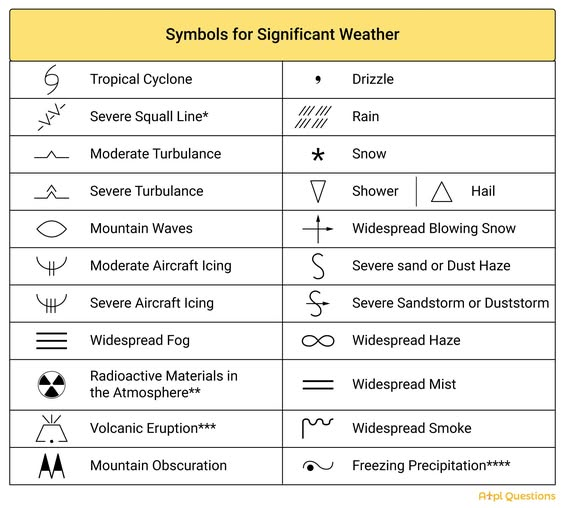
Significant weather charts are meant for a great overview-forecast, especially when planning international flights. These show the flight levels FL100 to FL450
Graphic Low Level Forecast
The graphic low level forecast (GLLFC) is a combinaton of the low level significant weather chart for a Flight Information Region and winds/temperatures from ground to FL100.
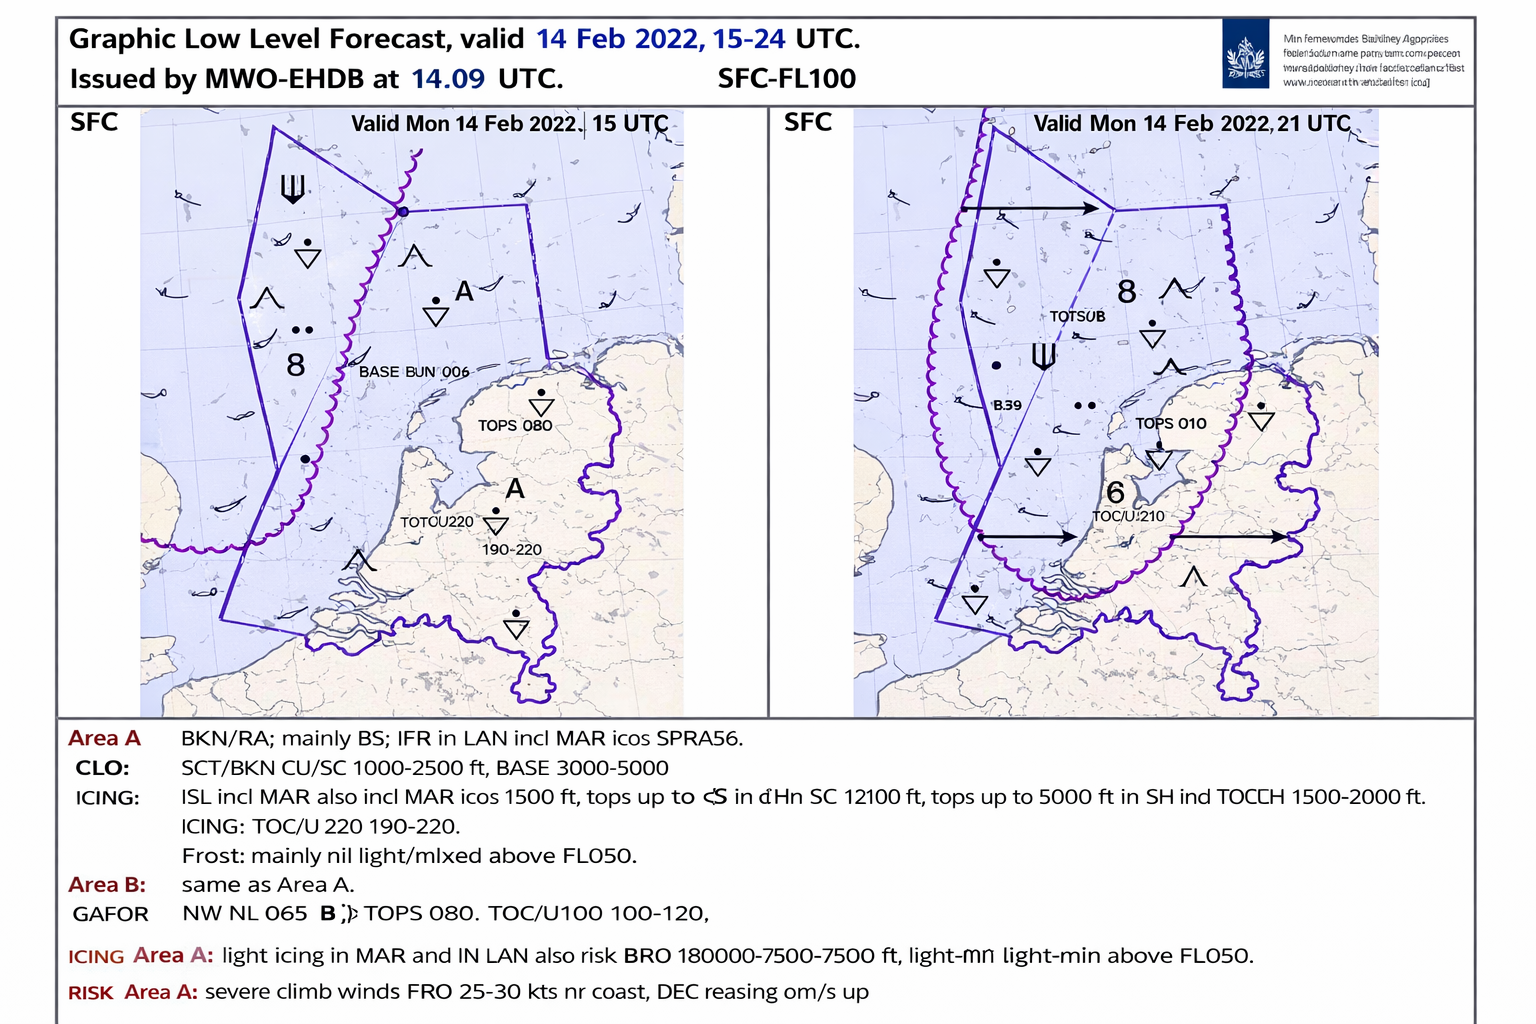
All the flags are windbarbs which show the wind direction and speed. It does it in this way:
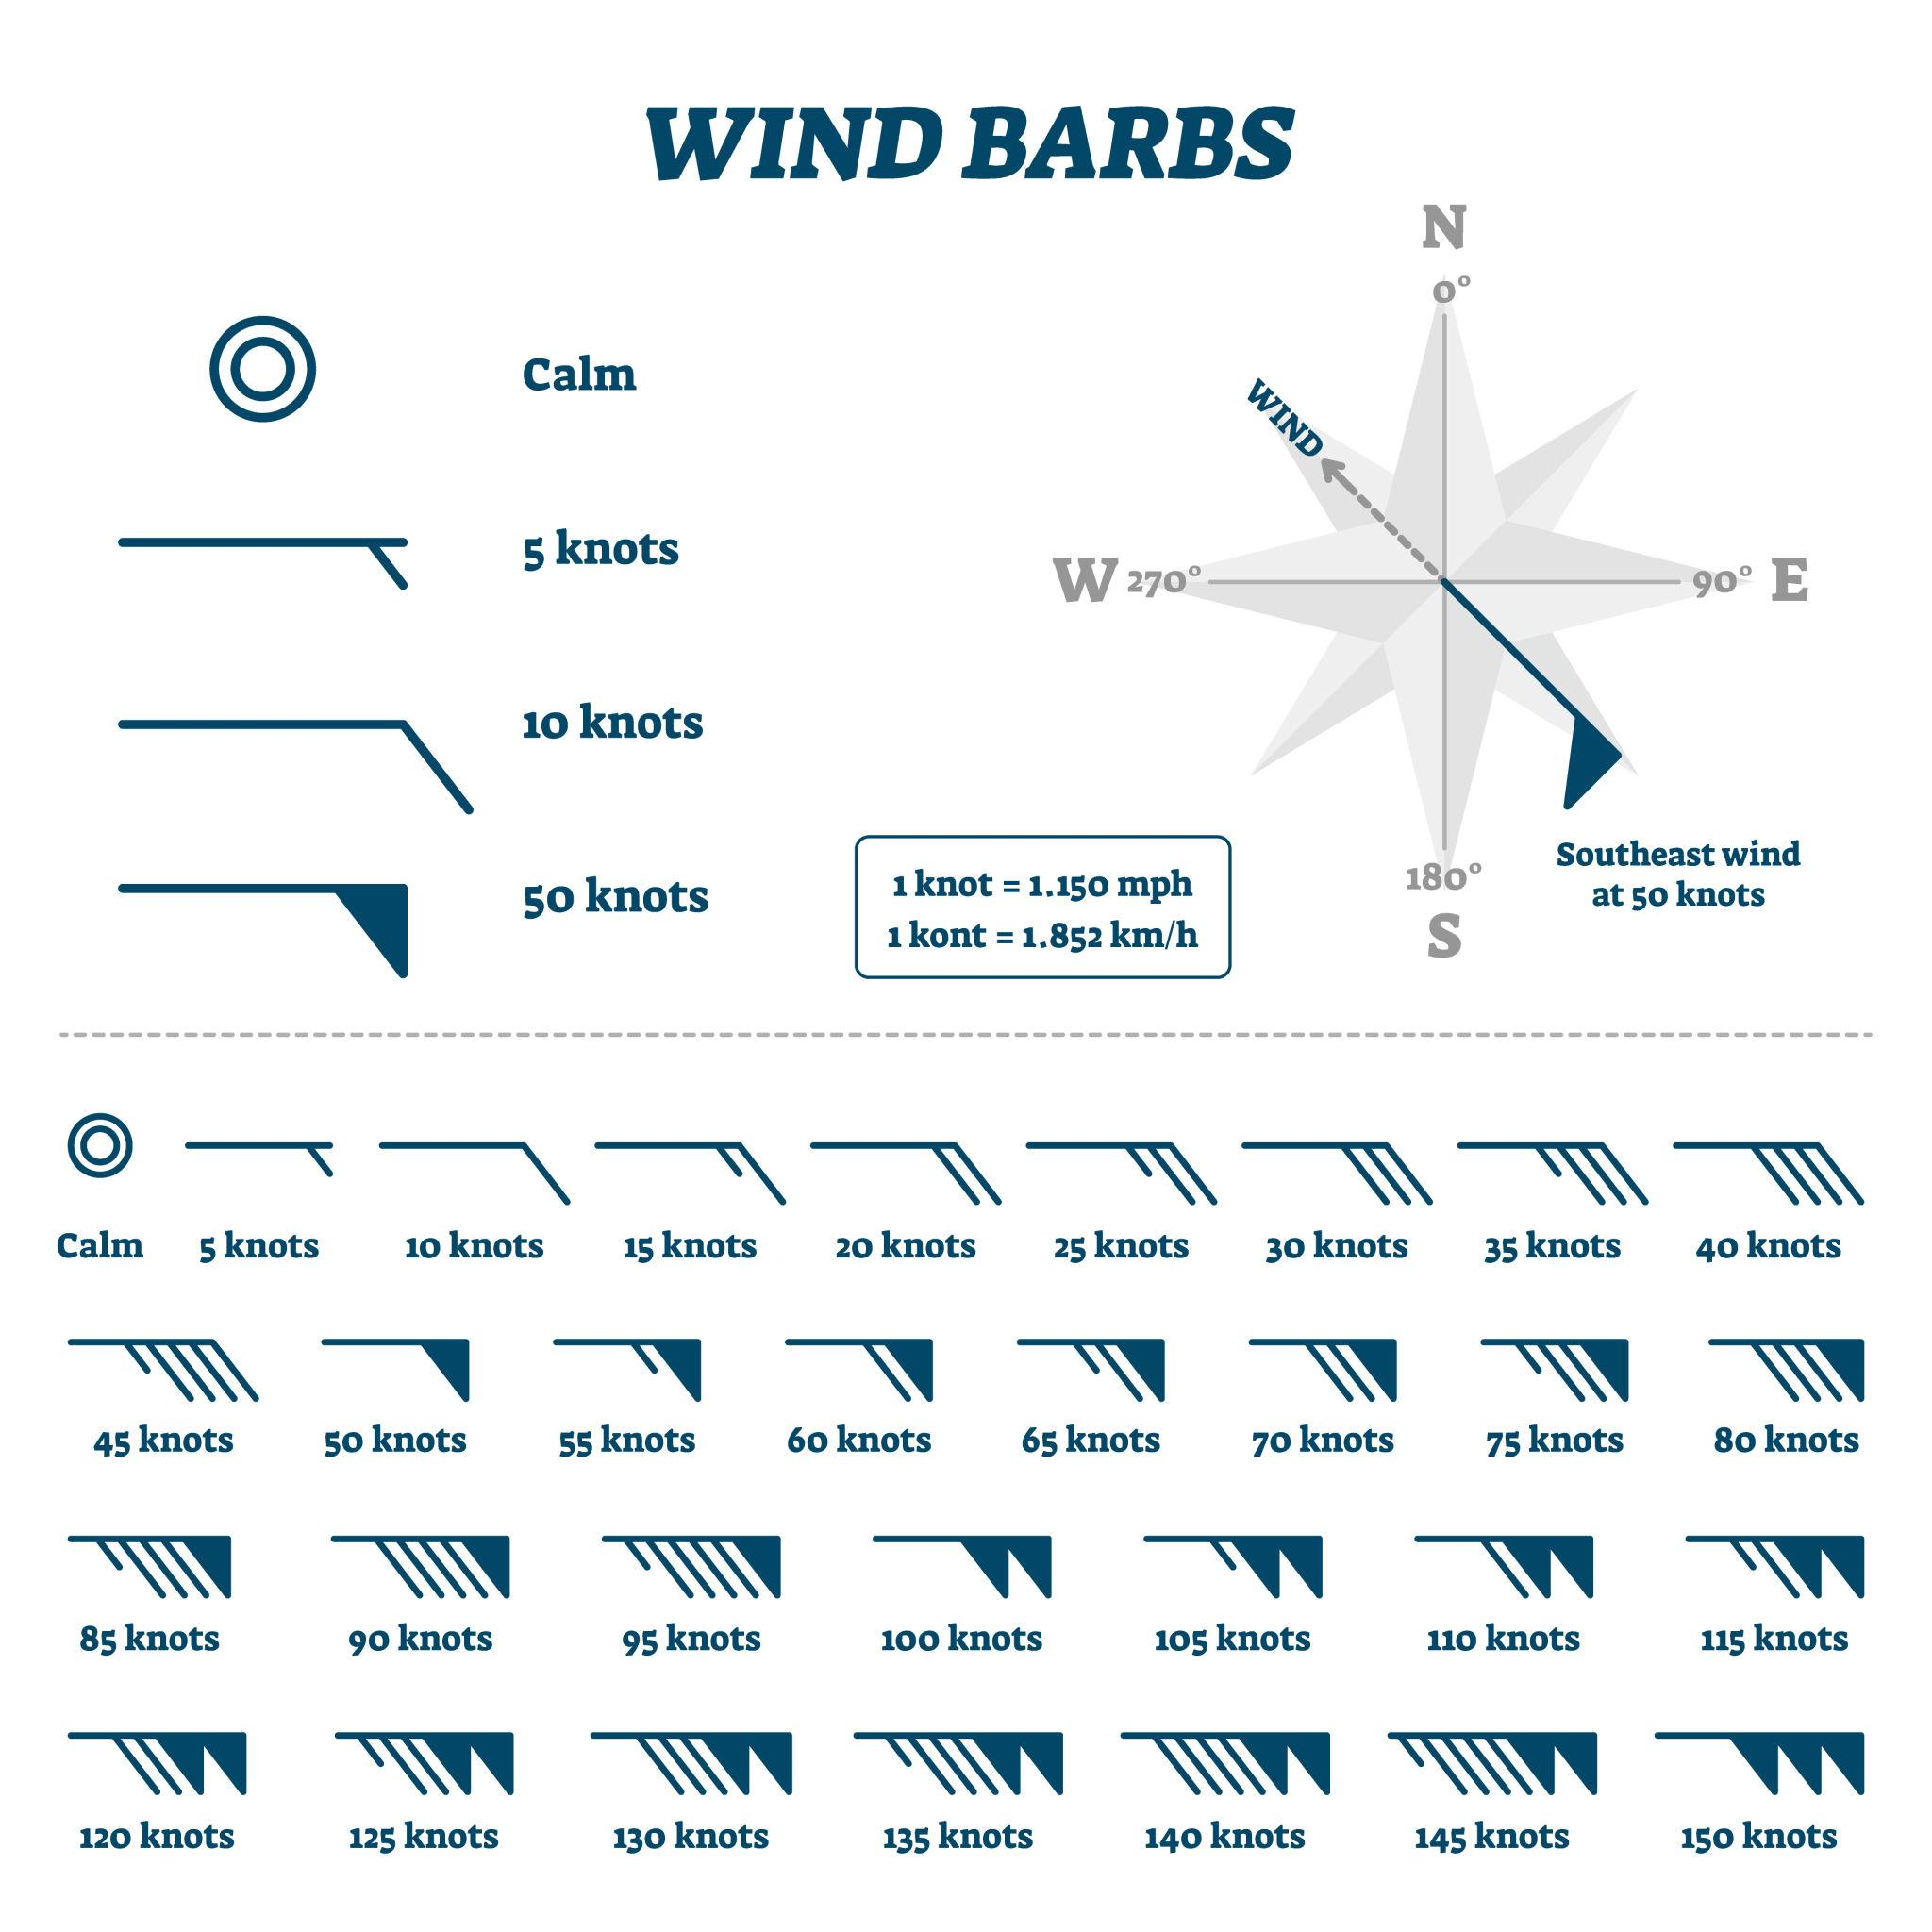
The max is three of the same filled symbol, with winds above 150 knots you should ask yourself if you even want to be outside.You can see this as a weather station with a banner, it always points to the direction of wind source.
- SIGWX: Significant weather
- VIS: Visibility
- CLD: Cloud base, octa’s, type of clouds and altitude of cloud tops
There are some other abbreviations used in this type of charts:
- COT: Coastal
- LCA: Local
- MAR: Maritime
- MON: Mountain
- VAL: Valley
- LAN: Above land
- MTW: Mountain waves
- WS: Wind shear
- MOD: Moderate
- SEV: Severe
Aerodrome routine meteorological report (METAR)
On controlled airfields, for the full 24 hours on a day there will be done measurements of the actual weather and published every 30 minutes. This looks like a code to new people, but still resides from older ACARS and teletext solutions used in the past.
METAR EHAM 211125Z 05009KT 020V080 9999 FEW008 07/04 Q1019 NOSIG
This actually means this:
- EHAM Amsterdam Schiphol Airport.
- 211125Z Observation on the 21st at 11:25 UTC.
- 05009KT Wind from 050° at 9 knots
- 020V080 Wind direction varying between 020° and 080°
- 9999 Visibility 10 km or more
- FEW008 Few clouds at 800 feet
- 07/04 Temperature 7°C, dew point 4°C
- Q1019 Pressure 1019 hPa
- NOSIG No significant changes expected in the near future.
That states a lot more; meaning a cold spring day with this weather:
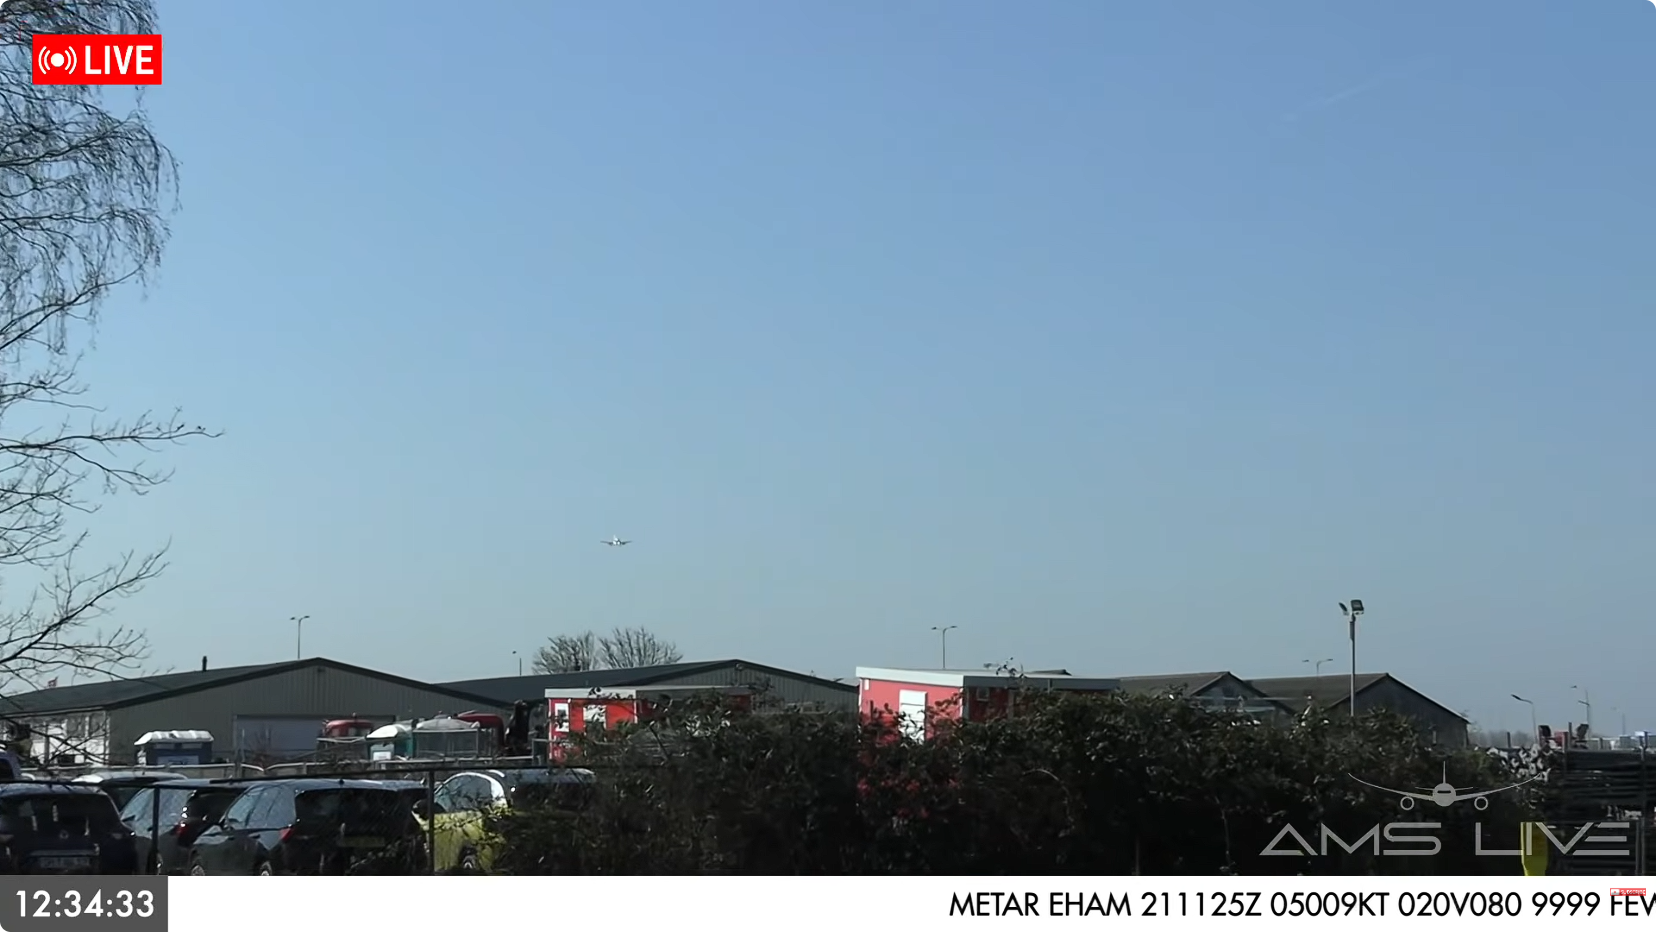
Source: AMS Live on Youtube
CAVOK means “Ceiling and Visibilty OK” and is only mentioned by ATIS/METARs if the following criteria are all met:
- Horizontal visibility of 10.000 meters or more
- Cloud ceiling 5000ft or higher
- No significant weather like cumulonimbusses, towering cumulonimbusses
- No thunderstorms
- No ground fog/haze/brume
- Measurement is not done automatically (otherwise it will be NCD meaning No clouds detected)
If one of the above criteria are not met, NSW or NSC will be used:
- NSC (No Significant Cloud): no clouds below 5000 ft and no CB/TCU present.
- NSW (No Significant Weather): indicates that no significant weather phenomena (e.g., rain, snow, thunderstorms) are occurring or expected. Mainly used in TAF trend forecasts.
In America we have another option: CLR
- CLR (Clear): no clouds detected below 12,000 ft (primarily used in North America).
If the METAR contains any slahes ////, then the information is not measured, giving no 100% warranty on the information:
METAR EHAM 211125Z ////KT 020V080 9999 BKN008/// 07/04 Q1019 NOSIG
Here the wind and type of clouds is unknown, meaning that any cumulonimbus could be hiding.
METAR is actual measured weather with a trend and TAF is a forecast for the coming 24-30 hours. When departing from a controlled airfield, you are required to listen to the ATIS containing this METAR information which will be coded with a increasing letter (like Delta). When asking for the flight clearance, you have to pass on this letter as acknowledgement that you have listened the ATIS. When a new METAR is released in the meanwhile, you need to monitor the ATIS again.
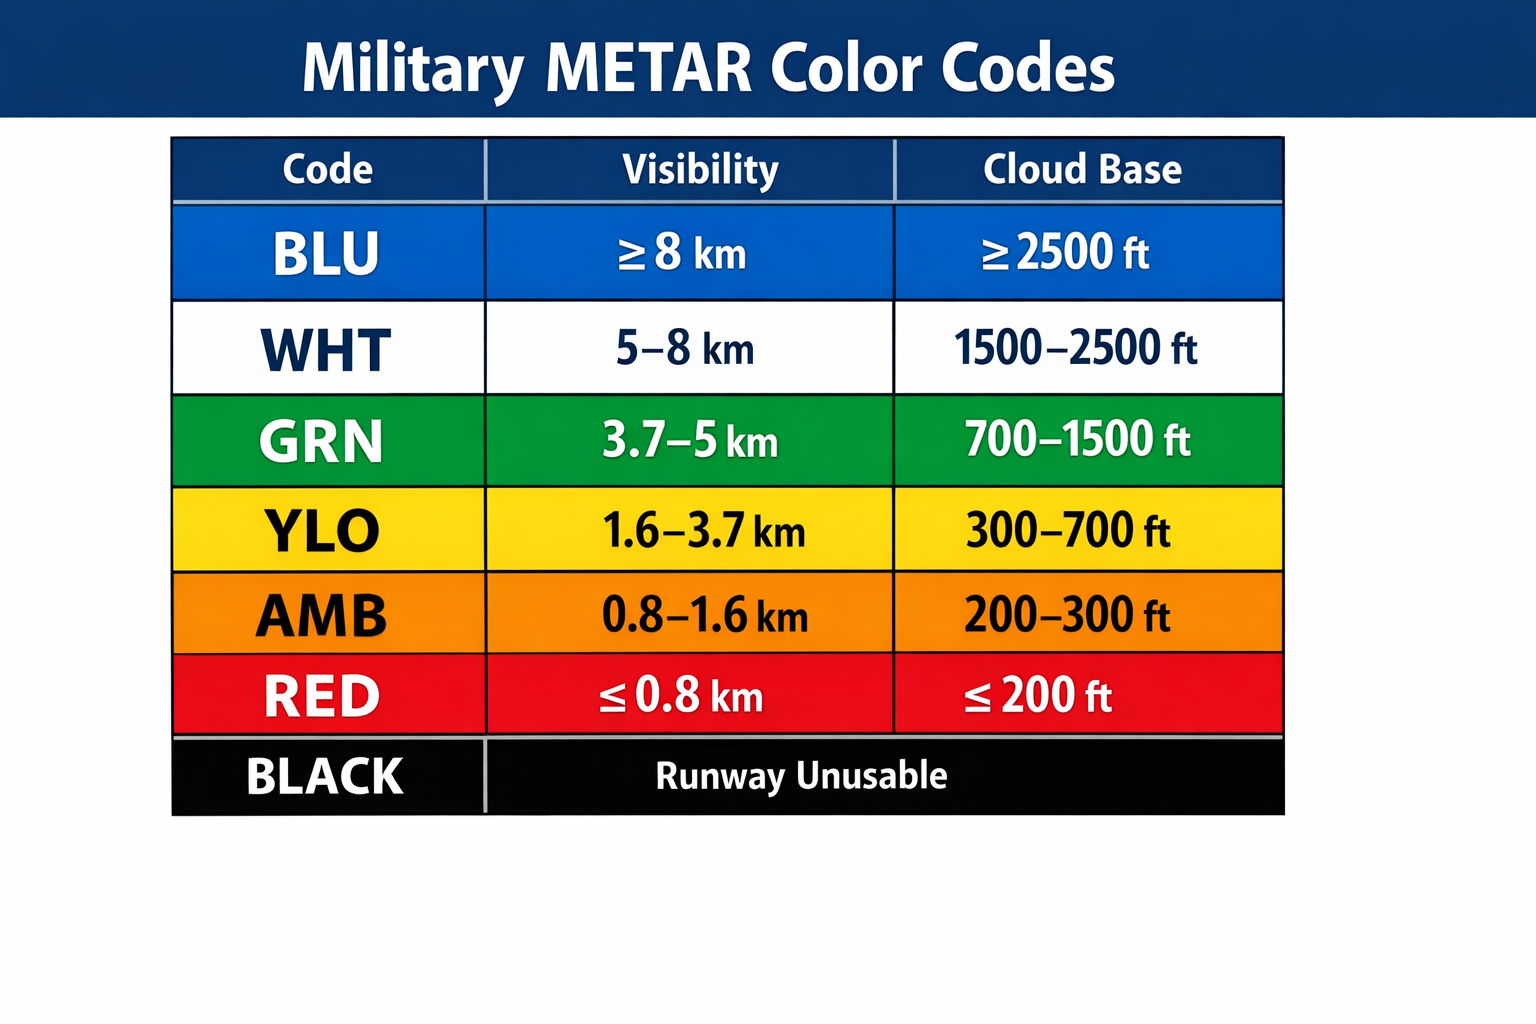
A SPECI is actually a intermediate METAR, published if any significant change was measured. On military fields, this color code is being used.
TAFs
An airport with weather station also has something called a Terminal Aerodrome Forecast. This is a text-based forecast of the weather in reach (5 nautical mile range) of the airport in de coming 30 hours. We use this to plan flights more that 6 hours ahead. A metar is only valid for 30 minutes.
- If needing weather information within 2-3 hours of landing at an aerodrome, use the trend of the airport
- If needing weather information longer than 3 hours, use the TAF
VOLMET
A VOLMET is weather information for planes en-route. This is broadcasted on VHF frequencies which you can listen out, and are totally meant for international commercial traffic. “En vol” in French means for flight, this is the source of this name.
The VOLMET is really like an ATIS but then on route and an example is this:
“Amsterdam VOLMET weather at 1125 UTC on the 21st. Wind 050 degrees at 9 knots, varying between 020 and 080 degrees. Visibility 10 kilometres or more. Few clouds at 800 feet. Temperature 7, dew point 4. QNH 1019. No significant change expected.”
SIGMET and AIRMET
Aside from the given sources of weather information, two separate messages can be published:
- AIRMET: Advises of less severe weather, but still important for flight operations. Typically affects smaller aircraft or general aviation. Examples: moderate turbulence, moderate icing, mountain obscuration, widespread IFR conditions.
- SIGMET: Advises of severe or hazardous weather that can affect all aircraft. Higher priority than AIRMET. Examples: severe icing, severe or extreme turbulence, volcanic ash, sandstorms, severe thunderstorms.
In simple terms:
- AIRMET = caution (important weather)
- SIGMET = danger (serious weather hazard)
These messages can be received from your preparation, ATC or flight information services or your VFR navigation app like SkyDemon.
Weather radars
We also have weather radars, both on the ground and installed on some planes. Weather radars will send radio frequencies in the 6GHz band into the air, and can detect any reflections. This 6GHz band can receive precipitation elements pretty good and therefore can make a good forecast of the weather ahead. It basically sends a radio pulse into the air, and those precipitation elements like rain and snow reflects it back.
Sometimes, this causes clutter, which are false positives received by other devices or buildings on the ground but will be filtered for the greatest part.
A weather radar as a reach of around 200 to 250km, which makes it possible for the KNMI residing in de Bilt to scan the whole country and great parts around it.
Thunderstorms can also be detected as they are being measured using a different set of electromagnetic radiation detectors.
Satellite images
We can also use satallite images from the Europen Metrosat satellite. This satellite makes pictures every 15 minutes in two different types:
- Visible light (VIS)
- Infrared (IR)
These can be used to cross check to view which type of clouds are present and which protions are visible.
Visible light images give a great overview of the clouds. Thick clouds are lighter than thin clouds, but no difference can be seen within low and high clouds.
Infrared images will show the temperature of the clouds, where warm surfaces are darker and cold surfaces are lighter. Low clouds therefore are grey and high clouds are white.
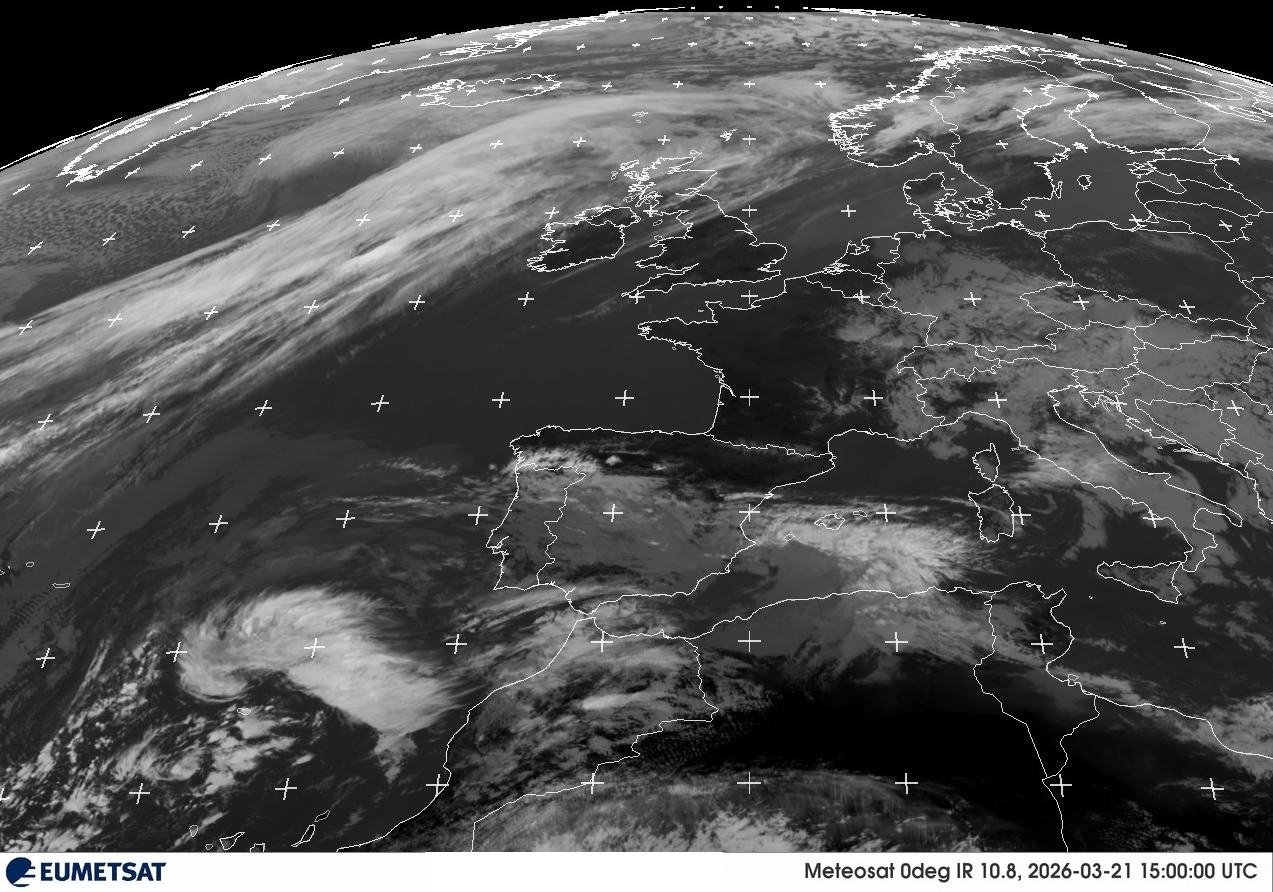
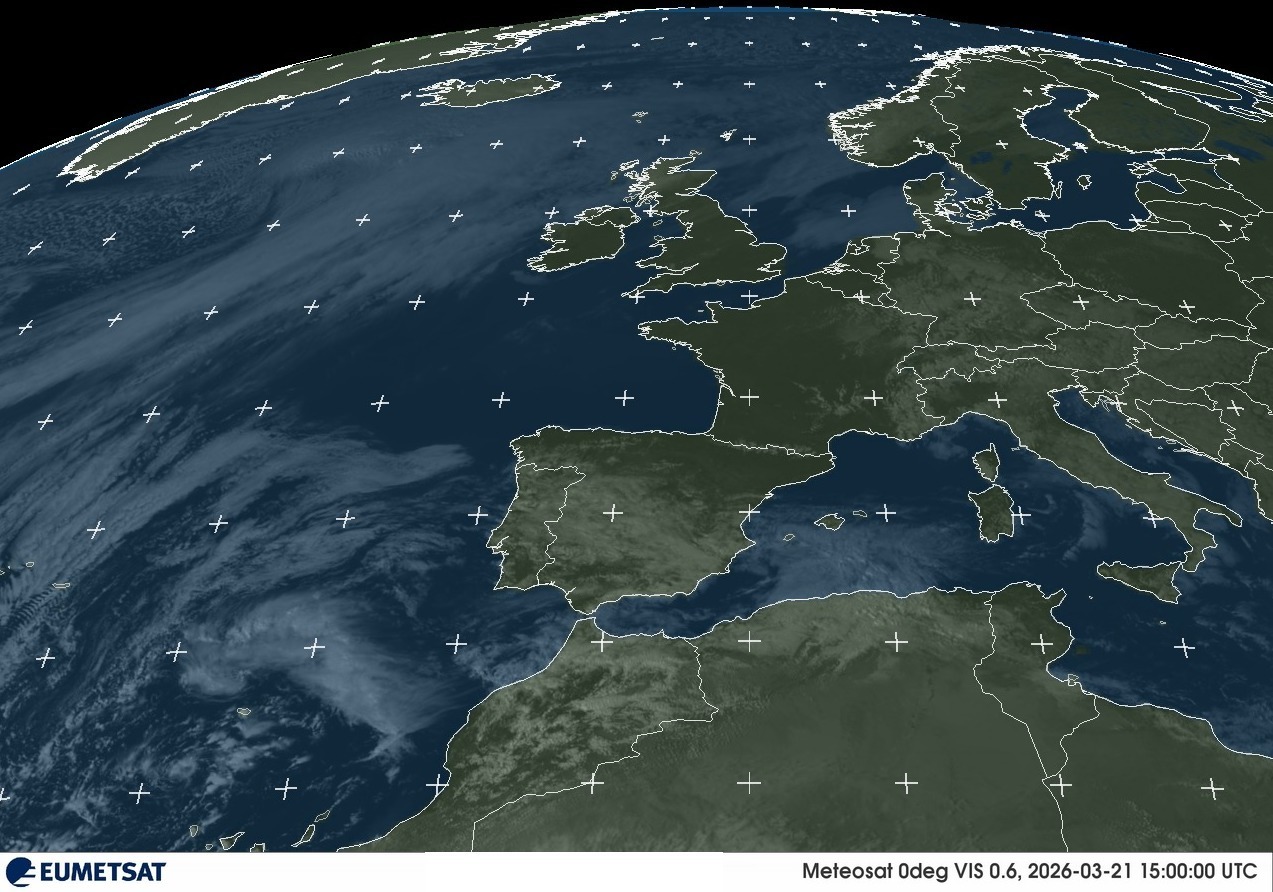
Left: Infrared Right: Visible light
Thunderstorms are not visible on these satellite images because they look like high clouds. Satelitte images can only detect the highest point of the clouds, so we can use them but this is not our primary source.
To use satellite images, visit this website: https://eumetview.eumetsat.int/static-images/latestImages.html
GAFOR
In some countries, we have the GAFOR, called the general aviation forecast. This is a code which is valid for 6 hours, looking like a METAR but has some different coding:
GAFOR: Route A – X-RAY Validity: 21 March 2026, 1200–1500 UTC Weather: Broken cloud layers, local rain showers, moderate visibility reduction in precipitation Cloud base: 1,500–2,000 ft AGL Visibility: 5–8 km, locally 3 km in showers Wind: 220/15 kt, gusting 25 kt over higher terrain Freezing level: 6,000 ft Turbulence: Light to moderate below 4,000 ft Icing: Nil below freezing level
The types/codes are given:
O – Open: Conditions are suitable for VFR along the route D – Difficult: VFR is possible, but conditions are difficult M – Marginal: Conditions are marginal for VFR X – Closed: The route is closed for VFR due to weather conditions
In the Netherlands, you can use the Weather Bulletin for General Aviation from the KNMI which gives a better understanding but bigger countries work with the GAFOR, mostly bigger countries.
That was it for Meteorology.
To do
- Review fronts, transitions and results
- Adiabatic processes
- Anabatic/katabatic processes
- Coriolis effect and forces
- Frontmist is caused by warm fronts and its precipitation