PPL Theory - Navigation (NAV)
Categories:
For a live overview of my flight lessons, visit: https://flighttools.justinverstijnen.nl/flightlessontracker
This page can contain a collection of personal notes, steps to remember, finished and unfinished content. Please excuse brevity.
Do not use specific information given like fuel flow, landing/take-off distances for your flights. Always refer to the POH of your exact plane for flight preparation. My information is just for references that I used.
Introduction to Navigation and Flight Planning
Navigation and Flight Planning is a very important part of preparing your flights and knowing where to go in the air. When a flight is not properly prepared you can get several different kind of issues. These are the most pilot-caused problems in the air:
- Incorrect fuel calculation
- Incorrect mass & balance calculation
- Fail to read and understand NOTAMs
When planning a flight, we always make a A to B flight with an alternate as C. The alternate is mostly an airport in the vicinity of B, but can also be A. As we might revert back to A, we need to have at least double the fuel as we need for getting from A to B.
Runways, Take-off and landing
Runways are straight pieces of grass, asphalt or bitonimous where a plane can take off or land on. They always have 2 numbers, like 04 and 22. This indicates the magnetic heading of the runway based on magnetic north. This is by design so you could land a plane without navigation and only with your magnetic compass.
Runways have some characteristics which we should take into account before taking off and landing to make sure we can succeed or reject a take-off and that the runway is long enough for our plane to actually land.
We have the following abbreviations:
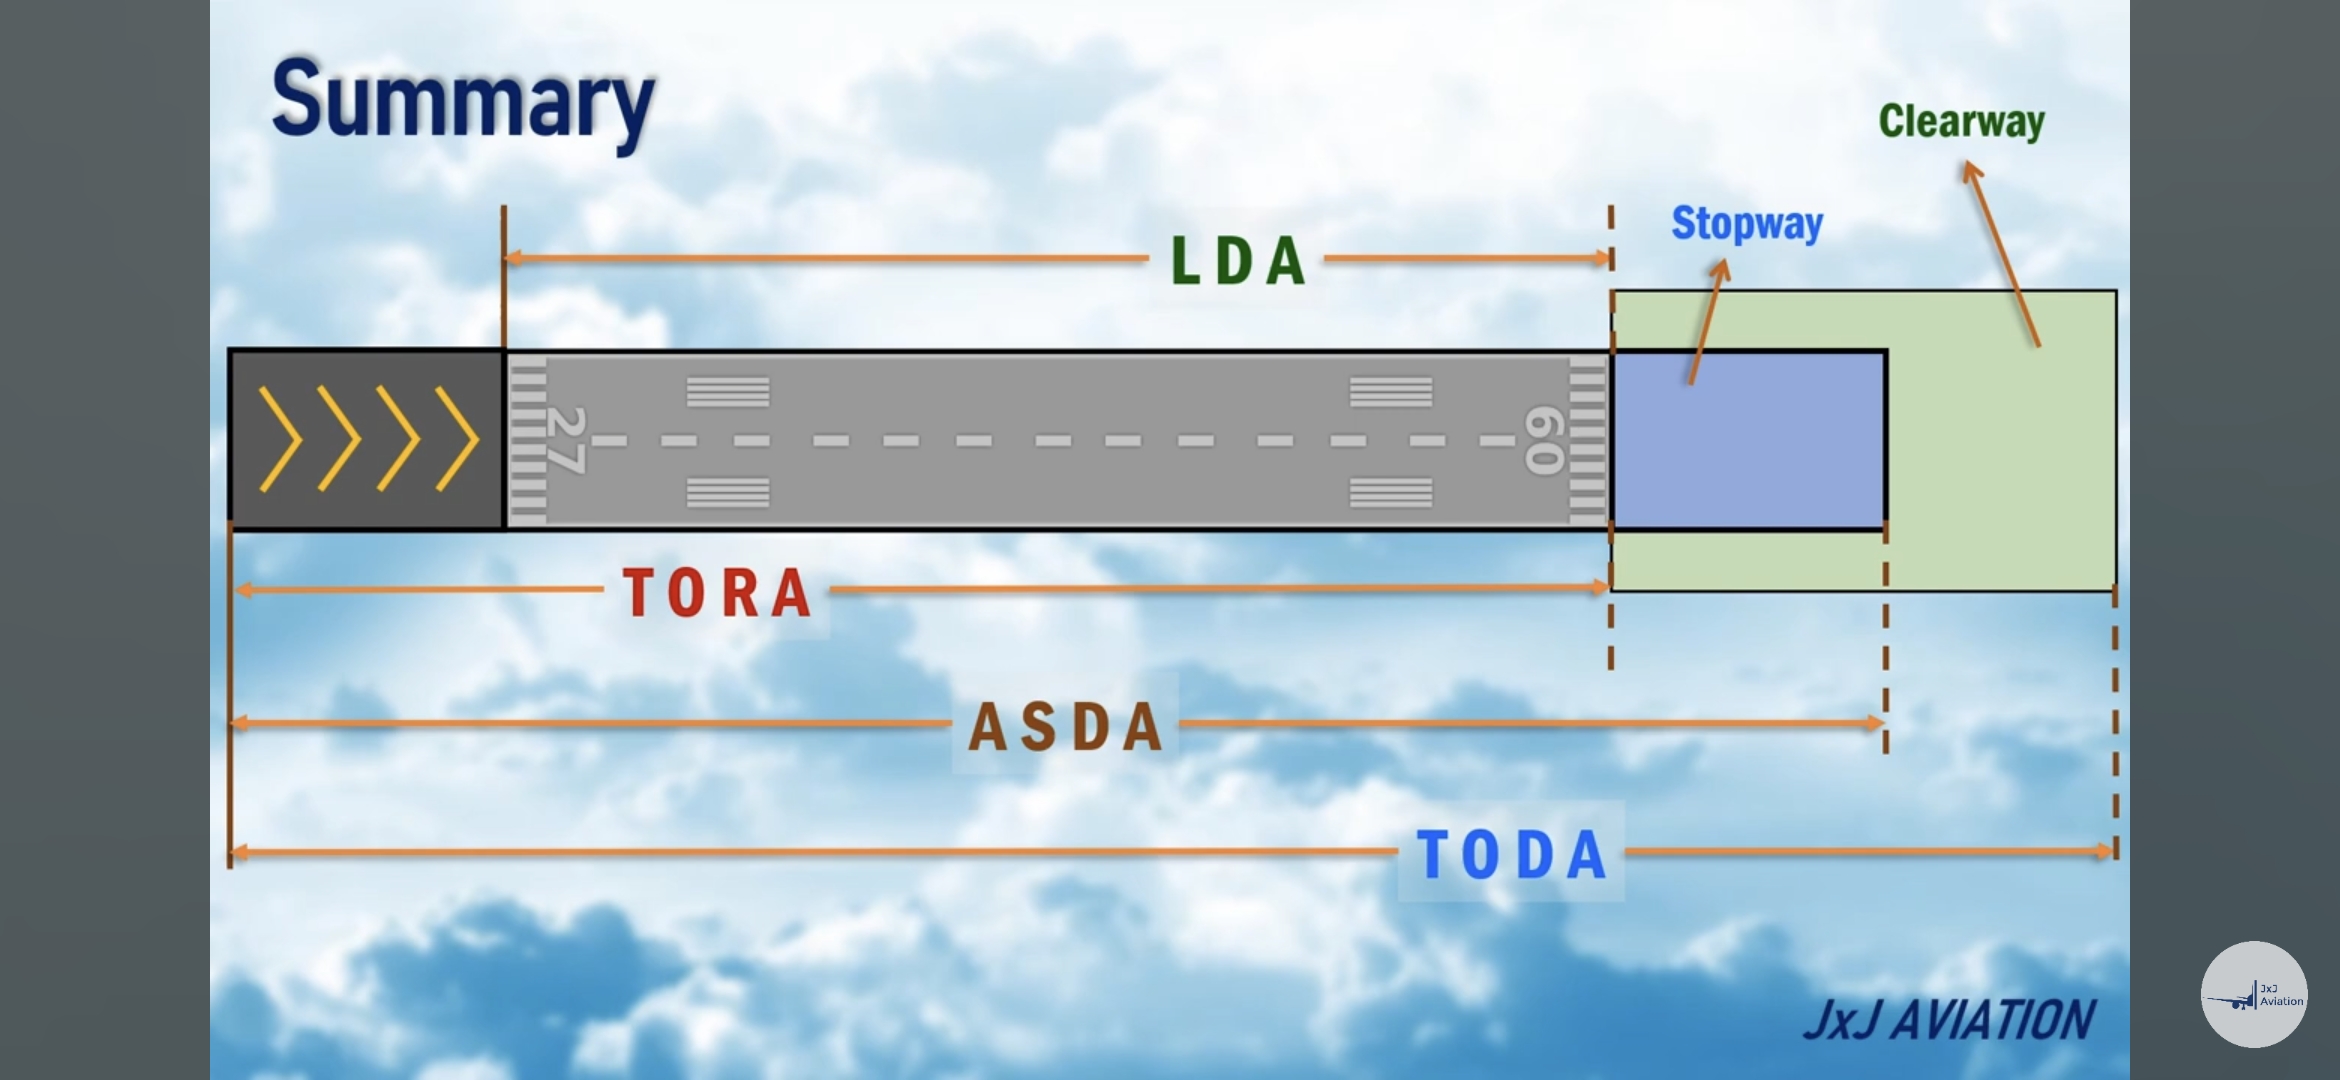
- Take-off run available (TORA): this is the area we can run-up our plane to rotation speed, or where we actually lift off the ground
- Clearway: is is a piece of extra cleared area after the runway to lift off our aircraft to at least 50ft above the ground. This can also be water, if the elevation of the runway is higher than the water.
- Landing distance available (LDA): this is the area where can land the plane in normal conditions, without the stopway at the end.
- Stopway: this is a designated piece of extra runway to stop our aircraft if overshooting the normal runway
- Displaced threshold: this is the part at the start of the runway with the arrows, its meant to extend the runway for take off but not meant to used for landing, only in case of emergency.
- Accelerated stop distance available (ASDA): this is the area where we can take-off and reject our take off. ASDA includes the stopway and the displaced threshold.
- Take-off distance available (TODA): This is the sum of the displaced threshold, LDA and clearway. Also lnown as the area where we can start our take-off till we hit 50 feet.
When calculating your take-off and landing performances, numbers may never exceed those numbers above. You can find the actual numbers in the AIP.
International Standard Atmosphere (1)
Worldwide, we have the same default settings for our standard atmosphere on sea level:
- Temperature: 15 degrees celsius
- Air pressure: 1013 hpa (29.92 mmHg)
- Air density is 1,225 kg air per cubical meter (m3)
- Vertical air gradient is -2 degrees per 1000ft (-6 degrees per 1km or 0,65 degrees celsius per 100 meters)
- Nitrogen: 78% (stikstof)
- Oxygen: 21% (zuurstof)
- Carbon: 0,03%
- Gasses: 0,9%
- Humidity
On around 18.000ft the airpressure is half of sea level pressure (500hPa), and on 36.000 ft, the temperature is around 56,5 degrees celsius.
We have multiple layers in the air:
- Troposphere: ground to 36.000 ft
- “Tropopauze at 36.000ft which can defer day to day”
- Stratosphere: 36.000ft to 160.000 ft
Pressure Altitude
Pressure altitude is the altitude corrected to the International Standard Atmosphere. For performing take-off calculations, we will want to know how our plane performs which can be different with different pressures. This is a live indicator of being above or below earth’s standard atmosphere.
In short:
- Higher pressures (Low altitiudes): Better engine performance, better propellor performance and more lift
- More oxygen and more air molecules
- Lower pressures (High altitudes): Less engine performance, less propellor performance and less lift
Pressure altitude examples
In an airport which mostly is lower or higher than mean sea level, there will be a small correction needed. For example, our airport is at 17 feet above sea level, and the actual pressure is 1032 hPa on sea level at a day with nice weather, the pressure altitude is -489 ft. This means our take-off performance will be better as we have more air molecules which is better for our engine.
In the same example with a pressure of 968 hPa on sea level, we will have a pressure altitude of 1238ft. This means our aircraft will perform as it takes off at 1238ft above sea level, which will have some disadvantages. As there is less air, we will need a longer runway, our engine performance is less and our lift will be less as there is less air. However, flying in relative high pressure altitudes is good for having speed, as drag decreases in lower pressure.
As you can already see, this example gives two completely different scenario’s with around 1700ft difference. In countries like the USA where airstrips can be at 5000ft altitude, the pressure can be a huge difference which we must take into account.
Check out this tool to calculate and visiualize Pressure/Density altitude: https://flighttools.justinverstijnen.nl/pressuredensityaltitudecalculator
Density altitude
Now we know the pressure altitude, we need to correct it for Density altitude, because warmer air is thinner than colder air. This is because warmer air expands, just take a look at a hot air balloon. This means that on 5000ft pressure altitude and on a hot day of 35 degrees, the density altitude (also known as “performance altirude”) will be almost 9000ft. So we can expect our plane to behave as it is on 9000ft in normal ISA conditions.
Thinner air means less oxygen and less air, denser air means more air for lift for both propellor and the wings. Less oxygen also means less engine performance but a higher true airspeed.
To calculate the density altitude from pressure altude, you can use the E6B or the tool below:
Check out this tool to calculate and visiualize Pressure/Density altitude: https://flighttools.justinverstijnen.nl/pressuredensityaltitudecalculator
GPS coordinates and Earth
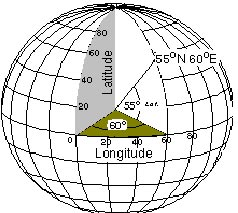
GPS coordinates are made to navigate and pinpoint certain places in the world. In aviation, we mostly use these 2 possible notations;
- Decimal: 51,
- Degrees, minutes and seconds (DMS): 51 degrees, 30 minutes and 30 seconds
The equator and 0-meridian is the actual 0 point of earth. From there we look up the coordinates:
For reference, the Netherlands lies between 50 and 54 degrees North, and 4 and 7 degrees East.
In a degree goes 60 minutes, where each minute is around 1 nautical mile (zeemijl), and this is 1852 meters. This is measured on a meridian, not on the parralels.
Transponder communication and usability
The transponder on board of an airplane is used by Secundary Surveillance Radar (SSR) to identify the blips shown on the map. In the plane, a device called the Transponder is turned on and sending out signals in pulses at around 1090MHz. This pulse consists of 4 digits and the transponder has several modes:
- Mode A: Squawk code
- Mode C: Pressure altitude (not AGL/MSL!) but measured on the ISA pressure -> QNH 1013
- Mode S: “Selective” (identify code, TCAS, etc.)
Mode C also contains the code and mode S also contains the pro’s of mode C, this is cumulative.
ATC can ask for your transponder capability, you can say “Transponder capability Sierra” for Mode S transponders.
Map projections (15)
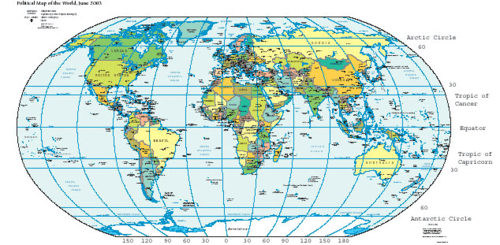
To project the globe which is a round object, we can use multiple different projections, each with their pro’s and cons.
| Type | Pro’s | Cons |
| Mercator (Cylindrical) | Conform = Hoekgetrouw* Medians and parralels are straight lines | Greenland looks equal size to Africa but Africa is 14 times the size Poles are not shown correctly |
| Lambert (Cone) | Conform = Hoekgetrouw* Partly Equadistantie = Afstandsgetrouw Medians and parralels are shown curved | More complex because of the rounded shape |
* main property
This makes clear that poth projections are great in their own use:
- Mercator for whole world navigation -> like a complete map
- Lambert for small regional navigation -> like VFR charts
Then we have “Grootcirkels” and “Loxodromen” (Rhumb lines), which are different on both types of maps:
| Projection | Medians | Grootcirkel | Loxodroom |
| Mercator | Straight lines | Curved | Straight line |
| Lambert | Slope in lines because of conal shape | Straight line | Curved |
A loxodroom means that a line on a chart hits all medians under the same angle (same degrees). This is why a loxodroom is straight on the mercator chart and curved on the curved lambert chart.
Planes fly mostly loxodromische routes on one fixed heading, the magenta line on the Primary Flight Display.
In the Lambert Conformal Conic Projection, construction means that the parralels defer between the default parralels.
The shapes to remember:
- Lambert -> Loxodroom -> Hol Pool
- Mercator -> Grootcirkel -> Bol Pool
Planet earth (14)
Earth is no perfect ball but is a ellipsoid.
Earth has “Grootcirkels” and “Kleincirkels”
- Great circle is a circle which combines with the middle
- Small circle is a smaller circle which not combines with the middle
The equator devides earth into the north side and the south side. When the north side has summer, the other side has winter. We also have 2 extra parralels small circles above and below the equator:
- Tropic of cancer (Kreeftskeerkring) at 23.5 degrees north
- Tropic (Steenbokskeerkring) at 23.5 degrees south
And then we have 2 polar circles, which are a indication of the angle the sun as opposing the north/south axis of the earth (which causes the different seasons):
- North artic circle: 66.5 degrees north
- South artic circle: 66.5 degrees south
Parralels
There are parralels at each 10 degrees that horizontally divide earth
The equator is the only groot circle which also is a parralel
There are also some meridianen which goes from north to south only, and so look like half-groot cirkels. These are comparable to the timezones
Earth turns 15 degrees per hour (1 degree per 4 minutes) so 3 degrees on the chart is 12 minutes
180 degrees median is the date-line next to new sealand. The 0 median is the UTC line
Earth is 40.075 kilometers long measured on the equator parralel
Earth is 40.008 kilometers long measured on the 0 degree meridian
This is divided into 360 degrees medians
One minute on such median is 1.852 meters or exactly one nautical mile (NM). However, this is on average. At around 60 degrees north or south, one nautical mile is actually 2 minutes, cutting this in half.
One minute on a parralel is around 1856 meters, so more distance and longer time horizontally
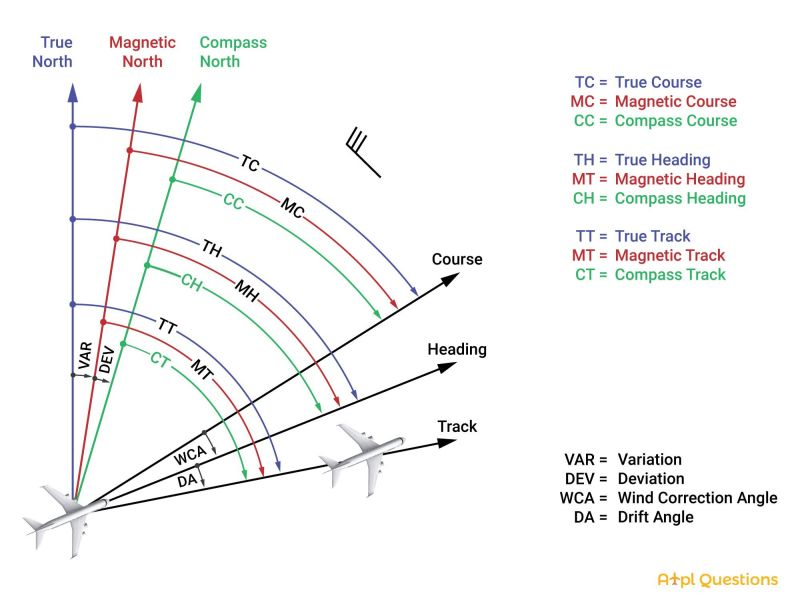
True north vs. Magnetic north vs. Compass north (16)
In aviation we have different types of norths, called the True north, magnetic north and compass north. All three sounds the same but are different of course.
To calculate courses, deviation and variation, use this tool: https://flighttools.justinverstijnen.nl/coursecalculator
- True north: This is the north that is displayed by charts, atlasses and small-scale globes. This is also the location where the icebears live.
- Magnetic north: This is the north decided by earth’s magnetic field. This changes over the years, and lies now somewhere in the north side of Canada (around 1100km from the true north)
- Compass north: This is the north displayed by your compass, which will be a minor correction to the magnetic north. The actual difference can be found on the calibration chart:
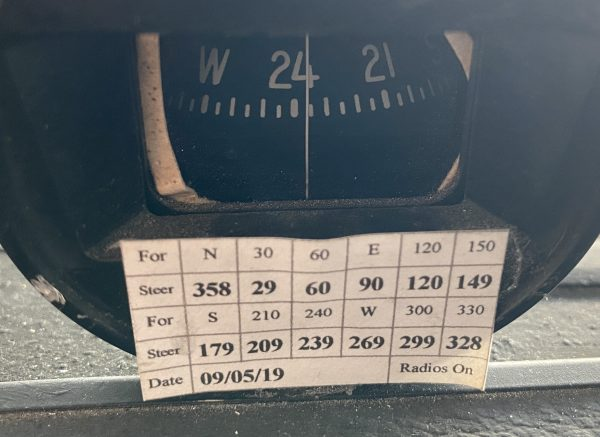
For the actual magnetic heading of 330 degrees, we have to steer 328 on the magnetic compass. This difference is mostly somewhere around 0 to 5 degrees.
Then we have multiple corrections we have to take into account:
- Deviation
- Magnetic north and compass north
- Afwijking of the compass in a plane due to correction and magnetic field of radio/electronics
- Listed as +2 or minus 2 what means: the compass reads 2 degrees more or less than the magnetic north (Thisdeviation is caused by not using the compass/standing still of the plane and is measured every maintenance)
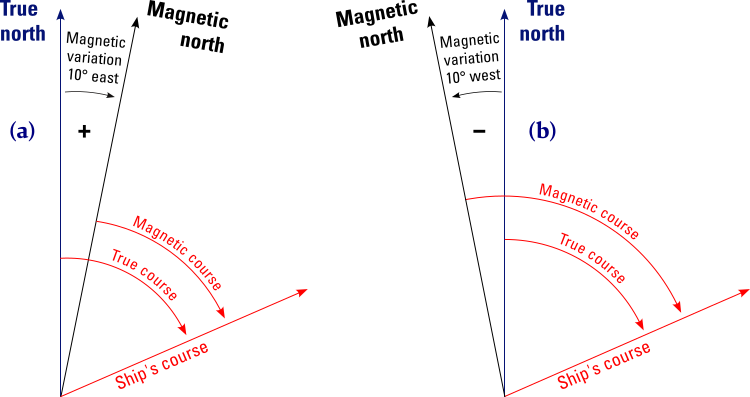
- Variation
- Magnetic north and true north
- Afwijking of the magnetic north
- Example: VAR 2 W decreasing 7’ annually
- Correction (miswijzing)
- The sum of deviation and variation summed up (or subtracted) gives you the correction of what to fly with your specific aircraft based on the magnetic compass
We can make multiple calculations with these numbers:
- True Heading - Variation = magnetic heading
- Magnetic Heading - Deviation = compass heading
- True Heading - Variation - Deviation = compass heading
This variates between west and east. We use the guideline: East = least (-) and West = best (+) but this only applies when going from magnetic to true/planned chart route.
For true/planned chart route back to magnetic is the calculation reversed, we have to subtract west and add east. This is due to the slight west position of the magnetic course.
- Course: This is the direction you are planning to fly
- Heading: This is the direction your nose of the plane is pointing at, which han change due to wind
- Track: The actual line flown with the wind taken into account
Example:
- You plan to fly 90 degrees. This is your course planned on the chart (Course)
- The wind is coming from 360 degrees and blowing you to the south, you keep 100 degrees (Heading)
- Your True track is then 90 degrees as you correct your heading for the wind (true track)
Then we can base these courses on True North (charts), Magnetic North (on board) and Compass Heading (on board).
More information on how to actually calculate this can be found here.
Also, use this tool to visualise what is happening: https://flighttools.justinverstijnen.nl/coursecalculator
Distances (17)
For calculating units, use this tool: https://flighttools.justinverstijnen.nl/unitcalculator/index.html
In aviation, we will use these units:
- 1NM is 1852 meters
- 1NM is 6000 feet
- 1 feet is 0,3048 meter
- 1 NM is 1,15 statute mile (15%)
- 1 Statute mile is 1609 meter
- 1 Kts is 1 nautical mile per hour which is 0,5 meter per second
- One minute on a median is 1 nautical mile (NM)
Actieradius is both to and returning to your starting point (A - B and B - A)
Range is only A to B
Scale of a map is projected like this:
1:500.000 is 1 cm on the map is 500.000 cm in real life (or 5 kilometers)
Time (19)
The apparent solar time is the actual time based on 12 o clock noon -> highest sun point
- Local time is regional time of the country, UTC is Greenwich time
- Standard time is the time of a country (actual time)
- Local Mean Time (LMT) is the actual sun time based on the setting of the sun -> linked to closest meridian
Time notation can be done in various ways:
- 1345
- 13:45
- 13:45 UTC
- 13:45 Z
- 13:45 LT (Local Time)
Calculate UTC from LMT
We can calculate the LMT from the actual time:
- 1 degree is 4 minutes
- 1 median minute is 4 seconds
- Pick the distance from your location to your actual time median and calculate the difference
Uniform Daylight period is the calibrated daylight time, + 15 minutes before sunrise and + 15 minutes after sunlight.
VFR Navigation (20)
Navigation in VFR is done based on visual references, track calculations and wind calculations. Because the wind is a mass of air where the plane flies in, we will arribe at our destination “together with the wind”. Which means we have to correct our track for the wind.
Before going into the deep explaination, let’s process all the different terms we must know:
- Gispositie: Your destination with the wind taken into account, but not entirely sure.
- True position/Fix: A fix where you cross referenced chart/GPS with what you see outside and confirmed
- Wind-triangle
- Air vector (1 triangle)
- Ground vector (2 triangles)
- Wind vector (3 triangles)
- Ground course: This is the track to be flown relative to the ground
- True track (TT) -> Track based on true north
- Magnetic track (MT/MC) -> track based on magnetic north
- Intended track: This is the chart-based ground track to be flown
- Actual track: This is the actual track flown to correct the wind
- Track error: this is how much degrees you must steer to your intended track if deviated (100 degrees intended, 90 true heading is 10 degrees track error). This is also the difference between true track and actual track if there is no wind.
- Drift: This is the amount of degrees between the intended and actual track to correct for the wind (opposite of the wind correction angle WCA is 7 degrees right means drift is 7 degrees left)
- Heading (air course): Amount of degrees based on the north where the plane flies to in the air
- True heading: Course based on true north
- True track: the flying track based on true north, and so on your VFR map
- Magnetic heading: Course based on magnetic north
- Magnetic course: the glying track based on magnetic north
- Compass heading: Magnetic corse with compass error correction added/subtracted
- Wind correction angle (opstuurhoek): this is the angle between the intended ground heading and the true heading (what to correct)
- Isogonic line: A line on a chart that represents the local magnetic variation
- Agonic line: A line on a chart that represents a magnetic variation of 0 degrees
If there is no wind, the air track, intended track and actual track are all the same value.
The wind triangle
The movement of the plane relative to the ground is decided by three vectors:
- The air vector -> Heading and True airspeed (TAS)
- The ground vector -> Track and ground speed (GS)
- The wind vector -> Wind direction and speed (260 at 8 knots)
The numbers correspond with the arrows/triangles in the drawings, but we calculate in the order 1, 3 and then 2.
Air vector
The air vector’s length is based on the true airspeed and course based on the true heading. The start position is called the true position.
Wind vector
The wind has a speed and track, but wind is pronounced where the wind comes from. This is the opposite of planes because it makes calculations easier.
Ground vector
Now we know those two values, we can make an airplot. This gives us the result of the track incl. wind correction, basically the ground vector.
Calculating Tailwind/Crosswind components
We can calculate the headwind and crosswind components with the sinus and cosinus to have a better understanding of the actual wind blowing against your plane:
Crosswind = sin(wind direction - ground course) x wind speed
Example: sin (270-285) x 12 = -3,1 knots
This means wind comes from the left with 3 knots blowing you to the right
Head/Tailwind = cos (wind direction - ground course) x wind speed
Example: cos (270-285) x 12 = 11,6 knots headwind
This means from the 12 knots wind, we get 11 knots onto head and 3 knots from cross.
You could also use these numbers to remember quickly (or take a E6-B on board)
| Wind angle | Factor crosswind (sinus) | Factor Head/tailwind (cosinus) |
| 30 degrees | 0,5 | 0,9 |
| 45 degrees | 0,7 | 0,7 |
| 60 degrees | 0,9 | 0,5 |
Example: your heading is 180, wind comes with 15 knots from 223. Difference is 43 degrees, we pick 45:
15 knots x 0,7 = 10,9 knots crosswind
15 knots x 0,7 = 10,9 knots headwind
Track error correction by incorrect steering
If deviated from the original route, we must correct this by steering the opposite way. But how much, that is something we can calculate.
We can use the 1 on 60 rule: every degree off from the intended route will result 1 nautical mile (NM) on a distance of 60 nautical miles.
Example: After 20 NM you are 2 NM from track. We will calculate this to 60 miles, which is times 3: 6 NM deviation every 60 NM. This means also 6 degrees off track.
To correct the course, we must multiply this correction times 2 to get to the original track. This is called the track error (trekfout).
Best fuel consumption methods
- To fly to a far aerodrome, fly maximum range by leaning the mixture, with tailwind and minimize drag
- To maximize endurance, fly as low as possible with minimal RPM
Als keep in mind that the disadvantages of wind are greater than the advantages. For example:
- We fly from our starting point to the east (090) with 100 knots (IAS).
- We have a wind from west to east (270) with 25 knots.
- Our ground speed (GS) will be 125 knots
- This means we are 125 nautical miles from our starting point after 60 minutes
- If we turn around, we fly into the wind which will slow us down, because we don’t have tailwind anymore our speed is back at 100 knots. In fact we have to subtract those 25 knots of wind from our ground speed
- We fly back to the starting point with 75 knots of ground speed (GS)
- However, this will take 100 minutes (1h40m) (125 nautical miles / 75 knots * 60 is 100 minutes)
Automatic Direction Finding (25)
Automatic Direction Finders or ADF in short is a piece of hardware in the plane that can contact Non directional Beacons (NDB) beacons on the ground to find the correct direction to it. It is basically tuning the frequency when in range and then read the direction the signal comes from. The frequency of ADF works between 190 kHz and 1750 kHz (LF and MF). Most NBD beacons use a frequency between 250 kHz and 550 kHz.
The plane only contains a directional-sensitive receiving system, in these 3 parts:
- Antenna system
- Control panel to tune the frequencies
- Indicator
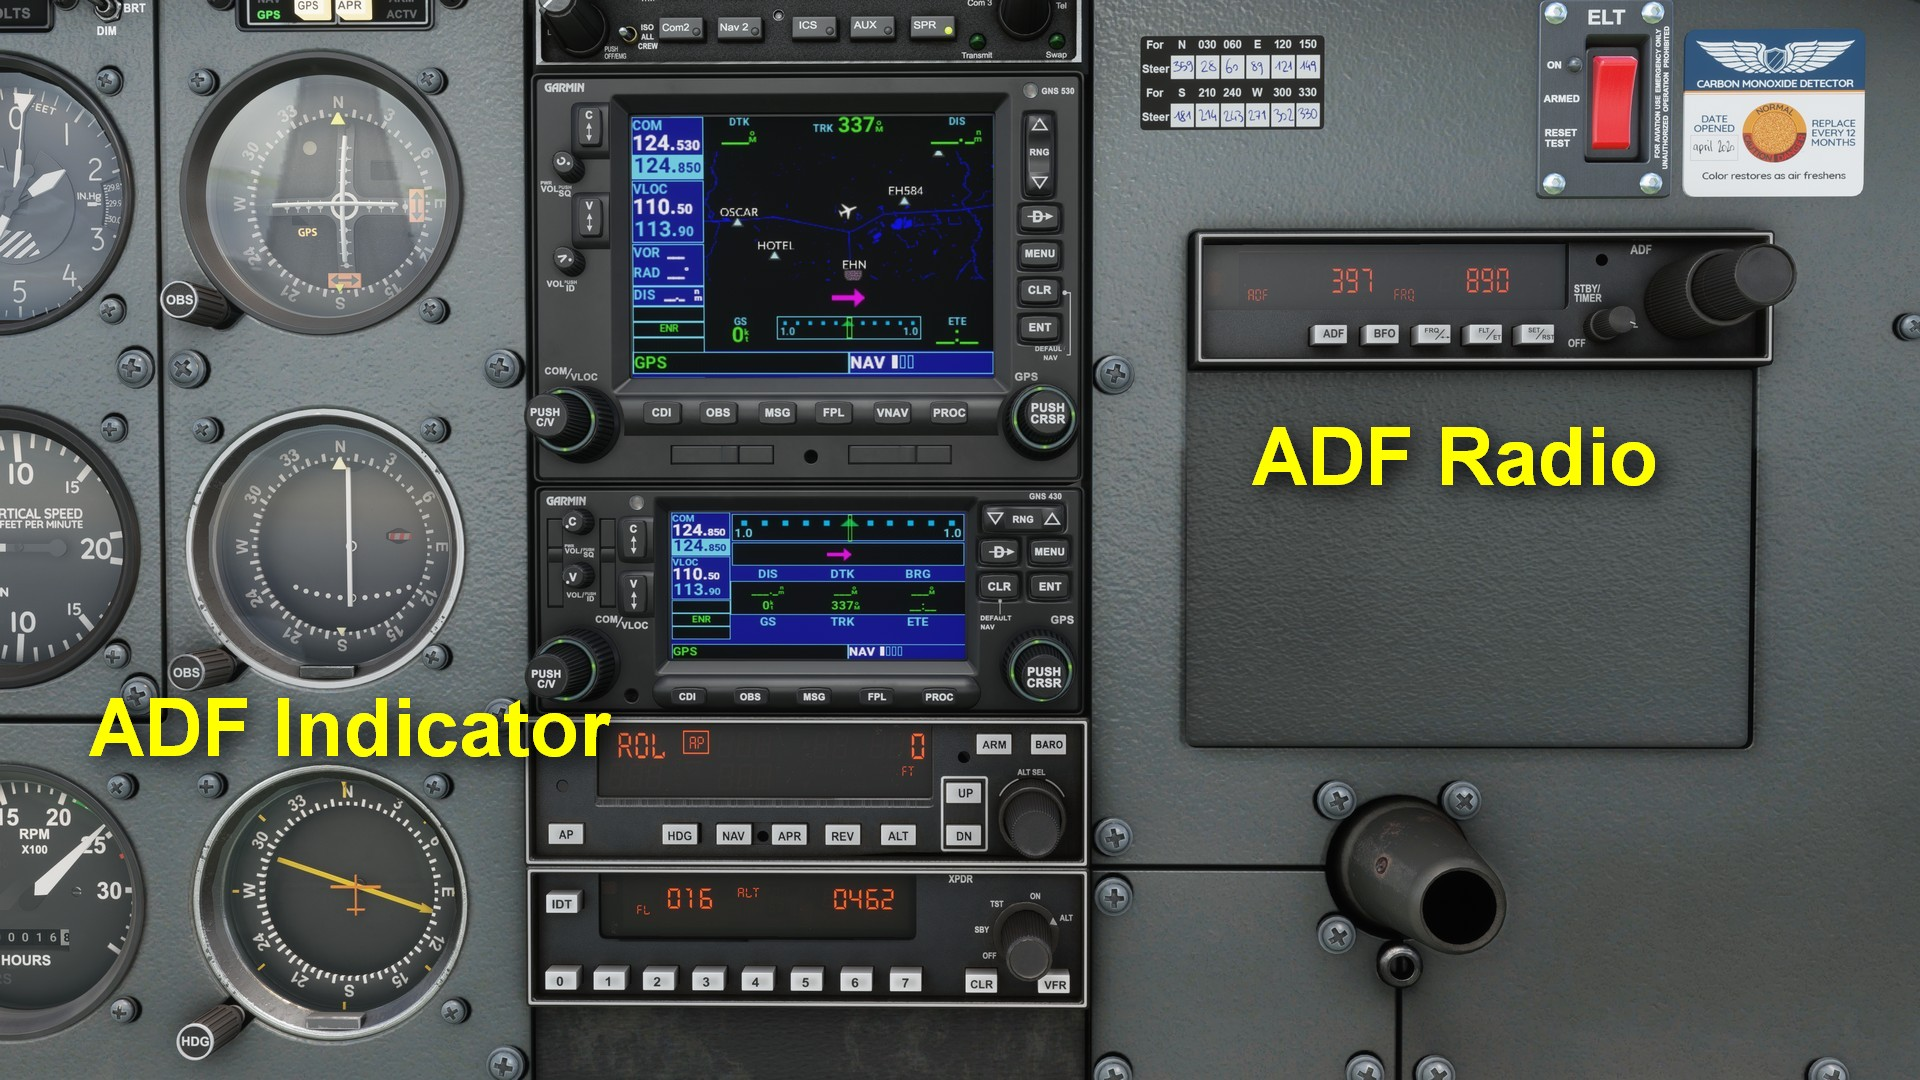
the ADF has three important buttons:
- ADF: this turns the device on, and another press enables the ANT mode which is used for testing only.
- BFO: Identify NDBs
- FRQ: to switch between stand-by and active frequency
Your ADF system in the plane only connects to NBD beacons (sometimes reffered as locators) on the ground. It then shows a relative bearing to the beacon, based on the heading of the plane. It basically says, turn till the plane in the middle of the indicator and the line are aligned.
- Relative bearing: The angle to turn to exactly the beacon
- Compass heading: The actual compass heading
- Compass bearing: The solution of the sum Compass heading + Relative Bearing
Example: We fly at 173 degrees and our ADF indicator says “69”, we sum those up and that gives us 242 degrees. We have to fly 242 degrees on our compass to fly directly to the beacon. This because the ADF gives us a relative bearing, so the “langsas” of the plane is 0 degrees.
Bearing means “peiling” in Dutch.
Now we must make it harder, we can do a magnetic bearing to the NDB beacon. We take the outcome of the sum above the blue bar and put into a new sum.
Compass bearing + deviation = magnetic bearing. This magnetic bearing is the QDM, also called, the ground track to follow to reach the NDB. The reverse of the QDM is called the QDR, which is from beacon to the plan. We have to add 180 degrees to the QDM to get the QDR.
Example: our compass bearing is 242 degrees. Our deviation is 4 degrees west (indicates too much west) so we have to subtract it. The magnetic bearing is 238 degrees.
Now we could correct this number on top of all for the true north instead of magnetic north, which gives us the “true bearing”: Magnetic bearing + variation
Example variation east: Magnetic bearing 238 + variation (2,45 degrees east) = 240,45 degrees
Example variation west: Magnetic bearing 238 + variation (2,45 degrees west) = 235,15 degrees
Look at how the variation can change the headings, because we go from magnetic to true, we have to subtract west and add east. In the case of true/chart to magnetic this flip-flops.
ADF indicators
We have 2 types of ADF indicators:
- Relative Bearing Indicator (RBI) (Left)
- Radio magnetic indicator (RMI): This is a indicator that has a gyro in it and turns with the magnetic compass. This shows the actual QDM at any time. Ligher aircraft doesn’t have a RMI.
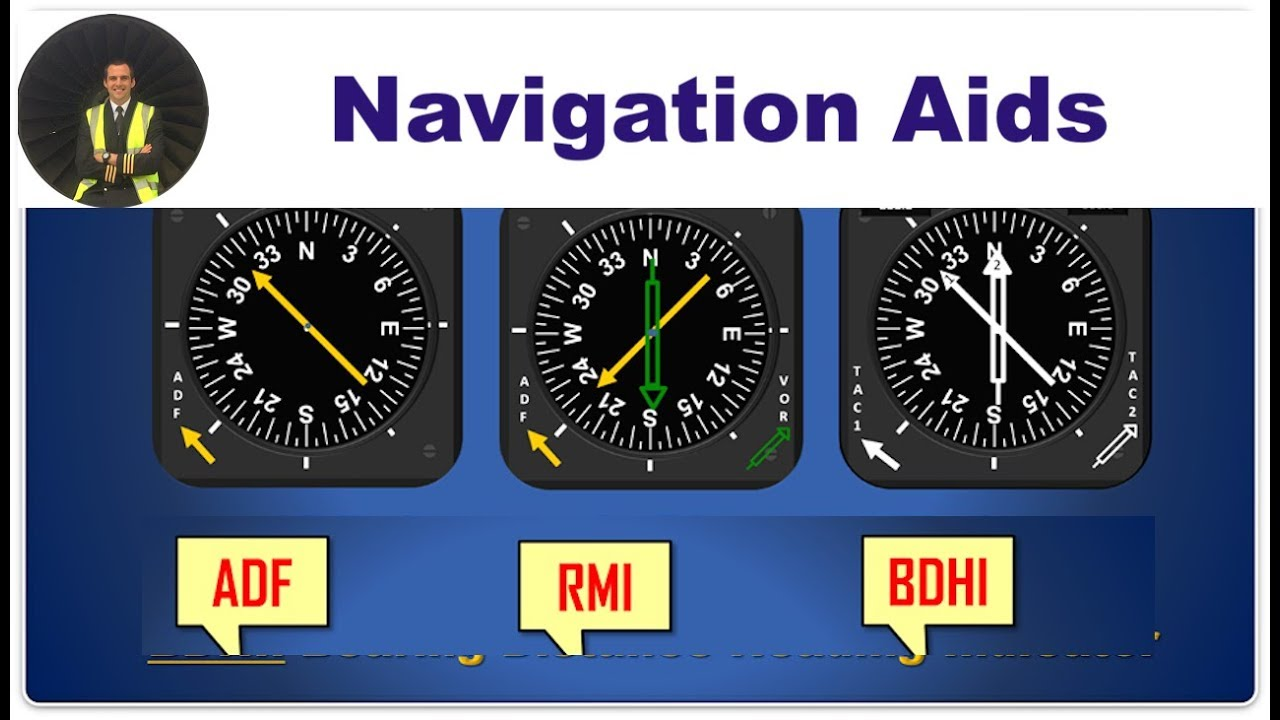
In the RMI, the green arrow is the QDM.
NDB beacons are the oldest type of beacons and are only used today as holding points. Today we have VOR/DME beacons and also the more user-friendly GPS.
NDB beacons have a range of about 10-25 NM
NDB beacons are “locators” and shows with a “L” on maps. SOmetimes they are used as approach locators.

En route beacons could have a range up to 200 NM.
Reliability
A NDB beacon is not always reliable. These are factors that plays when using NDB beacons:
- Transmit power of the transmitter
- Weather -> rain and thunderstorms
- Around 6 degrees correction
- LF/MF frequency so much affection by terrain
- Night effect -> skywaves (less range and interference)
- Coast-effect -> Curving radio waves due to sand and sea -> Rely on visual navigation in coastal areas
- Mountain effect -> curved lines/multi-path effect due to bouncing of signal
- Interference of other NDBs
VOR Navigation (26)
VOR beacons are the next evolution on top of ADF where most of the issues with ADF are fixed.
VOR stands for VHF Omnidirectional Range, and sends signals to every radial around it. It also works on VHF which makes the range and interference much better. The frequency range is 108.0 MHz to 117.975 MHz.
VORs are always based on magnetic north.
Its works basically like this: tune to the VOR frequency and your CDI will show an arrow to the beacon. On top of ADF you can select where to join the VOR radial and navigate to that. It also dhows course deviations with the needle. Also it shows if going to or from the beacon. With DME we could also measure the distance to the beacon where we will go dive in deeper in the next module.
VOR has the following advantages on top of ADF
- Less interference
- Less reliant on weather
- No strange side effects
- Better navigation as you select where to get to the VOR
- Selectable on navigation frequency
- Better precision
A VOR is an hexagon on the chart. If its outlined with a square, it also has DME.
VOR beacons push out 2 different signals:
- Reference signal: A signal which sends out signals for verification. This also contains a MORSE code to verify you are on the right VOR
- Variable signal: A lighthouse-like signal that varies over all the radials to send out a signal which planes can receive. Thus it knows where to navigate to
VOR navigates you to the magnetic north, so 0 degrees on the VOR radial is to the magnetic north. We also have to take the local variation of the beacon into account which also would be on the map.
The instrument to use with VOR beacons is the Omni Bearing Indicator (OBI), which contains the CDI (needle) and the selector (OBS) to set the desired radial of the beacon. It also shows “From” and “To”, to point out if you are flying to the beacon or flying away from it. Later more about that.
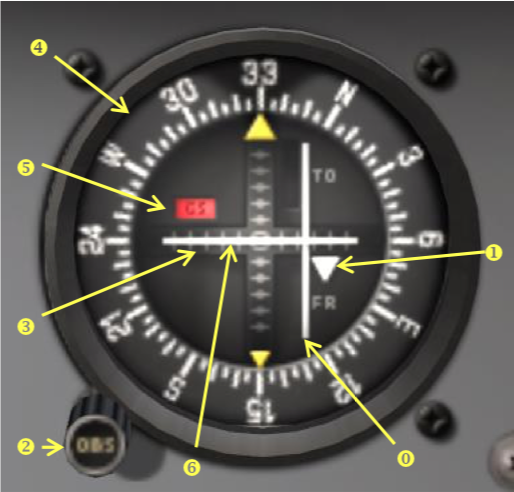
The horizontal needle represents the course/track to the beacon radial, where needle right means you are too much to the left. This is based on the view of the beacon itself. Each dot/stripe is 2 degrees off the selected radial (330 degrees in this case). The needle represents the track you must fly to get to the selected radial of the beacon.
You will select 330 degrees if you want to overfly the beacon with a heading of 330 degrees. Its as simple as that. The from region will then be 330 + and -90 degrees and the to region 330 - 180 = 150 degrees, 90 + or - that number.
- Radial: The line you are on (above screenshot: radial 150)
- Magnetic ground track (above screenshot: 330 degrees
- CDI: Course deviation Indicator/needle -> shows the correct track to steer to overfly the station at selected magnetic heading
- To/From: Shows if you are flying to or away from your selected radial - and + 90 degrees of your selected heading
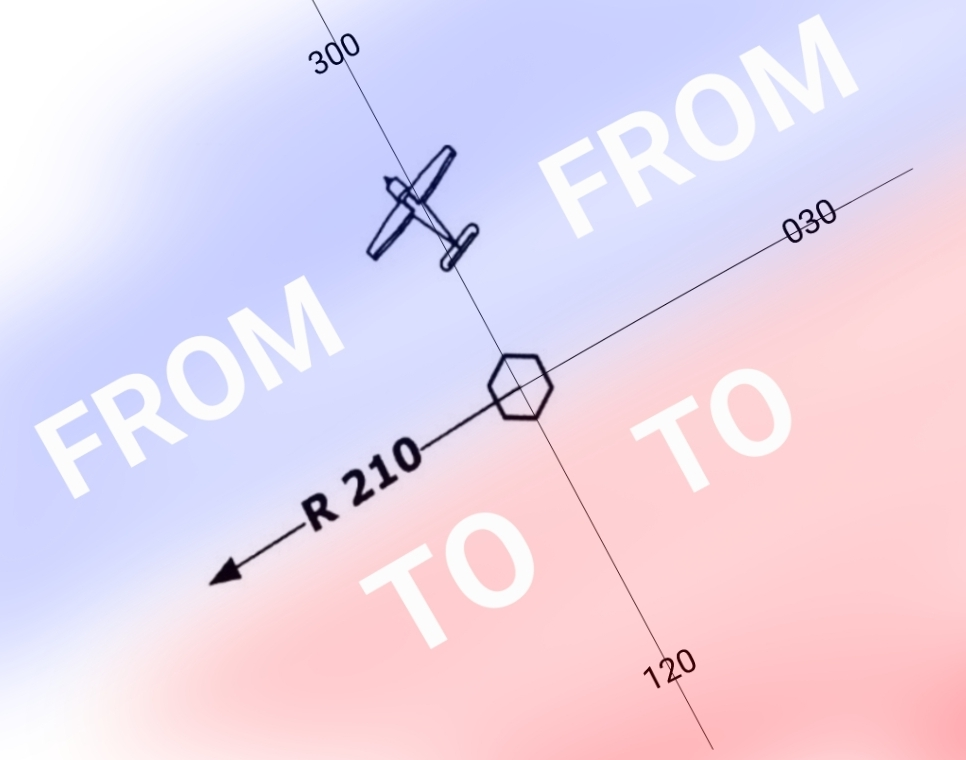
To/From indicator
The to and from indicators are shown on the right side of the indicator and will tell you if you are flying the right way. We could fly heading 0 degrees and are north of the indicator. It will then show as if we are south and flying to it. The to/from indicator will then show “From” as we are currently flying away from it. The signal will be sent into the radial but otherwise there wont be a note to tell you if the direction is correct.
As we then select the 180 degrees radial, the indicator will switch “To”. We could also use the “from” course if we need to fly 240 degrees over the beacon and then for 10 miles further.
Using the VOR navigation equipment
In the cockpit we have a separate radio for navigation. We need to tune to the frequency to start using the beacon. The frequency is on your VFR map or app.
We can tune to the frequency and set it as active to make the OBI adjust to the beacon. You can also press the IDENT button to get the unique morse code which is also on the map.
Using multiple VORs can help you getting a “fix”, or a real position as you know where you are relative to a beacon. Useful when you are lost or lost your visual references.
The range of a VOR beacon is the same as with normal VHF radios and can be calculated with this formula:
1,23 * (√antenna elevation in ft) + (√plane altitude in ft)
Let’s say, the antenna height is 1000ft and our altitude is 13.400ft:
1,23 * (√1000)+(√13400)= 181,27 nautical miles (NM)
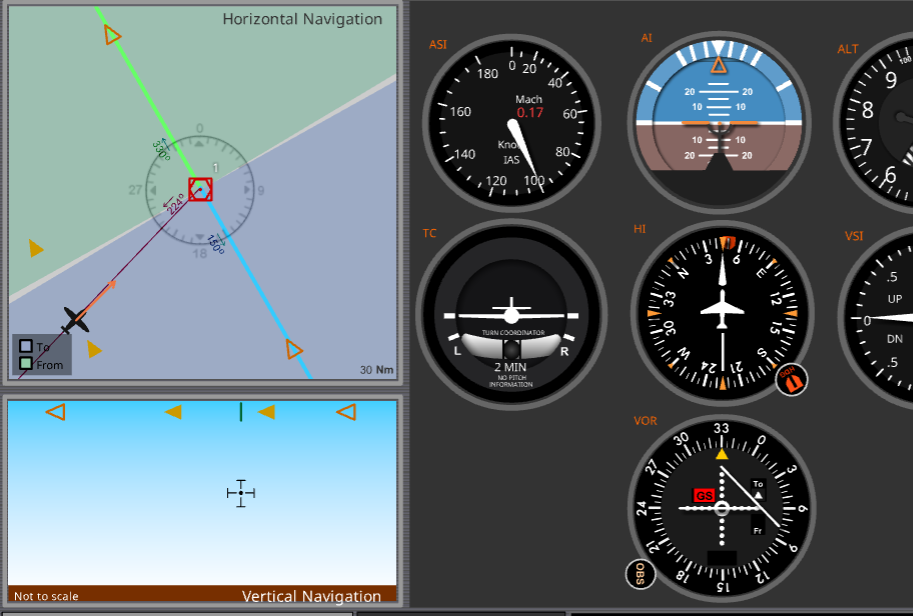
Horizontal Situation Indicator (HSI)
In newer planes, we will have a HSI instead of a CDI. This new variant doesnt use FROM/To but always shows the correct direction with an arrow. It always leads you to the correct heading and shows if on or off course to the beacon.
GPS errors
GPS is a great navigational system, but comes with different possible errors:
- Propagation errors can occur due to the ionosphere
- Geometry errors can occur due to close positioning of satallites
- Atomclocks in GPS satallites can be restored in the Master Control Station
A GPS satallite sends out 2 codes.
To get a two-dimensional (2D) fix from GPS (length and width), you need at least 3 satallies
To get a three-dimensional (3D) fix from GPS (length, width and altitude above ground), you need at least 4 satallites
1-in-60 rule
The 1 in 60 rule is a quick method to estimate how far off course you are without using trigonometry.
It is based on this practical approximation:
After traveling 60 units of distance, an error of 1 unit sideways equals an error of 1 degree.
This works because for small angles, the tangent of the angle is approximately equal to the angle itself (in degrees). It relies on small-angle approximation, which is why it is accurate for normal navigation errors.
You can use these simple calculations and I have some examples below:
- Miles off track * 60 / Miles flown = Track error in degrees (trekfout)
- Miles off track * 60 / Miles left = Correction angle (sluithoek)
When you only have the amount of degrees:
- Track error in degrees * miles flown / 60 = Track error in NM (reverse of the calculations above)
- Miles off track * 60 / Miles left = Correction angle (sluithoek)
For example:
- We plan to fly a route of 88NM in total
- After 63 NM, we find ourselves at 4 NM off track with 25 NM to go
- We do 4 * 60 / 63 which gets us 3,8 degrees off track in 60 minutes
- We do 4 * 60 / 25 which gives us 9,6 degrees which we have to correct
- This means we have to fly 3,8 degrees to correct our heading + we have to add 9,6 degrees to actually get at our destination. From the heading we have flown, subtract 13,4 degrees
Example 1 – Finding heading error
You planned to fly 60 nautical miles, but you end up 1 NM off course.
Calculation: 1 ÷ 60 × 60 = 1°
Result: Your heading was about 1 degree wrong.
Example 2 – Larger distance
You flew 120 NM and are 2 NM off course.
Calculation: 2 ÷ 120 × 60 = 1°
Result: Still about 1 degree heading error.
Example 3 – Correcting your heading
Route: 174 NM After: 112 NM Track error (drift): 6°
Using 1-in-60:
- Off-track (NM) ≈ Distance × Error(°) / 60
- Off-track ≈ 112×6/60=11.2112 × 6 / 60 = 11.2112×6/60=11.2 NM
Result: You’re about 11.2 NM off the intended track.
Calculations
Because navigation contains alot of different calculations, I will write them all down here:
Time to distance
58 NM in 40 minutes
Example: 58 / 40 minutes x 60 minutes = 87 knots
Distance to time
58 NM with a speed of 87 kts
Example: 60 minutes / 87 ground speed = 40 minutes to travel 58 NM with a constant speed of 87 kts
Speed to time
25 minutes with a speed of 110 kts is 45,8 nautical mile
Example: 110 knots / 60 minutes x 25 minutes = 45,8 nautical miles (nm)
Time to decimal
This formula shows how to calculate the decimal notation if you only have the time/DMS notation:
Formula: Degrees + (Minutes ÷ 60) + (Seconds ÷ 3600)
Example: 48° 51′ 24″ → ?
Step by step:
- Degrees: 48
- Minutes ÷ 60 = 51 ÷ 60 = 0.85
- Seconds ÷ 3600 = 24 ÷ 3600 = 0.0067
- Sum up everything: 48 + 0.85 + 0.0067 = 48.8567°
Solution is 48.8567° and we have to do this for both north/south and west/east
Decimal to time
This formula shows how to calculate the time/DMS notation if you only have decimals.
Formula:
Degrees + (Minutes x 60) + (Seconds × 60)
Example:
40.6892°
- Degrees: 40
- Minutes: 0,6892 x 60 = 41.352 rounded to 41
- Seconds: 0.352 × 60 = 21,1 rounded to 21
Solution: 40 degrees, 41 minutes and 21 seconds, in short 40° 41′ 21"
ISA to temperature on altitude
To calculate from ISA (15 degrees celsius on 1013 hpa) to a certain ground temperature on a specific altitude, use this calculation.
Example 1: Ground temperature is 26 degrees and elevation is 1650ft. The QNH is 1013
1650ft / 1000ft * 2 degrees per 1000 feet is 3,3. This means it’s 3,3 degrees warmer than ISA which must be taken into account for density altitude calculations
Example 2: Outside air temperature (OAT) means on the altitude is -9 degrees and elevation is 6225ft. The QNH is 1002
1013-1002 = 11 * 30 ft hpa is 330ft difference. The pressure is lower than 1013 so we add this to the actual altitude to get the pressure altitude: 6555ft
6555 / 1000ft * 2 degrees per 1000 feet is 13.11 degrees.
ISA temp is 15 - our temp 13.11 is 1,89 degrees according to ISA. But the actual OAT is -9 so its -9-1,89 = -10,8 degrees colder than ISA.
This can now be dialed on the E6B to get the actual density altitude:
- Pressure altitude: 6555
- OAT: -10,8
Gets you the density altitude of around 5000 feet.
Example 3: Density Altitude is 12.000, OAT is +20 degrees, calculate pressure altitude
12 x -2 + 15 (ISA) = -9
20 - (-9) = 29 degrees on the ground
120 feet per degree is 120 x 29 = 3.480 feet to subtract from density altitude
12.000 feet DA - 3.480 is 8520ft pressure altitude
Speed and distance to time
115 knots
73 Nautical mile
distance : speed = time (decimal) * 60 is time in minutes
73 : 115 * 60 is 38 minutes
Distance and time to speed
320NM
2 hours and 23 minutes
Hours and minutes to decimal -> 143 minutes
Distance : time * 60 = Speed in knots
Speed, distance and fuel flow
Speed is 125 kts
Distance is 105 NM
Fuel flow is 2,5 GPH (US Gallons per hour)
105 : 125 = 0,84 hours -> 2,5 * 0,84 = 2,1 US Gallon (x 6 to LBS if fuel density is 0,72 kg/l)
True Track/Compass Heading questions
To calculate questions about certain headings with variation and deviation into place, we can use the following abbreviation:
- Cadbury - Compass heading
- Diary - Deviation
- Milk - Magnetic Heading
- Very - Variation
- Tasty - True Heading
- Dr(iving) - Drift (or WCA)
- TTrucks - True Track (ware kaartkoers)
Let’s say, we have a True Track of 352 degrees, and we want to know some of the other values. Let’s do this:
| C | D | M | V | T | Dr | TT |
| 352 |
Now we can fill in the blanks step by step to get to the actual other values correctly and in the correct manner:
| C | D | M | V | T | Dr | TT |
| 358 | 5W | 353 | 11W | 342 | 10R | 352 |
Left to right: Subtract (-) West and Add (+)East numbers (LR -W +E) Right to left: Subtract (-) East and Add (+) West numbers (RL +W -E)
Source: https://www.youtube.com/watch?v=FtBFgr61bW8
Use this tool to calculate this stuff: https://flighttools.justinverstijnen.nl/coursecalculator/index.html
Calculating the Total compass error (miswijzing)
The Total compass error is the sum between true heading and compass heading, exactly in this format. A positive digit will give you an east error and a negative digit will give you a west error.
Temperature and altitude correction
Vuistregel: 4 ft correctie per °C temperatuurafwijking (per 1000 ft hoogteverschil)
Dat betekent:
- Temperatuur 1°C kouder dan ISA → 4 ft extra fout per 1000 ft
- Temperatuur 10°C kouder dan ISA → 40 ft fout per 1000 ft
- Temperatuur 30°C kouder dan ISA → 120 ft fout per 1000 ft
Headings/courses extra
CH 098°; deviatie +2°; variatie -8°; drift 5° L. Bereken de TT.
Kompasluchtkoers (CH) 317°; deviatie +3°; variatie 5°W; drift 10°R. Bereken de ware grondkoers (TT).
TH 358°; MH 352°; deviatie +3°. Bereken de miswijzing.
CH 317°; deviatie +3°; variatie 5°W. Opstuurhoek 10°R; er is geen trekfout. Bereken de TT.
CH 054°; deviatie +3°; variatie 5°E. Bereken de TH.
CH 224°; deviatie -3°; variatie 4°W. Bereken de TH.
CH 098°; deviatie +2°; variatie -8°; drift 5° L. Bereken de TT.
Made a tool to exactly understand this topic: https://flighttools.justinverstijnen.nl/coursecalculator
Using the E6B Flight Computer
With the E6B flight computer, we can calculate a lot of different things. On the front side, we can calculate and convert units. The other side is used to calculate true heading based on true track and the wind component. Also we get an indication of what our speed will be.
- Unit conversion
- Calculating Density altitude from pressure altitude and temperature
- Calculating true airspeed with altitude, Calibrated Airspeed (CAS) and temperature
- Calculating drift and wind correction angle
- True airspeed and wind to ground speed
Raw notes (exam preparation)
- Lambert chart (VFR Netherlands) is conform, which means angle-corrected (hoekgetrouw)
- Lambert chart has straight meridians
- Lambert chart has crossing meridians and parralels in 90 degrees angles
- DME always gives one decimal: so 2 nautical miles will be presented as 2.0
- A plane following a straight heading, also follows a loxodrome
- Meridians are both groot cirkels and loxodromes
- A grootcirkel is the shortest route and requires continious steering
- Meridian conversion is the angle of meridians and the 0 on the mercator-projection
- In the flight plan, you always mention the true airspeed (TAS).
- To get relative bearing, you do QDM - heading
- The wind vector can be determined by the air and true position (2 of the 3 of the triangle)
- WCA - track error is drift
- The wind-angle is the angle between wind and the true track
- Semi-circular altitude system will be determined based on magnetic ground course
- East: odd flight levels ending with 5 (oost = oneven) (000-179)
- West: Even flight levels ending with 5 (180-359)
- On the VFR chart, airports will be marked with elevation and then the runway length
- Time depends on the geographic length, every 15 degrees represents 1 hour, 1 degree per 4 minutes, 1 parralel minute per 4 seconds
To do examenvoorbereiding:
- VOR Beacons
- Trekfout
- ADF/Relative bearings